Analysis of Glomerular Permselectivity in the Rat Using
Theoretical Models of Hindered Transport
by
James Douglas Oliver III
S.B., Massachusetts Institute of Technology (1981)
S.M., Massachusetts Institute of Technology (1986)
Submitted to the Harvard-MIT Division of Health Sciences and Technology
in partial fulfillment of the requirements for the degree of
Doctor of Philosophy
MIT LIBRARIES
at the
APR
3 0
1993
MASSACHUSETTS INSTITUTE OF TECHNOLOGY
SCHERING
October 1992
( Massachusetts Institute of Technology 1992. All rights reserved.
Author ...
..
...
...
...
Harvard-MIT Division of Health Sciences and Technology
October 19, 1992
Certified by ...
William M. Deen
Professor of Chemical Engineering
Thesis Supervisor
Accepted by ...
...
...
Roger G. Mark
Chairman, Departmental Committee on Graduate Students
MASSAClSrSM INSITmTE
OF TECHNOLOGY
OCT 26 1992
Analysis of Glomerular Permselectivity in the Rat Using Theoretical
Models of Hindered Transport
by
James Douglas Oliver III
Submitted to the Harvard-MIT Division of Health Sciences and Technology on October 19, 1992, in partial fulfillment of the
requirements for the degree of Doctor of Philosophy
Abstract
Changes in glomerular permselectivity are the physiological basis for proteinuria, which typically accompanies chronic kidney disease. Traditionally, changes in the size-restrictive properties of the
glomerular barrier have been quantified by measuring the fractional clearance () of exogenous
infused dextrans and interpreting the results using the hindered transport theory for uncharged, solid spheres in cylindrical pores. The observed values of O for dextran in normal rats and healthy humans are unexpectedly large, however, given the normal absence of proteinuria. Recent in vitro diffusion studies show that dextran's hindered transport behavior is better represented by a random coil with attractive pore/solute interactions, while Ficoll follows the predictions for a neutral solid sphere. Thus, Ficoll sieving data should provide a better indication of the size-selective properties of the glomerular capillary wall. In one of the studies for this thesis, healthy Munich-Wistar rats were infused with either 3H-dextran or 3H-Ficoll. Plasma and urine samples were fractionated on gel chromatography columns which had been calibrated with narrowly-sized dextran and Ficoll standards. While values of O for Ficoll were similar to those measured for nearly-neutral proteins, dextran values were significantly higher at all molecular sizes. On this basis, the glomerular capillary wall is shown to be considerably more size-restrictive than had been previously determined. The random coil model was applied to the dextran data, and the attractive energy required to explain the dextran/Ficoll discrepancies in vivo was nearly the same as that required in vitro. Thus it appears that dextran's enhanced transport is nearly independent of the medium through which it travels.
The implications of the more size-restrictive barrier were examined in a second experimental protocol, in which 3H-Ficoll was infused into four groups of fawn-hooded (FH) rats: a two-kidney (2K) control group, a uninephrectomized (UNX) group, a UNX group treated with the angiotensin converting enzyme inhibitor enalapril (ENA), and a UNX group treated with the nitrous oxide in-hibitor NAME. The UNX and NAME groups had significantly higher glomerular filtration pressures
(aP) and more proteinuria than the 2K and ENA groups, but the membrane pore size parameters of the four groups were essentially the same. The extent of albuminuria correlated strongly with AP, while the total rate of excretion of non-albumin proteins did not. Because albumin is negatively charged, these findings imply that albuminuria in FH rats results from a specific defect in glomer-ular charge-, rather than size-, selectivity, induced by chronic glomerglomer-ular hypertension. Finally, to examine the potential for using fractional clearances to estimate filtration pressures in the clinical setting, the mathematical model was modified to make AP an adjustable parameter, and fitted values were compared with those actually measured in the FH rats. The fitted and measured AP did not show significant correlation, suggesting that 0 may not be sufficiently sensitive to AP to allow such estimations.
Thesis Supervisor: William M. Deen Title: Professor of Chemical Engineering
Acknowledgments
* My advisor, Bill Deen, for his continued advice, wisdom, patience, and understanding. * My thesis committee, Prof. Alan Grodzinsky, Prof. Roger Kamm, and Dr. Sharon Anderson,
for being a source of encouragement. Additional thanks are due to Sharon for her indispensable contributions in performing the Munich-Wistar rat experiments.
* The support of Dr. Barry Brenner and the Laboratory of Kidney and Electrolyte Physiology at Brigham and Women's Hospital. The work of Drs. Jacob Simons and Abraham Provoost of Erasumus University were essential in the fawn-hooded rat experiments. Special gratitude to Julia Troy, who knows everything there is to know and does everything that needs doing. * Drs. K. Granath and K. H. Ebert kindly supplied dextran and Ficoll standards for GPC
calibration. Prof. Robert Langer provided the scintillation counter and QLS equipment. The Radiation Protection/Safety Offices at MIT and Brigham and Women's, especially Judi Reilly and Milton Poirier, for their assistance with transferring samples.
* National Medical Fellowships, for a Commonwealth Fund Fellowship, and the NIH, for a pre-doctoral grant (5F 31 DK 08720-02).
* My past and present labmates, for putting up with me: Marc Davidson, Ron Phillips, Nelson Lin, Jennifer Smith, Nikola Juhasz, Claudia Drumond, Erin Malley, Randy Lewis, and Aurelie Jacquand. Come to think of it, it was actually I who put up with Nikola, but now is not a time to quibble.
* The Nerds, Kathy Donahue and Minerva (Shirley) Garcia, for their expert envelope-stuffing skills. Also to the other members of the MEMP program, who will now have to find a new shortstop.
* "Da Boyz"-Derrick Cameron, Kirk Gilpin, Steve Isabelle, Vince McNeil, Damon Phillips, Darryll Pines, Bobby Satcher, Collin Stultz. All the best to you guys, but I hope none of you ever get nominated to the Supreme Court.
* D'Juanna White, for being right all of the time.
* Innumerable friends at MIT and Harvard Medical School, and to Jamela Franklin-Kenea for finally following through on the dinner she promised.
* Unlike my friends, my family-Mom, Dad, Jeanne, June-really had no choice in the matter, but have somehow managed to keep their complaints to a minimum over the last thirty-odd years. In return, they get another book for the coffee table and an answer to the question, "What has he been doing all this time?".
Contents
1 Introduction
1.1 Clinical Relevance of Glomerular Function.
1.2 Hemodynamically-Mediated Damage of the Glomerulus ...
1.3 Thesis Summary ...
2 Background
2.1 Overview of Kidney Anatomy and Function
2.2 The Glomerular Capillary Wall ...
2.2.1 Endothelium.
2.2.2 Glomerular Basement Membrane ... 2.2.3 Epithelium ...
2.3 Control and Chemical Mediation of Glomerular Ultrafiltration ...
2.3.1 Autoregulation.
2.3.2 Tubuloglomerular Feedback and the Renin-Angiotensin-Aldosterone System
2.4 Theoretical Models of Glomerular Function ... 2.5 Glomerular Ultrafiltration ...
2.5.1 Determinants of Glomerular Ultrafiltration.
2.5.2 Theoretical Dependence of Ultrafiltration Coefficient on Parameters .... 2.5.3 Pathophysiological Behavior of Ultrafiltration Parameters ... 2.6 Glomerular Permselectivity ...
2.6.1 General Aspects.
2.6.2 Clearance ... .
2.6.3 Early Models ...
2.6.4 Isoporous Solid-Sphere Model of Permselectivity ...
2.6.5 Heteroporous Models .
2.6.6 Pathophysiological Behavior of Permselectivity Parameters ...
2.6.7 Charge Selectivity ...
3 Calibration of Gel Permea Polymer Standards
3.1 Introduction .
3.2 Theory of Gel Chromatof
3.3 Effect of Column Dispersi 3.4 Effect of Elution Volume 3.5 Materials and Methods .
3.5.1 Polymer Standard
3.5.2 Quasi-elastic Light
3.5.3 Gel Permeation Ct
3.5.4 Calculation of Dis]
3.6 Results and Discussion .
3.6.1 Quasi-elastic Light
3.6.2 Gel Permeation C]
3.6.3 Dispersion Coeffici
3.7 Summary and Conclusion
ltion Chromatography Columns with Narrowly-Sized 37
. . . ... . . . ... .37 ..
;raphy and Column Calibration ... 37
ion on Sieving Curves ... .. 39
Errors on Sieving Curves ... 41
. . . ... 45 s ... 45 t Scattering ... 45 hromatography ... 46 persion Coefficients ... 47 Scattering... ... 47 t Scattering ... ... . .. . . . . 47 hromatography ... 49 ients ... 52 s ... ... 52
4 Comparison of Ficoll and Dextran Sieving in 4.1 Introduction ... 4.2 Materials and Methods ... 4.2.1 Preparation of Radiolabeled Polymers 4.2.2 Animal Studies ... the . .. . .. . .. . Normal . . . . . . . . . Munich-Wistar . . . . . . . .. . . . .. . . . . . 15 15 15 17 19 ... ...19 19 20 20 22 22 23 24 25 25 25 28 29 30 30 30 31 32 35 36 36 Rat . . . . . . . . . . . 55 55 57 57 57
4.2.2.1 Animals. ... 4.2.2.2 Surgical Preparation ...
4.2.2.3 Whole Kidney Hemodynamic Measurements . . .
4.2.2.4 Micropuncture Measurements. ...
4.2.2.5 Tracer Infusion and Collection ... 4.2.2.6 Analytical Methods ...
4.2.3 Fractionation of Radiolabeled Plasma and Urine Samples
4.2.4 Calculation of Sieving Coefficients ...
4.2.5 Data Analysis .
4.3 Results...
4.3.1 Hemodynamic Data ... 4.3.2 Sieving Data ... 4.3.3 Pore Size Parameters ...
4.3.4 Sensitivity of Calculations to Hemodynamic Inputs ... 4.4 Discussion ...
5 Application of the Random Coil Model of Hindered Transport to Dextran Sieving Data
5.1 Chemical Structure of Dextran ... 5.2 Review of Previous Theoretical Work ...
5.2.1 General Approach.
5.2.2 Calculation of Steric Parameters ... 5.2.2.1 Monte Carlo Method ... 5.2.2.2 Diffusion Equation Model ... 5.2.3 Hydrodynamic Parameters ... 5.2.4 Model Results ...
5.3 Goals ...
5.4 Calculation of Steric Parameters at Small A . ...
5.4.1 Methods. ... 5.4.2 Results ...
5.4.2.1 Computation Time.
5.4.2.2 Steric Parameters ... 5.4.2.3 Error Estimations ... 5.5 Estimation of Steric Parameters at Large Ag ...
5.5.1 General Approach.
5.5.2 Partition Coefficient () ...
5.5.3 Radial Flow-Averaged Steric Parameter (Q) ... 5.6 Estimation of Hydrodynamic Parameters at Large Ag .
5.7 Interpolation Procedure for Sieving Calculations ... 5.8 Theoretical Effect of E on Glomerular Sieving ... 5.9 Fit of Energy Parameter to Dextran Sieving Data ...
5.9.1 Methods. ...
5.9.2 Results.
5.10 Discussion.
6 Ficoll Sieving in Fawn-Hooded Rats
6.1 Introduction.
6.1.1 The Fawn-Hooded Rat .
6.1.2 The Model of Renal Ablation ...
57 58 58 58 59 59 60 60 60 62 62 62 62 68 71 77 77 77 77 78 78 79 79 79 80 80 80 83 83 83 91 95 95 95 102 105 105 106 106 106 106 113 117 117 117 117 . . . . . . . . . . . . . . . . . . . . . . . . . . . . . . . . . . . . . . . . . . . . . . . . . . . . . . . . . . . .
6.2.2.1 Animals ... 6.2.2.2 Surgical Preparation ...
6.2.2.3 Whole Kidney Hemodynamic Me
6.2.2.4 Micropuncture Measurements. .
6.2.2.5 Tracer Infusion and Collection .
6.2.2.6 Analytical Methods.
6.2.3 Fractionation of Radiolabeled Plasma and
fi9) A lilliarn rF - vnf a fir entc4
... .118 ... .119 asurel . Urin Urine mei Sa its . .. . .. . .. . .. . .. . .. . .. . .. . .. 6.2.5 Data Analysis . 6.3 Results. ... 6.3.1 Hemodynamic Data ... 6.3.2 Sieving Data ... 6.3.3 Pore Size Parameters ... 6.3.4 Data Correlations. 6.3.4.1 Correlation of Hemodynamic Parameters 6.4 Discussion ... 7 Estimation of Glomerular Transcapillary Sieving Curves 7.1 Introduction . ... 7.1.1 Previous Work. 7.1.2 Theoretical Considerations .... 7.2 Preliminary Calculations ... 7.3 Fitting of AP to Fawn-Hooded Rat Data 7.3.1 Methods . 7.3.2 Results and Discussion ... 119 119 120 120 120 120 120 121 121 125 129 130 130 136 Hydraulic Pressure in the Rat from 143 143 143 144 145 145 145 149 8 Conclusions and Recommendations 155 Bibliography 157 A List of Principal Symbols 173 B Modifications to Numerical Integrations for Heteroporous Models 175 B.1 Scheme for Faster Calculation of Approximation Integrals ... 175
B.2 Endpoint Calculation for Lognormal Distribution Integrations ... . 176
C Statistics of Scintillation Counting and Determination of Minimum Acceptable Levels of Detection 179 C.1 Standard Error of Total Counts ... 179
C.2 Standard Error of Counting Rate. . . . .. . ... 179
C.3 Minimum Acceptable Activity ... 180
C.4 Calculations ... 180
D Tabulated Parameters from Monte Carlo Simulations 183
E Error Analysis for Monte Carlo Simulations
E.1 Probability Estimate Error ... E.2 Profile Integration Error ...
E.2.1 Definitions.
E.2.2 Calculation of Steric Factor Variances ... E.2.2.1 Neutral Pore ...
E.2.2.2 Pore with Square-well Potential ....
189 189 189 189 190 190 192 195 F Estimation of Molecular Dimensions of Dextran in Water
... ... ... ... ; . . . . ... ... ... ... ... ... ... ... ... ... ... ... ... ... ... ... ... ... ... ... ... ...
F.1 Overview and Summary ... 195
F.2 Summary of Theory and Equations . . . ... 195
F.2.1 Relationship of Ideal and Real Chain Dimensions . ... . 195
F.2.2 Determination of Unperturbed Molecular Dimensions from Intrinsic Viscosity Data ... ... 196
F.2.3 Effect of Sample Polydispersity on Viscosity Measurements ... 197
F.2.4 Determination of the Linear Expansion Coefficient as . ... . 198
F.2.4.1 as from Intrinsic Viscosity Data ... . 199
F.2.4.2 as from Radius of Gyration Data ... .... 199
F.2.4.3 as from Second Virial Coefficient Data ... 199
F.2.5 Determination of Skeletal Factor a and Bond Dimensions n and I ... 200
F.2.6 Determination of Branching Factor g/go ... 200
F.3 Summary of Available Dextran/Water Solution Data . . . ... 202
F.4 Results ... 203
F.4.1 Unperturbed Dimensions from Graphical Analyses . ... 203
F.4.2 Expansion Factor from Intrinsic Viscosity . ... 210
F.4.3 Expansion Factor from Radius of Gyration . ... 210
F.4.4 Expansion Factor from Second Virial Coefficient ... ... 210
F.4.5 Skeletal Factor ... . ... 213
F.4.6 Equivalent Bond Dimensions N and L . . ... 213
List of Figures
2-1 Glomerular capillary structure. ... ... ... 21
2-2 Model of glomerular ultrafiltration. . . . . ... ... 26
2-3 Pore model of glomerular permselectivity. ... 33
3-1 Theoretical effect of a shift in sieving curve due to r, calibration error . ... 40.
3-2 Theoretical effects of column dispersion on plasma and urine elution curves ... 42
3-3 Theoretical effects of column dispersion on sieving curves. ... ... 43
3-4 Theoretical effects of "tube shift" on sieving curves. ... . 44
3-5 Graphical method of calculating peak variance. ... .. 47
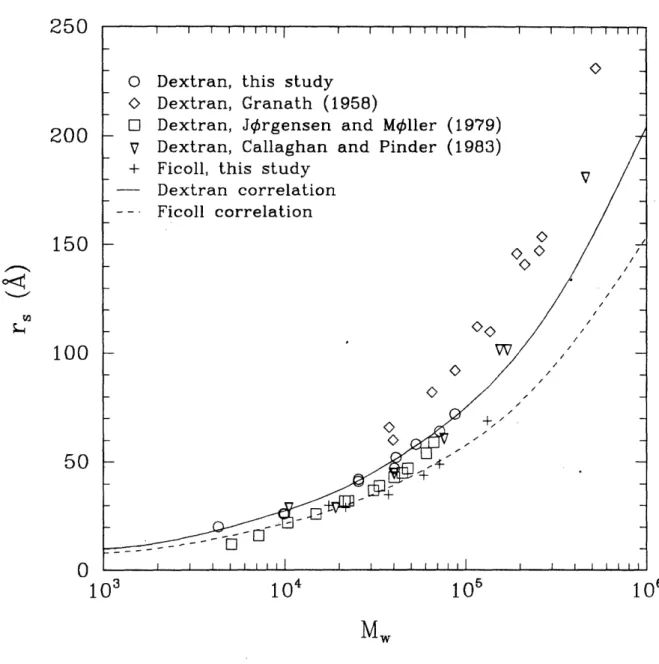
3-6 Stokes-Einstein radius (r, ) of dextran and Ficoll as a function of weight-average molec-ular weight (M,) ... ... 48
3-7 Fractional retention volume (Ka,) as a function of Stokes-Einstein radius (r,) for dextran, Ficoll, and various globular proteins on Sephacryl S-300 HR columns. ... 50
3-8 Molecular radius correction factors for dextran and Ficoll on Sephacryl S-300 HR and Sephadex S-100 columns. ... 51
3-9 Dispersion coefficients for dextran and Ficoll on Sephacryl S-300 HR columns... 53
4-1 Sieving coefficients () for dextran- and Ficoll-infused normal Munich-Wistar rats as a function of molecular radius (r,). . . .. . ... . . . ... . ... 65
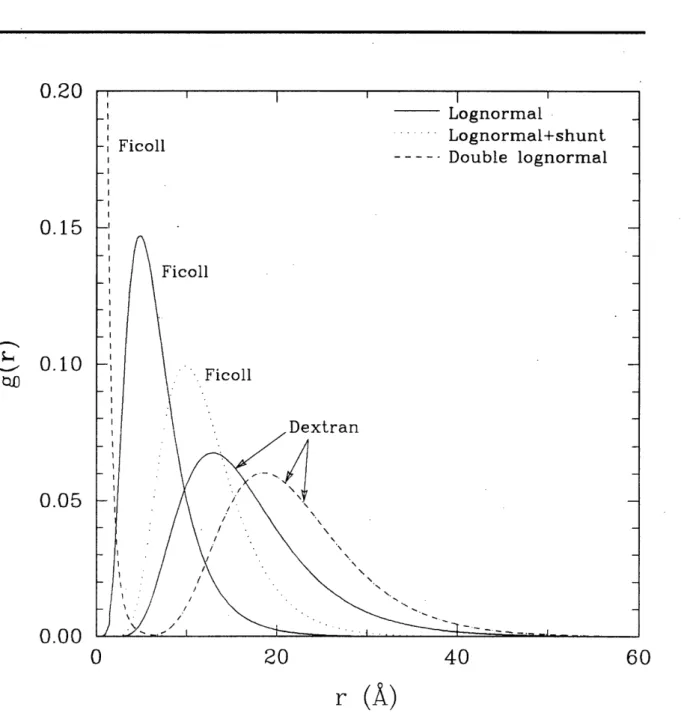
4-2 Pore number density distributions g(r) for dextran and Ficoll heteroporous fits to data. 69 4-3 Integral volume flux (1 - V(r)) for dextran and Ficoll heteroporous fits to data.... 70
4-4 Sensitivity of theoretical sieving curves to changes in QA for isoporous + shunt and lognormal models . . . .. .... 72
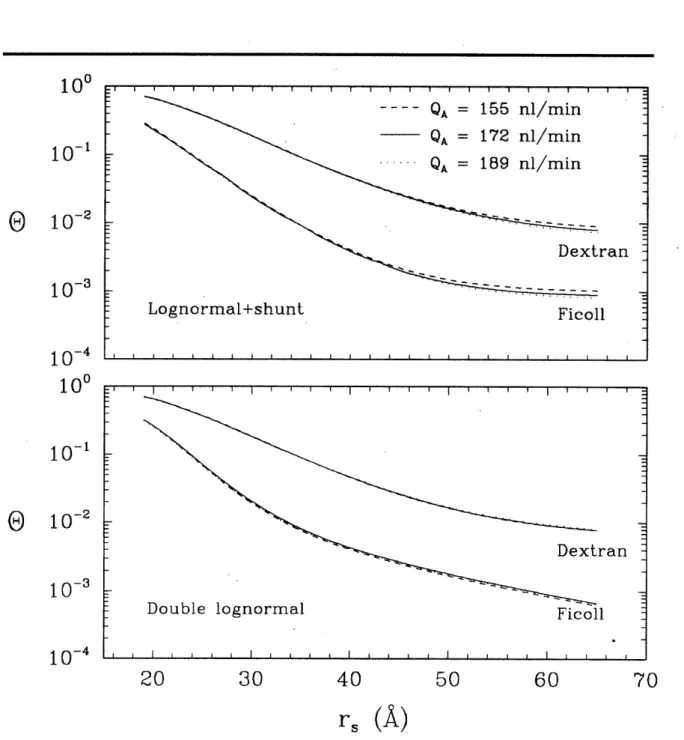
4-5 Sensitivity of theoretical sieving curves to changes in QA for lognormal + shunt and double lognormal models. . . . .. . . 73
5-1 Model geometry for Monte Carlo simulations ... ... 82
5-2 Partition coefficient () as a function of energy parameter () for n = 200, d = I case. 84 5-3 Flow-weighted average steric parameter () as a function of energy parameter () for n = 200, d = I case . ... ... 85
5-4 Partition coefficient () as a function of energy parameter () for n = 200, d = ro case. 87 5-5 Flow-weighted average steric parameter () as a function of energy parameter () for n = 200, d = ro case ... 88
5-6 Partition coefficient () as a function of number of chain segments (n) for neutral (e = 0) case ... ... 89
5-7 Partition coefficient (I) as a function of number of chain segments (n) for = -0.2, d=l. ... 90
5-8 Partition coefficient (4) as a function of number of chain segments (n) for E = -0.02, d =r ... .. . ... 92
5-9 95% confidence limits on for n = 20 and n = 800. ... 93
5-10 Asymmetry factor ']bleft - brightl/1avg for n = 20 and n = 800. ... 94
5-11 Polynomial extrapolation to t(1.6, 0) as a function of the extrapolation endpoint Ag. 97 5-12 Polynomial extrapolation to f(3.0, 0) as a function of the extrapolation endpoint Ag. 98 5-13 Oln(f) nf(e+b)-nl+(e) as a function of Ag for n = 20. ... 99
5-14 n()ln as a function of A for n = 200. ... 100
5-15 Extrapolated values (Ag > 1.6) of 4' as a function of e for n = 100. ... 101
5-16 iQ/4 for n = 20 and n = 800. ... 103
5-17 Extrapolated values (Ag > 1.6) of Q as a function of e for n = 100. ... 104 5-18 Effect of energy parameter on ® for isoporous membrane with r0o = 50
A,
d = I case. 1075-19 Effect of energy parameter e on e for isoporous membrane with ro = 50
A,
d = ro case. 108 5-20 Fit of energy parameter to dextran data for various heteroporous models, d = I case. 1095-21 Fit of energy parameter e to dextran data for various heteroporous models, d = ro case. 110 5-22 Comparison of free draining (K- 1= 1, G = 1) to neutral and attractive coil models. 114
6-1 Comparison of average albumin and non-albumin protein excretions for experimental
groups ... ... ... 123
6-2 Sieving coefficients () for Ficoll-infused fawn-hooded rats as a function of molecular radius (,). ... ... 128
6-3 Fits of various heteroporous distribution models to two-kidney fawn-hooded rat data. 131 6-4 Fits of various heteroporous distribution models to uninephrectomized fawn-hooded rat data ... ... 132
6-5 Fits of various heteroporous distribution models to uninephrectomized + enalapril-treated fawn-hooded rat data ... 133
6-6 Fits of various heteroporous distribution models to uninephrectomized + NAME-treated fawn-hooded rat data ... . ... 134
6-7 Pore number density distributions g(r) for fits to fawn-hooded rat data. 135 6-8 Correlation of filtration pressure (AP) to urinary albumin excretion (UV )... 138
6-9 Correlation of filtration pressure (AP) to urinary non-albumin protein excretion (U(P-a)V) ). ... 139
6-10 Correlation of filtration pressure (AP) to fractional albumin excretion (U V/Up V).. 140
7-1 Theoretical effects of changes in isoporous ro compared to changes in AP at constant SNGFR ... ... 146
7-2 Comparison of measured and fitted changes in AP from published dextran sieving data using the isoporous, solid-sphere model. ... ... 148
7-3 Correlation of O(r,) with AP for fawn-hooded rats. ... 150
7-4 Correlation of measured to fitted AP for isoporous + shunt model . ... 151
7-5 Correlation of measured to fitted AP for lognormal model. ... 152
7-6 Correlation of measured to fitted AP for lognormal + shunt model. . ... 153
F-1 Intrinsic viscosity versus molecular weight for data of Table F.1. ... 204
F-2 Summary of reported values of rg from light-scattering measurements for dextran/water systems. ... 205
F-3 Summary of reported values of the second virial coefficient (A2) for dextran/water systems ... ... . .. 206
F-4 Stockmayer-Fixman plots for data of Table F.1. ... ... 207
F-5 Inagaki-Ptitsyn plots for data of Table F.1. ... 208
F-6 Berry plots for data of Table F.1. . . . ... 209
F-7 Values of the cubed hydrodynamic radius expansion coefficient (a3) from data of Table F.1 . . . .... 211
F-8 Values of the radius of gyration expansion coefficient (a2) calculated from second virial coefficient . . . .... 212
List of Tables
2.1 Chemical modulators of glomerular hemodynamics. . . . ... 23
3.1 Polymer standards used for GPC calibration. ... 45
3.2 Constants in correlations of Kay versus rT (Eq. 3.8). ... 49
4.1 Mean systemic and whole kidney quantities for dextran- and Ficoll-infused normal Munich-Wistar rats ... 63
4.2 Single nephron pressures and flows for dextran- and Ficoll-infused normal Munich-Wistar rats rats. ... . . 64
4.3 Sieving coefficients for dextran- and Ficoll-infused normal Munich-Wistar rats. .... 64
4.4 Membrane pore parameter fits of dextran vs. Ficoll sieving coefficients to single nephron hemodynamic values ... 66
4.5 F-test comparisons of heteroporous model fits to dextran vs. Ficoll data ... 68
4.6 Sensitivity of parameter fits to hemodynamic inputs ... 71
5.1 CPU minutes required for Monte Carlo simulations on a Cray X-MP EA/464. .... 86
5.2 Fit of energy parameter to dextran data using Ficoll pore parameters. ... 111
5.3 Oi,extrap/Oi (in %) for random coil fits. ... 112
6.1 Hemodynamic values for fawn-hooded rats which underwent Ficoll sieving studies. . 121 6.2 Hemodynamic values for all fawn-hooded rats. ... 122
6.3 Hemodynamic values for two-kidney rats. ... 124
6.4 Hemodynamic values for NAME rats ... ... . 125
6.5 Ficoll sieving coefficients for two-kidney and UNX fawn-hooded rats . ... 126
6.6 Ficoll sieving coefficients for UNX+enalapril and UNX+NAME fawn-hooded rats. . 127 6.7 Membrane pore parameter fits of fawn-hooded rat sieving coefficients to single nephron hemodynamic values of Table 6.1 ... 129
6.8 F-test comparisons of heteroporous model fits to fawn-hooded rat data . ... 129
6.9 Correlation coefficients of whole kidney and single nephron hemodynamic quantities in fawn-hooded rats ... 130
6.10 Correlation coefficients of sieving and proteinuria measurements with hemodynamic parameters... . ... ... 137
7.1 Comparison of measure and fitted AP from published fractional clearance data for dextran in rats using the isoporous, solid-sphere model. ... 147
7.2 Fits of pore parameters plus AP to group-averaged sieving coefficients . ... 154
D.1 Monte Carlo calculations for A4, = 0, d = .. ... 183
D.2 Monte Carlo calculations for Qf, = 0, d = .. ... ... 183
D.3 Monte Carlo calculations for , e = -0.05, d=l ... 184
D.4 Monte Carlo calculations for Q, E = -0.05, d = .. ... . 184
D.5 Monte Carlo calculations for A, E = -0.10, d = . ... .... . 184
D.6 Monte Carlo calculations for , E = -0.10, d = . ... 185
D.7 Monte Carlo calculations for AP, = -0.15, d = ... 185
D.8 Monte Carlo calculations for , = -0.15, d = ... 185
D.9 Monte Carlo calculations for A, = -0.20, d = ... 186
D.10 Monte Carlo calculations for f, e = -0.20, d = . ... 186
D.11 Monte Carlo calculations for i, = -0.25, d = ... 186
D.12 Monte Carlo calculations for Q. E = -0.25, d = ... 187
D.13 Monte Carlo calculations for 4, E = -0.30, d = . ... 187
F.1 Summary of literature data available for the intrinsic viscosity of dextran in water
Chapter 1
Introduction
1.1
Clinical Relevance of Glomerular Function
The spectrum of glomerular diseases includes both primary entities such as the glomerulonephrites, whose principal involvement is with the kidney, and systemic diseases such as diabetes and essential hypertension, where the renal involvement is a secondary outgrowth. Leaf and Cotran1 63 classify the mechanisms for the pathogenesis of glomerular injury into three types: those that are immune-mediated, those that result from altered glomerular hemodynamics, and those that are related to loss of glomerular charge-selectivity (which can more generally be extended to a loss of overall permselectivity). This classification scheme is not mutually exclusive, as changes in hemodynamic patterns and permselectivity have been observed in both immune- and non-immune mediated disease. Perhaps a better method of categorization is to divide into those disorders in which there is a primary chemically- or immune-mediated derangement in the glomerular wall and those in which the injury is secondary to hemodynamic changes. Again, however, the distinction is not clear-cut since, as described in the following section, primary disease affecting some glomeruli can lead to altered hemodynamics and secondary disease in other healthy glomeruli.
The two most important clinical manifestations of glomerular disease are a decreased urinary output, a consequence of a reduction in the glomerular filtration rate (GFR), and proteinuria, the loss of serum proteins-predominantly albumin-in the urine, which results from a loss of the ability of the glomerulus to retain large and anionic molecules in the intracapillary space.
Several models of glomerular disease in the rat and other animals have been used to explore the etiologies and pathophysiologies of renal disorders. These models have the advantage over clinical studies in that hemodynamic parameters such as the transmural hydraulic pressure and the ultrafiltration coefficient can be directly measured. In addition, such experiments pioneered the use of exogenous polymers to study the permeability properties of the glomerular capillary wall. An important result of these studies is the hypothesis for the hemodynamically-mediated progression of glomerular disease.
1.2 Hemodynamically-Mediated Damage of the Glomerulus
The role of altered glomerular hemodynamics in the pathogenesis of renal injury is of interest because of the adaptive response of the kidney to reductions in renal mass: an increase in glomerular pressure results in a higher filtration rate plus structural and functional hypertrophy.12 8 Surgical ablation of
renal tissue is a common animal model for this process. Total glomerular filtration rate is maintained through hyperfiltration, but at a cost of a progressive sclerotic process which eventually reduces function in the surviving nephrons. Data also suggests losses in the ability of the glomerular capillary wall to discriminate on the basis of both size and charge.19 8
An example of a disease in which this mechanism appears to play an important role is diabetes mellitus.4 9,10 1,180,18 7, 226,242, 255A hallmark of the renal involvement in clinical diabetes is sustained hyperfiltration in the early years followed by a reduction in GFR and increased proteinuria. Histo-logically, characteristic nodular sclerotic lesions develop in the glomerulus. The filtration barrier to large molecules is reduced, and evidence suggests that the charge selectivity is also impaired.4 9,0 11, 2 42 Animal models of streptozotocin- and alloxan-induced diabetes show similar pathological changes and alterations in hemodynamics and size-permselective properties.2 9,177,178,205,26 6 The charge-selectivity of diabetic glomeruli has not been studied extensively, but one study of alloxan-induced diabetes indicates a unique and unexplained enhancement of this property.'7 8
A different example of the connection between renal performance and hemodynamics is in patients who are postoperative from cardiac surgery, where impaired cardiac output is sometimes associated with azotemia or renal failure. One report indicates that glomerular hypofiltration is associated with a decrease in the intrinsic ultrafiltration ability of the membrane.l8 6 There was no apparent change in the permselective properties in this study nor in a study in the rat of decreased perfusion pressure,25 3 but the data is too limited to be conclusive.
It is therefore of considerable interest to find a means to ameliorate the damage caused by hyperfiltration. Dietary protein restriction has been shown as one way by which glomerular pressure and filtration rate can be reduced, accompanied by diminished glomerulosclerosis.3 8 L28,175 The therapeutic use of angiotensin I converting enzyme (ACE) inhibitors in arresting the progression of renal damage has been investigated in models of renal ablation6,7,175 and diabetes.2 66 Three generalizations emerge as a result of this work:
1. Anatomical damage to the glomerular capillary wall and progressive proteinuria can be arrested by normalization of the transmural hydraulic pressure difference, even if the filtration rate per
se remains high.6'l2 8
2. Renal damage is prevented by purely hemodynamic interventions even if an underlying systemic abnormality, such as diabetes, persists.l 75'2 66
development of a method for estimating glomerular filtration pressures in humans is strongly moti-vated for monitoring the efficacy of therapeutic interventions.
1.3 Thesis Summary
The goals of this thesis were to extend the applications of sieving curve analysis, in particular to the study of the interactions between renal hemodynamics, proteinuria, and the progression of renal disease. Chapter 2 summarizes glomerular anatomy and physiology and the relevant mathematical models. The remaining chapters address specific issues related to the thesis goals:
1. Methodological issues of gel chromatography calibration and dispersion and their effects on the accuracy of sieving data were examined (Chapter 3).
2. Dextran and Ficoll tracer studies were performed in Munich-Wistar rats to determine the effect of molecular configuration on glomerular sieving (Chapter 4). The dextran data was then analyzed using recent theoretical developments in the transport of linear chains through pores (Chapter 5).
3. To examine more systematically the interaction between hemodynamics and size-selectivity, Ficoll tracer studies were performed in groups of fawn-hooded rats in varying states of chronic renal disease (Chapter 6).
4. Finally, a computational approach for estimating glomerular transmural hydraulic pressure from sieving data was developed and applied to the data from the fawn-hooded rats (Chap-ter 7).
Chapter 2
Background
2.1
Overview of Kidney Anatomy and Function
The kidneys are paired retroperitoneal organs lying on opposite sides of the vertebral column, be-tween the twelfth thoracic and third lumbar vertebrae. The primary function of the kidney is to maintain the so-called internal milieu of the body by regulating the volume and composition of the extracellular fluid. The initial mechanism is the filtration of blood through a specialized capillary wall into the renal tubules. Blood constituents that are too large (such as cells) or too highly an-ionic (such as proteins) to pass through the capillary wall are retained in the blood stream. The rest of the kidney serves to reabsorb the vast majority of the water and important solutes from the tubules, to secrete other solutes at various stages, and ultimately to form a urine concentrated in waste materials.
Each kidney obtains its blood supply from a renal artery which branches into smaller segmental, interlobar, and interlobular arteries, until the level of the afferent arterioles is reached. The afferent arteriole feeds into the functional unit of the kidney, the nephron. A nephron is responsible for the filtration and downstream processing of the ultrafiltrate from a single afferent arteriole. Each nephron consists of a glomerulus, a tubule, and a collecting duct. Broadly speaking, the glomerulus is the site of filtration, the tubule is the location of water and solute reabsorption and secretion, and the duct is the site of urine concentration. The high level of activity required at each of these three stages is indicated by the volume flow rates: renal blood flow (RBF) in a 70-kg human being is about 1.2 /min, one-fifth of the resting cardiac output,3 6 which translates to a renal plasma flow
(RPF) of about 0.54 /min. The total glomerular filtration rate (GFR) is about 0.13 l/min.3 7 Since normal urine output over a 24-hour period is approximately one liter,163 only 0.5% of the filtered volume is actually excreted.
The animals most commonly studied as models for human kidney function are rats and dogs. A human kidney has around 1.2 x 10⁶ nephrons, while a dog's has approximately 4.3 x 10⁵and a rat's, about 3.2 x 104.240 On the basis of total renal blood flow rate per mass of kidney tissue, all three species have comparable values ranging from 3 to 5 ml/min/g.4 1
2.2
The Glomerular Capillary Wall
The glomerulus is the site of the first step in urine formation-the creation of a cell- and protein-free filtrate of the blood. A glomerulus is a tuft of interweaving and interconnecting capillaries
about 200 Am in diameter enclosed by Bowman's capsule, a bi-layer of squamous epithelium over basement membrane (Figure 2-1a). Ultrafiltrate flows from the capillary into the cavity-known as Bowman's space-between the vessel tuft and Bowman's capsule. A glomerulus has four histological components: the mesangial cells, which provide the architectural support, and the three layers of the glomerular capillary wall-the vascular endothelium, glomerular basement membrane, and visceral epithelium. Under normal circumstances, the bulk of filtration occurs through the capillary wall, with a small but undetermined percentage filtering through the mesangium. 17 In some pathological conditions, the amount of mesangial filtration may be increased.22 2
There have been several attempts to pinpoint anatomical sites which demonstrate size or charge selectivity. Permeability studies with electron-dense tracers indicated that the glomerular basement membrane was a primary source of restriction,9 7 but as emphasized by Skorecki et al.,23l the
numer-ous interactions between the cellular and acellular components of the capillary wall make it difficult to attribute selective properties to any one particular component. Rather, it appears that the charge and structure of the combined endothelium, basement membrane, and epithelium all contribute to the filtration properties of the glomerulus.
2.2.1 Endothelium
The vascular endothelial cells of the glomerulus, which line the inner lumen of the capillaries, are perforated by small openings, or fenestrae, 500 to 1000 A wide. These fenestrae are unique in that they allow for direct exposure of the basement membrane to the plasma, in contrast to fenes-trated capillaries of endocrine glands and intestine which have diaphragms. Thus it appears that the endothelium provides almost no resistance to the passage of macromolecules.9 7 Endothelial cell membranes have sialic acid-containing glycoproteins which are postulated to be important for main-taining the structure of the capillary wall and for some charge-selectivity.
2.2.2 Glomerular Basement Membrane
Histologically, the glomerular basement membrane (GBM) is seen to have three distinct layers. Two lucent layers, the lamina rarae interna and externa, are adjacent to the endothelium and epithelium, respectively. The more opaque lamina densa lies between the two (Figure 2-lb).
The GBM, with a thickness of 3500 A in humans and 1500 A in rats,2 40 is a sheet of extracellular matrix composed of type IV collagen, proteoglycans (heparan sulfate and chondroitin sulfate), and the glycoproteins laminin and fibronectin.9 7 The absolute relative amounts and distribution of the
(a) Anatomy of the glomerular capillary network. Arrows indicate direction of blood flow. From Elias et al.s9'
(b) Cross-sectional schematic of the glomerular capillary wall. end-endothelial cell,
ep-epithelial cell. 1-epithelium, 2-lamina rara externa, 3-lamina densa, 4-lamina rara interna,
5-endothelium. From Peace.20 3
Anionic glycosaminoglycans in the lamina rara interna and externa have been proposed as the principal determinants of charge selectivity, i.e., the hindered transport of negatively-charged molecules such as proteins and the facilitated transport of cationic molecules.l4' Cationic staining
studies of the basement membrane by Kanwar and Farquhar4 0 resulted in staining of clumps of
anionic sites within both lamina rarae, spaced about 600 A apart, indicating that charge distribution may not be homogeneous in the GBM.
2.2.3 Epithelium
The visceral epithelial cells, or podocytes, are distinguished by their arrangement of interdigitating "foot processes" which rest on the lamina rara externa (Figure 2-lb). The spaces between the foot processes, which are 250-600 A wide, are known as filtration slits and are covered by a thin diaphragm. Like the endothelial cells, the epithelial membranes are coated with anionic glycoprotein. In several nephrotic pathological conditions, the foot processes of the epithelial cells are replaced by a continuous rim of cytoplasm with variable degrees of vacuolization, a phenomenon often referred to as "fusion" of the foot process, although there is no true fusion of the cells.8 This histological pattern can be mimicked in rat kidneys by the infusion of polycations such as protamine sulfate,2 2 3 and thus has been suggested to result from a loss of the endothelial fixed charges.44 ,50 256
2.3
Control and Chemical Mediation of Glomerular Ultrafiltration
The details of glomerular filtration have been extensively reviewed by Maddox et al..169Conceptually, glomerular ultrafiltration is controlled by the adjustment of three parameters: the afferent and efferent arteriolar resistances RA and RE and the ultrafiltration coefficient Kf, where
RA PA - PGC (2.1a) AABF PGC - PE RE E, - (2.1b) EABF SNGFR Kf SpUF. (2.1c) P UF
The afferent and efferent arteriolar pressures in the above equations are designated by PA and
PE, respectively, and the afferent and efferent arteriolar blood flow rates are AABFand EABF. PGC is the length-averaged pressure in the glomerular capillary, while PUF is the length-averaged
Compund RA RE RT K QA AP SNGFR Angiotensin II Norepinephrine ADH Leukotriene LTC4 Leukotriene LTD4 High-dos PAF Endothelin Histamine Prostaglandin E* Prostaglandin E2 Prostaglandin I2 Bradykinin Acetylcholine Glucocorticoids cAMP EDRF ANP Parathyroid hormone 0
T
0 0T
I
4,T
T
I
I-1
1
4,T
T
0T
T
T
T
I
t
I
t
4, 4, 4,T
4, 4, 0T
T
T
T
I
t
T
I
t
1
1
1
4,T
T
T
t
0l
o
1
o
1
I
1
II
of
II
II
1
1
Table 2.1: Chemical modulators of glomerular hemodynamics. Abbreviations: ADH-anti-diuretic hormone, PAF-platelet activating factor, EDRF-endothelium-derived relaxing factor, ANP-atrial natriuretic peptide. *Caused by reduction in PT. #Excluding effect on renin synthesis. Information summarized from Maddox et al..l69
a function of QA, Kf, and the transmural hydraulic pressure lAP (= PGC - PT, where PT is the
pressure in the tubule).3 6
Physiologic control of glomerular function involves many complex interactions, the relative impor-tance of which are not yet fully determined. The major chemical mediators of glomerular filtration are summarized in Table 2.1. Two mechanisms have been relatively well-defined: autoregulation and
tubuloglomerular feedback.
2.3.1 Autoregulation
In the absence of any neural or hormonal control, the kidney can respond to variatons in systemic arterial perfusion pressure in such a way as to keep renal plasma flow and AP, and consequently
GFR, relatively constant. This autoregulation of RBF is seen for mean arterial pressures above
80 mm Hg in rats218 and is an intrinsic response to changes in the tangential wall tension of the arterioles; it is seen in de-ennervated and isolated kidney preparations.9 3,10 0 Physiologically, au-toregulation is demonstrated as the kidney's ability, in the face of decreasing arterial pressure, to
maintain RE constant while lowering RA 218
·1
1
T
T
T
T
T
T
0
0
I
0
I
I
1
1
0
0,
T
T
0
T
2.3.2 Tubuloglomerular Feedback and the Renin-Angiotensin-Aldosterone System
The macula densa cells of the early proximal tubule and the afferent and efferent arterioles of the glomerulus are located close together. It has been observed that high flow rates past the macula densa cells lead to a reduction in SNGFR, apparently signaled by increased chloride uptake.2 5 8 This reduction in SNGFR is a result of reduced QA and Kf with constant AP, suggesting an increase in
RA and RE brought about by a contraction of mesangial cells.83 2
The renin-angiotensin-aldosterone system has been proposed as the effector mechanism of tubu-loglomerular feedback, but this has as yet not been proven conclusively. Renin is a proteolytic enzyme stored in the granules of afferent arterioles in the juxtaglomerular appartus. It is secreted in response to increased intracellular levels of cyclic AMP or decreased intracellecular levels of calcium. The factors that regulate renin secretion include (1) sympathetic control (3-adrenergic,stimulation,
f3-antagonistic or a-adrenergic inhibition), (2) baroreceptor control (stimulation by reduced arterial wall tension, inhibited by increased tension), (3) hormonal regulation (histamine, glucagon, and parathyroid hormone stimulation or angiotensin II and vasopressin inhibition), (4) prostaglandin stimulation, and (5) an as-yet-undetermined signal from macula densa cells when the concentra-tion of chloride ion in the proximal tubule fluid increases. Renin cleaves a circulating ca2-globulin,
angiotensinogen, into the inactive peptide angiotensin I (A-I). Angiotensin I is transformed in
pul-monary microvessels into angiotensin II (A-II) by angiotensin I converting enzyme (ACE).
Angiotensin II is a powerful vasoconstrictor which also serves to release the hormone aldosterone from the adrenal cortex. Aldosterone stimulates sodium reabsorption in the tubules, leading to an increased intravascular volume. These two substances counteract hypotension and/or decreased perfusion of the kidney.
Studies by Myers et al.l8 5 and Ichikawa et al.136 indicate that the principal glomerular effect of
angiotensin II is to specifically increase RE, leading to an increase in AP. A secondary rise in RA is seen in response to the systemic pressor actions of A-II. Angiotensin II has also been shown to lower K ,24 apparently through a loss of parenchymal volume in the glomerular tuft which results from contraction of the mesangial cells.1'2 1 2'
an-2.4
Theoretical Models of Glomerular Function
Theoretical models of glomerular function address the question of to what extent ultrafiltration and permselectivity are modulated by variations in the system hemodynamics-renal plasma flow and glomerular pressure-versus the extent to which they are affected by changes in properties of the glomerular capillary wall-permeability and available surface area for filtration. For example, a reduction in GFR may result from a lowered perfusion, a reduction in the driving force, a decrease in the intrinsic membrane permeability, or a loss of filtration surface area. Similarly, proteinuria could be postulated as a manifestation of an increased bulk filtration or as a loss of the capillary's power to restrict transport. The success of these models has been their ability to explain specific renal pathophysiological processes in terms of such changes.
2.5
Glomerular Ultrafiltration
2.5.1 Determinants of Glomerular Ultrafiltration
The progress in the understanding of the process of glomerular ultrafiltration has come about over the last twenty years primarily from two advances: the development of servo-nulling techniques for pressure measurement and the discovery of a strain of Munich-Wistar rats which have glomeruli located at the surface of the renal cortex, allowing for direct access to the glomerular capillary and Bowman's space. The theoretical approach to ultrafiltration in the glomerulus was developed by Deen et al.81 If each glomerular capillary is idealized as a tube of length L (Figure 2-2), the local transmural flux J, at a point y along the capillary can be expressed as the product of a permeability and a driving force:
J (y) = k [P(Y) - Ar(Y)] (2.2a)
k [P - GC(Y)] (2.2b)
where k is the (empirical) effective hydraulic permeability of the wall, AP(y) = PGC(Y)- PT
is the radially-averaged transmural hydraulic pressure difference (often simply referred to as the filtration pressure), and A7r(y) = rGc(Y) - rT is the radially-averaged transmural oncotic pressure
difference. (The subscripts GC and T represent glomerular capillary and tubule [Bowman's space] values, respectively). The approximation in Eq. 2.2b results from observations that the axial drop in hydraulic pressure over the capillary length is small, on the order of 2 to 3 mm Hg, and the hydraulic pressure in Bowman's space is assumed to be independent of position. Thus the local pressure difference can be replaced by the length-averaged value, Ap.37,127 Inclusion of the axial pressure drop makes for a more physically realistic model but requires exceptional accuracy in the experimental measurement of the afferent and efferent protein concentrations.8s The osmotic
tJv(y)
QA
PT41
U1--L
0
y/L
1
Figure 2-2: Model of glomerular ultrafiltration. Top: Afferent (QA) and efferent (QE) plasma flow is axial in a tube of length L, while solvent flux (J,) is radial. Hydraulic and osmotic pressures in
the capillary (PGC, rGC) vary with position, while those in Bowman's space (PT, rT) are constant.
Filtration is governed by opposing hydraulic and osmotic pressure differences, resulting in the net flux of solvent (J,) into Bowman's space. Bottom: Hydraulic and osmotic pressure profiles along the length of the glomerular capillary. Hdraulic pressure is nearly constant, while osmotic pressure increases significantly. Shaded area represents the net ultrafiltration driving pressure (PUF).
wl - r -w ! I1
I
., UNI
PGC(Y) -
RGC(Y) - 11
QE I I I .1.pressure difference is assumed to result entirely from the difference in protein concentration, since even in states of heavy proteinuria Bowman's space normally contains a negligible amount of protein compared to plasma'9 3 (i.e., rT 0 and A7r(y) 7lrGc(y)). The oncotic pressure is calculated from plasma protein concentration by the relations l
r = 1.629c, + 0.2935ci, (2.3) where cp is in units of g/dl (valid over the range 4 to 10 g/dl) and r is in mm Hg.
Near the inlet, the loss of fluid from ultrafiltration with concomitant retention of protein causes the oncotic pressure within the capillary to rise, resulting in a diminishing of the driving force and less filtration toward the outlet. Physiologically, the opposing hydraulic and oncotic pressure come close to balancing at the efferent end (Figure 2-2).
The effective membrane hydraulic permeability k differs from the true hydraulic permeability of the glomerular capillary wall ko because the effects of radial protein concentration gradients are not included. Concentration polarization within the capillary lumen results in a higher protein concentration at the wall surface than at the midline axis. The actual Air, and therefore k0o, is
underestimated by approximately 10% when using bulk protein concentrations.8 2
If the total volumetric flow rate of plasma is Q(y) and the total surface area of the capillary is S, then assuming no protein transport across the membrane (a valid approximation for the os-motic pressure difference even with massive proteinurial9 3) we have the following expressions for conservation of mass:
dQ
dQ ^ = -SAT (A)'(2.4a) d(Qcp)
d(Q ) = 0. (2.4b)
where Cp(y) is the plasma protein concentration and = y/L is a normalized length scale.
Eqs. 2.2b, 2.3, and 2.4, plus the afferent plasma flow rate QA = Q(O) and afferent protein concentration Cp,A = Cp(O) are needed to solve for the complete flux, and osmotic pressure profiles.
Of particular interest are the flux and permeability integrated over the capillary length, which can be obtained by substituting Eq. 2.2b in Eq. 2.4:
SNGFR = K PUF (2.5)
where
PUF [P- rGc(y)] d (2.6b)
Kf - S.k (2.6c)
Eq. 2.5 is the whole-glomerular analog to Eq. 2.2b. Here it can be seen that Kf is the product of the capillary hydraulic permeability and the surface area, while PUF is the difference of the mean hydraulic and mean osmotic pressures, given by the shaded graphical area of Figure 2-2. A closed-form expression for Kf as a function of QA, SNGFR, AP, and cp,A is given by Deen et al.8'
Implicit in the derivation of Eq. 2.5 is the assumption that the glomerular capillary network can be represented as a number of identical capillaries in parallel. Anatomical studies of the rat glomerulus in fact suggest that there is significant heterogeneity in both capillary length and radius within a single glomerulus.5 72 2 51 Remuzzi and Deen2 1' investigated the theoretical implications of independent distributions in capillary length and radius and found that for a fixed K!, increasing heterogeneity in either dimension reduced SNGFR, but a distribution in length had a more noticeable effect. Based on literature data estimating the length distribution for rat glomeruli, Remuzzi and Deen established that a K1 calculated using identical capillaries underestimates the actual K by
about 30%.211
The situation pictured in Figure 2-2 represents one of filtration pressure disequilibrium; that is, the efferent osmotic pressure 7rE is smaller than AP. This is a condition found experimentally in euvolemic animals, where surgical fluid losses are replaced by continuous infusion. Filtration pressure equilibrium (rE = AP) is the physiologic condition commonly found in hydropenic rats, where fluid volume replacement is not performed.13 5 It is not possible to calculate a unique value for K! in this instance, since the exact point along the capillary where equilibrium is reached, and therefore PUF is not known. The best that can be done is to establish a minimum value for K by assuming that the osmotic and hydraulic pressure balance just at - = 1 .
2.5.2 Theoretical Dependence of Ultrafiltration Coefficient on Parameters
As previously stated, QA, AP, and SNGFR are controlled by the interaction of RA, RE, and Kf. According to the model, at filtration pressure equilibrium SNGFR increases directly with QA; the single nephron filtration fraction (SNFF), defined as
SNGFR
SNFF SNGFR (2.7)
ultrafiltration can be summarized:
* As K! increases, SNGFR and SNFF increase until filtration pressure equilibrium is reached, and then they hold constant with further increases. Variations in the ultrafiltration coefficient are not independent of the other hemodynamic parameters, as discussed next. Changes in K! are important in several pathophysiological states (see Section 2.5.3).
* As afferent osmotic pressure 7rA increases, SNGFR and SNFF decrease until they become zero at rA = AP. Experimental studies on rats have shown, however, that decreasing rA leads to a fall in K, and thus a smaller increase in SNGFR than would be predicted.1 7'23s 2s,24 4 Multivariate statistical analysis of this association shows a direct dependence which is not a result of an intermediate relationship with QA or Ap.244 The mechanism of this interaction has not been elucidated, but Brenner et al.3 7 suggest that protein concentration may be a factor in the regulation of K! by vasoactive hormones.
* As AP increases above rA, SNGFR and SNFF also rise. This increase is not a linear relation-ship, because the larger local fluxes (J,(y)) along the capillary lead to higher values for cp(y) and local osmotic pressures, partially offsetting the hydraulic pressure increase. Experimen-tally, as for osmotic pressure changes, there is a significant relationship with the ultrafiltration coefficient, but here an inverse correlation.2 4 4 Thus increasing pressure is associated with an offsetting decrease in Kf.
2.5.3 Pathophysiological Behavior of Ultrafiltration Parameters
A reduction in Kf is believed to be an important clinical mechanism in the pathogenesis of acute renal failure4 3 and several forms of glomerulonephritis,2 31 although it can only be documented in animal models. Animal models of nephrotoxic serum nephritis (NSN, an analogue to human anti-GBM disease) show a change in SNGFR that is proportional to the severity of the injury. In response to mild treatment with anti-GBM antibody, the glomeruli maintained a relatively normal SNGFR despite a lower K! by increasing p.168 For major injuries of the same type, SNGFR dropped by
50%, principally caused by a reduction in Kf (offset by a larger AP), although a contributing factor was a rise in RA and RE leading to a reduced QA 26
Studies of Heymann's nephritis, a model resembling human membranous glomerulopathy, have shown an intrarenal heterogeneity in SNGFR determined by variances in K! and QA.1 3 4Values for AP and r were found to be constant for all glomeruli regardless of the particular SNGFR . Other studies have confirmed that AP is not significantly elevated in Heymann's nephritis.2 62
Puromycin aminonucleoside (PAN) nephrosis is a non-immunological model for human minimal change disease. Rats infused with PAN demonstrate a decrease in SNGFR which is related to a lowered Kf.137 As with Heymann's nephritis, AP remains normal.2 9
Hemodynamic alterations in adriamycin nephrosis are similar to those observed in severe NSN injury. QA decreases as a result of an elevated RA and RE, and a AP increase is accompanied by a reduced Kf. The net effect is a smaller SNGFR while SNFF is relatively constant.192,25 2
Studies of renal ablation (surgical infarction of functional renal tissue) in rats indicate that Kf is not altered in response to a purely hemodynamic increase in QA and p.80, 128 When filtration pres-sure is normalized, however, either by ACE inhibitors or dietary protein reduction, the ultrafiltration coefficient increases to maintain SNGFR relatively constant.6 7,175
Hyperfiltration in streptozotocin (STZ)-treated diabetic rats appears to be a function of increased perfusion and filtration pressure resulting from a specific decrease in RA, as Kf does not differ significantly from normal controls.L2 9,2 66 In more severe STZ-induced diabetic conditions, RA and
RE are high, QA and SNGFR are markedly reduced, but AP is normal. Conversely, the situation
in alloxan-induced diabetes seems to be one of hypofiltration or increased RA, where SNGFR and AP are slightly reduced from controls, while Kf is unchanged.l77Insulin therapy of alloxan-infused rats reduces RA while having no effect on Kf.
2.6
Glomerular Permselectivity
2.6.1 General Aspects
Normally, the glomerular capillary wall serves as a very effective discriminator on the basis of both molecular size and charge. Small uncharged molecules are filtered without measurable restriction, but the resistance to transport increases with larger or more anionic molecules. The concentration of inulin in the glomerular ultrafiltrate equals that in the afferent arteriole, as opposed to albumin, where the ultrafiltrate concentration is less than 0.1% of the afferent arteriole.195
Many disease states are characterized by a deficit of these permselective abilities, most seriously manifested as protein loss in the urine. Development of theoretical models of glomerular permselec-tivity has led to greater understanding of the importance of molecular size, charge, and configuration to the normal ultrafiltration process, and to an understanding of the pathophysiological changes in system hemodynamics and membrane properties in the disease state.
2.6.2 Clearance
here Ci has units of volume/time, U is the urinary flow rate in volume/time, ci,u is the concentration of solute in urine, and Ci,A is the concentration of solute in the afferent arteriole. The clearance is the hypothetical rate at which blood is completely "cleared" of solute i by the kidney. If the solute is one such as the fructose polymer inulin-which is uncharged, freely filtered through the glomerular capillary wall, and does not undergo reabsorption or any further secretion downstream-then its clearance is equal to GFR. The fractional clearance FRC is a dimensionless quantity
FRC GFR' (2.9)
A fractional clearance less than unity indicates that the solute undergoes some combination of restricted filtration or tubular reabsorption. A fractional clearance greater than one indicates that the solute is secreted in the tubules.
The sieving coefficient of a solute Oi is defined with respect to its concentration in the afferent arteriole Ci,A and its average concentration in Bowman's space (Ci,B):
ejOi- (Ci,B) (2.10)
Ci,A
For a solute which is neither secreted nor reabsorbed in the tubules, it can be shown that
FRCi = ei, (2.11)
and thus this parameter of theoretical interest can be obtained directly from blood and urine concen-trations. If a polydisperse polymeric substance such as dextran (a polymer of D-glucopyranose) is infused as a marker, then the plasma and urine samples can be fractionated by size, and subsequent determination of the sieving coefficients as a function of molecular size leads to the construction of sieving curves. As discussed below, these sieving curves are affected by both hemodynamic changes and alterations in the membrane properties and potentially can be used as tools for the clinical estimation of parameters not directly measurable.
2.6.3 Early Models
In the 1950s, Pappenheimer, Renkin, and Borrero20 0,201,21 4 performed the pioneering theoretical and experimental work which lay the foundation for much of the progress in modeling restricted transport in pores. The results from these early studies are somewhat limited in their application to glomerular filtration in that the blood vessel and extravascular space were each taken to be well-mixed reservoirs. The dependence of transport on afferent plasma flow rate and on the gradients of concentration, flux, and osmotic pressure in the capillary were not considered until the cross-flow filtration models of the 1970's.6s 2,8 This more complete modeling was coupled with increased
sophistication in the theoretical analysis of the restricted transport of solid spheres in cylindrical
pores. 5,4 2,4 7
The pore model originally derived by Chang et al.62 is summarized below. Additional models based on alternative membrane geometries or without the assumption of any particular membrane structure (nonequilibrium thermodynamics) have been proposed,6 2,20 0 but none have had extensive application.
2.6.4 Isoporous Solid-Sphere Model of Permselectivity
In the simplest model, the capillary walls are assumed to be perforated by right cylindrical pores with pore radius rp = r0 (Figure 2-3). Capillary flow occurs along direction y while filtration
is conducted in direction z. The porosity of the membrane (equal to the fractional pore area of the membrane surface) is given by f and the total membrane surface area is S. The plasma and glomerular filtrate are modeled as aqueous continua into which salts, proteins, and various tracer molecules are dissolved. The tracer molecule concentration CT is small so that it does not contribute
to osmotic pressure or to electrostatic interactions within the membrane. Traditionally, all solute molecules are assumed to behave as spheres with a radius equivalent to that of the Stokes-Einstein radius
r, 6Dk'T (2.12)
6rp'D
where kB is Boltzmann's constant and T is the absolute temperature at which the solvent viscosity p and diffusion coefficient Di are measured.
The solute flux Ji (y) of a neutral macromolecule through the pores is governed by both diffusional and convective forces and is given by62
Ji(y) = (Y)C(1 -(Y)W (2.13)
Pey
Wi(SJ,) (2.14)Pe(y)- fHiTi - (f$/t)H, )' (2.14)
where ci(y) is the solute concentration in the capillary, t is the thickness of the membrane (the length of the pore), Di is the diffusion coefficient of the solute in bulk solution, f is the fractional porosity of the wall, and Hi and Wi are solute pore hindrance factors for diffusion and convection, respectively.
C
a)
E
I=
0
L_ CUE
loOD
OCo
E
c ) ... ,,l I-.,... N"OFJ
S
-Js
w
C)
-(
'n
C)
CD
Figure 2-3: Pore model of glomerular permselectivity. Renal plasma flow (Q) is parallel to the inner surface of the glomerular capillary wall. Cross-flow filtration from the capillary is assumed to be conducted through pores of radius rp and length in the wall. Filtration is governed by opposing hydraulic (P) and osmotic (Air) pressure differences, resulting in the net flux of both solvent (J,) and solute (J,) into Bowman's space. Possible solute configurations include those of a solid sphere
(bottom pore, left) or a flexible coil (bottom pore, right).
-