HAL Id: hal-01000323
https://hal.archives-ouvertes.fr/hal-01000323
Submitted on 28 May 2020HAL is a multi-disciplinary open access archive for the deposit and dissemination of sci-entific research documents, whether they are pub-lished or not. The documents may come from teaching and research institutions in France or abroad, or from public or private research centers.
L’archive ouverte pluridisciplinaire HAL, est destinée au dépôt et à la diffusion de documents scientifiques de niveau recherche, publiés ou non, émanant des établissements d’enseignement et de recherche français ou étrangers, des laboratoires publics ou privés.
Validating a whole farm modelling with stakeholders:
evidence from a west african case
Nadine Andrieu, Patrick Dugué, Pierre-Yves Le Gal, Marine Rueff, Noémie
Schaller, Aristide Sempore
To cite this version:
Nadine Andrieu, Patrick Dugué, Pierre-Yves Le Gal, Marine Rueff, Noémie Schaller, et al.. Validating a whole farm modelling with stakeholders: evidence from a west african case. Journal of Agricultural Science, Cambridge University Press (CUP), 2012, 4 (9), pp.159-173. �10.5539/jas.v4n9p159�. �hal-01000323�
Journal of Agricultural Science; Vol. 4, No. 9; 2012 ISSN 1916-9752 E-ISSN 1916-9760 Published by Canadian Center of Science and Education
Validating a Whole Farm Modelling with Stakeholders: Evidence from
a West African Case
Nadine Andrieu1,2, Patrick Dugué1, Pierre-Yves Le Gal1, Marine Rueff1, Noémie Schaller3 & Aristide Sempore2 1 CIRAD, UMR Innovation, Montpellier, France
2 Cirdes, Bobo-Dioulasso, Burkina Faso, France
3 AgroParisTech INRA, UMR 1048 SAD-APT, Thiverval-Grignon, France
Correspondence: Nadine Andrieu, CIRAD, UMR Innovation, 34398 Montpellier Cedex 5, France. Tel: 226-20-97-2053. E-mail: [email protected]
Received: May 9, 2012 Accepted: June 4, 2012 Online Published: August 8, 2012 doi:10.5539/jas.v4n9p159 URL: http://dx.doi.org/10.5539/jas.v4n9p159
Abstract
Strategic and tactical decision support tools can assist farmers to make farm management decisions. The challenge facing researchers is to construct decision support tools that lead to the successful adoption of the strategies selected. This article describes and assesses the use of a whole-farm model in West African savannah regions. Farmers and advisors were involved in the choice and design of models, the definition and analysis of scenarios, the design of alternative strategies, and the validation of models. The validation process included a short and mid-term analysis of the use and usefulness of the model for farmers. During the validation process, farmers demonstrated that they were able to define and characterize iterative scenarios permitting the performance of their farm to be improved. They also had a good understanding of the outputs of the model, even several months after they had used the model. They declared having changed some technical or management practices and having acquiried calculation and management skills. This type of process offers an alternative to conventional advisory methods based on advisor expertise.
Keywords: stakeholder-based process, support tool, advisor, farm management, Burkina Faso 1. Introduction
While farming systems in sub-Saharan Africa have limited access to productive resources (Debaeke & Aboudrare, 2004; Giller et al., 2011; Okello, Kirui, Njiraini, & Gitonga, 2012), they are facing increasing demands from urban populations, fluctuating climate conditions (Cooper et al., 2008; Twomlow et al., 2008) and a changing economic environment (Adesina & Ouattara, 2000). In West African savannahs, rural population growth is contributing to an expansion of areas under cultivation and larger livestock herds, resulting in increasing conflicts between crop farmers and livestock farmers over agro-pastoral resources. This demographic pressure also is the principal reason behind shortened fallow periods, with consequent reductions in soil fertility and in the productivity of farming systems (Dugué & Dongmo Ngoutsop, 2004; Saka, Okoruwa, Oni, & Oyekale, 2011). For several decades, development research has proposed technical options based on a better integration of agriculture and livestock production to help farmers increase their agriculture production levels while protecting their agro-pastoral resources (Sumberg, 1998). Mixed crop-livestock farming systems are assumed to efficiently utilize the biomass produced and improve the resilience of farming systems (Herrero et al., 2010).
However, numerous authors point out that these technical options have not been adopted widely by farmers (Fox, Rockström, & Barron, 2005; Nziguheba et al., 2010, van Rijn, Bulte, & Adekunle, 2012) due to the low level of involvement of target groups in the design of research programs (Callon, Lascousme, & Barthes 2001, Faure, Gasselin, Triomphe, Hocdé, & Temple, 2010). This also is the case of simulation based decision support tools developed to analyze how to implement these options and their consequences on the operations and performance of their farms (Keating & McCown, 2001; Meinke et al., 2001). The reasons identified are the low level of involvement of target groups in their design (Thornton & Herrero, 2001), the duration of model development (Sterk et al., 2006), and the cost and length of time needed to collect basic data which often are extensive given the numerous interactions between activities within a farming system (Whitbread, Robertson, Carberry, & Dimes, 2010).
www.ccsenet.org/jas Journal of Agricultural Science Vol. 4, No. 9; 2012
160
The design of computer models that can support farmers who are considering how to develop their farming systems is a challenge for research (Le Gal, Dugué, Faure, & Novak, 2011). Participatory modelling allows the objectives and priorities of the stakeholders involved to be taken into account. Its principles have been described by Voinov and Bousquet (2010) and can be applied to build a whole-farm model meant to support farmers’ management strategies. But the impact of this kind of approach on farming system design remains to be assessed in empirical conditions.
The assumption tested in this study is that whole-farm models built in a participatory process are valid tools to help farmers design alternative farming systems.
This article describes and assesses the use of a whole-farm model co-designed with stakeholders. The article is based on a whole-farm model named Cikεda (“farm” in the Dioula language) that was developed in western Burkina Faso under a research framework involving researchers, farm advisors and farmers. Cikεda is meant to be used by advisors to help farmers analyze the impact of different scenarios of tactical and strategic change involving their cropping patterns, fertilization practices, herd management, and livestock feeding. In this kind of modelling approach, validation, intended to determine whether the model was successful in addressing its intended purpose, relies mainly on the participatory evaluation of the use and usefulness of the model (Becu, Neef, Schreinemachers, & Sangkapitux, 2008; Pavé, 2005; Voinov & Bousquet, 2010). Here, the criteria of use and usefulness were the ability of farmers to design consistent alternative scenarios, the understanding of the model by farmers, and the impact of the model on knowledge and practices. After presenting the general methodological framework and the stages of the modelling process, we describe the scenarios built by farmers and their assessment of the approach at the beginning and midway through the validation process. The validity of the model and the respective role of farmers, researchers and advisors in the process are then discussed.
2. Material and Methods
2.1 The Overall Methodological Framework
This study was carried out between 2007 and 2011 in the villages of Koumbia (3°41'15” West; 11°14'47” North) and Kourouma (4°47’29” West; 11°36’44” North), both situated in the cotton basket of Burkina Faso and facing the same constraints as other savannah areas of West Africa. In the region, between 900 and 1000 mm of rain falls over a five-month period (June to October). Farmers of the region may be grouped into three types according to the structural characteristics of their farms and their production objectives (Vall, Dugue, & Blanchard, 2006). Crop farmers (70% of farms) grow cotton for sale and cereal crops for home consumption and sale. Of these, 70% own draught animals and a few small ruminants. Livestock farmers (10% of farms) grow cereal crops for home consumption on small surface areas; their sole source of revenue is their ruminant herds. Crop-livestock farmers (20% of farms) constitute a category that emerged following the sedentarisation of some livestock farmers and the development of cattle farming by crop farmers to diversify their revenue sources. The large majority of farmers do not note down any data on their farming activities due to their limited schooling.
In action research projects, ‘boundary’ objects (Cash et al., 2003; Trompette & Vinck, 2009) can facilitate the partnership between researchers and stakeholders. They may be multiple: abstract and concrete, general and specific, conventional and user-adapted, material and conceptual (Trompette & Vinck, 2009). In this specific research project, one of the boundary objects, which was proposed by stakeholders and provided financial support by researchers, was an organisational object called the “Committee of Village Deliberation: CVD” (Vall, Chia, Andrieu, & Bayala, 2008). In each village, a CVD was set up with two representatives from each farmers’ organisation and advisors from advisory structures (National Union of Cotton Farmers, Agriculture and Livestock Ministries). Representatives of these CVDs (four representatives from each village) and researchers constituted the research steering committee. The role of the CVD was to alert researchers about agropastoral problems, discuss and validate the choices made during steering committee meetings, select experimenters, and follow, discuss and evaluate the experiments carried out in the villages. The scientific team was made up of three agronomists, including two with modelling skills, one zootechnician, two computer specialists, and three agronomy students. In this research project, modelling also was seen by scientists as an intermediary tool that could be used on the condition that the farmer was involved in the definition of issues to be addressed and the model’s construction. The advisors (six advisors) and around thirty farmers, chosen by the CVDs according to their willingness to be monitored by the research team, were involved in the modelling process.
In accordance with the chosen participatory approach, stakeholders were involved in the choice and design of the model, the definition and analysis of scenarios, and the design of alternative strategies which Voinov and Bousquet (2010) described as the basic steps of participatory modelling (Figure 1).
www.ccsen 2.2 The De 2.2.1 Ident During me addressed their land a of animals tactical (ye 2.2.2 The C For the mo computer rapidly in model. Based on t calculating imbalance ensure a be the suppor Farmers’ d (Andrieu & proposed b themselves understand of previou The bioph CVD farm example, t on the bas focus grou the user, s Constants For examp herd grow 2005). 2.2.3 Colle In order to sample of et.org/jas esign Process tifying Project eetings of the r by the model w allocation with s, in a context w early planning Choice of the M odelling softw programming order to respo the outputs of t g balances bet s related to a etter understan rt process. decision rules a & Nogueira, 20 by farmers by s. Furthermore ding of the imp us scenario outp ysical process mers’ own know
the crop yields sis of farmers’ up discussions such as the are that are difficu ple, the averag wth rate determ
ecting Data on o determine th farms were car
Figure 1
of the Model w
t Goals research steeri were identified hin a farm), fer
where rainfall ) and strategic Modelling Too ware, Excel® so skills (Voino ond to local qu the steering co tween supply simulated scen nding of the m
are not modell 010). This app y capturing in e, the farmer c pacts of his str puts. es permitting t wledge regard permitting the opinions per with the CVD ea per crop or
ult for farmers ge production o mined from reg
n the Functioni he processes th
rried out. For t
Journal of A 1. Stages of th with Stakehold ing committee d. These questi rtilization (bala levels are high c (investment d ol: Modelling oftware was us ov & Bousque uestions and is ommittee, the g and demand nario, and then model’s structur
led unlike in op roach ensures
the software can retain contr rategic or tactic
the calculation ding the averag e calculation of
crop and type s. The model t the herd size, to quantify ar of calves per s gional literatu ing of Crop-liv hat should be the design of th Agricultural Sci e modelling pr ders
, the main agr ions included s ance between m hly uncertain. T decisions, size Software and M sed by modell et, 2010). Con s easy to use b general modell of cereals, for n evaluate the re and operatio ptimization (C a broader and the outputs of rol over the ch cal decisions a n of these bala ge productivity f cereals supply of climatic ye then connects t to calculate t re estimated fro
season was est re (Larrat, Le vestock Farms modelled, in-he sample, we ience rocess of Cikεd ricultural devel selecting cropp mineral and org The questions of an activity Modelling Prin lers because it nsequently a f by the advisors ing principle a rage, and min e related econo on for both its u
Casagrande et a more flexible f farmers’ dec hange in the ou and test new sc
ances are repre y of their crop y and demand ear (favourabl these constants the supply and om regional lit timated on the vif, Pagot, &
and Defining -depth surveys
used the struc da lopment questi ping patterns (c ganic fertilizer were related to unit). nciples ts use does no first prototype
s who are inte
adopted by mo neral nutrients omic results. T users and the f
al., 2010) or ru exploration of cision rules ra utputs so that h cenarios accord esented by con pping and live for mineral nu e, average, un s with input va d demand bala terature and sim e basis of cons
Vandenbussch
the Model Stru s of the functi ctural typology
Vol. 4, No. 9;
ions that shou choice of crop r) and feeding h o decisions tha ot require adva can be devel ended to handl dellers consist to detect pos This choice aim
farmers targete
le-based mode f possible strate ather than the
he can improv ding to his ana
stants based o estock systems utrients are asse nfavourable) du ariables capture nce for a reso mplified equat stants related t he, 1988; San ucture ioning of a lim y of the farms o 2012 uld be s and herds at are anced loped le the ted in ssible ms to ed by elling egies rules ve his alysis n the s. For essed uring ed by ource. tions. o the ngare, mited of the
www.ccsenet.org/jas Journal of Agricultural Science Vol. 4, No. 9; 2012
162
study site proposed by Vall et al. (2006); two farms of each type were selected by the CVD. Interviews were conducted before the start of the 2008-2009 crop year to bring to light the planning of activities; these were followed by a monthly monitoring of activities implemented during the year. The analysis of planning made it possible to identify each farmer’s production strategy (Aubry, Papy, & Capillon, 1998) while the monitoring allowed this analysis to be refined by discussing with the farmers the gaps between what was planned and what actually was carried out.
From this description of the functioning of crop-livestock systems, the structure of the model was proposed by modellers and validated by the steering committee (Figure 2). The model represents a mixed crop-livestock farm in the form of seven interacting modules. The module, "Farm Resources", includes the land, labour, and equipment resources available on the farm. Two other modules represent the farm’s livestock system and the cropping system. Five herds of animals (breeding cattle, draught ox, dairy cow, fattened steer, and small ruminants) and five crops (cotton, maize, sorghum, cowpea grain, cowpea forage) are modelled to cover the main livestock and cropping systems observed on the farms in the study area. Three other modules represent the functional links between the cropping and livestock modules: organic nutrient production, crop fertilization, and herd feeding. A seventh module calculates the economic variables (expenses and products) derived from the biophysical fluxes described in the other modules.
The model functions on a yearly time step, with the year divided into three periods: the rainy season (1 May-31 October), the cold dry season (1 November-28 February), and the hot dry season (1 March-30 April). This breakdown makes sense to farmers because each season is characterized by specific rainfall and temperature conditions that affect the availability of water and animal feed resources and the type of productive activities carried out. The rainy season corresponds to agricultural crop work; the animals’ needs are covered by natural rangelands. During the cold dry season, crop fields are harvested and the space is left open to herds for common grazing. During the hot dry season, the pastures are practically exhausted and farmers distribute forage stocks constituted during the preceding season that are the basis of the cattle feed.
Figure 2. Cikεda structure
Each box corresponds to one module corresponding to a subsystem of the modelled system. Module names are in bold, the main input variables are normal print, the main output variables are in bold and italics, the resource
www.ccsenet.org/jas Journal of Agricultural Science Vol. 4, No. 9; 2012
balance linked to the module is underlined (calculated by comparing resource supply and demand from other modules)
2.2.4 Parameterization of the Model by Farmers and Scientists
A first prototype of the model was available within 4 months and was presented to each CVD during focus group meetings. During this presentation, the inputs, outputs and parameters (Appendix 1) of the model were reviewed. This exercise made it possible to set values to the constants, select units to facilitate the entry of inputs and understanding of outputs, store some values difficult to quantify by farmers as constants, and add outputs that were pertinent for farmers. For example, yield values were assessed per crop, per type of climatic year, and per village, the prices of production inputs difficult to remember were transformed into constants, farmers suggested that some input and output variables such as the production of cereals be expressed in ‘bags’, which is a commonly used local unit, instead of ‘kg’. Farmers also suggested adding outputs such as the arable area as a function of the level of equipement of the farm.
2.2.5 Design of a User-friendly Interface
An evaluation of advisors’ perceptions and expectations in terms of features showed that the Excel model was not user-friendly. Complaints were related to the aesthetic quality, an unfunctional recording mode of different simulations, and no error handling. To render data input more user-friendly for advisors, they were shown several interfaces and were asked to select the one which seemed easiest to use. The selected interface was developed using Visual Basic Express 2008®. This second prototype of the model, developed within 3 months,
was called Cikεda. 2.2.6 Training of Advisors
The agricultural advisors were trained in how to use the model. The training consisted of a presentation of the model’s limitations, simplifications, and principal calculations, accompanied by practical exercises on simulation, scenario development, and performance analysis of a virtual farm. At the end of the session, the three advisors who had developed the greatest mastery of the model were selected by the group to test the model in an advisory service approach, with the possibility that they would be supplemented by the other three. The first advisor, from the Livestock Ministry, had been trained in animal production science. The two others belonged to the National Union of Cotton Farmers and had backgrounds in accounting/management.
2.2.7 Applying the Model
Between October 2009 and February 2010, these advisors then applied the model with 10 crop farmers, 6 livestock farmers, and 8 mixed crop-livestock farmers selected by the CVDs. Each farmer was supposed to define and characterize different strategic and tactical change scenarios for his farming system, and then compare and discuss the outputs with his advisor. The advisors and farmers were asked to define 4 types of scenarios: a baseline scenario S0, corresponding to activities implemented during the preceding crop year that could be compared to current outputs obtained on the farm; a scenario S1, corresponding to the farmer’s plans for the coming crop year and reflecting his production strategy; an improved scenario S2, characterized by the farmer to correct imbalances identified under scenario S1; and a scenario S3 consisting of a strategic change that could be implemented over the long term, and characterized by the advisor with the support of a researcher. During the interaction between the farmer and the advisor, the researcher was mainly an observer.
2.2.8 Validation Process
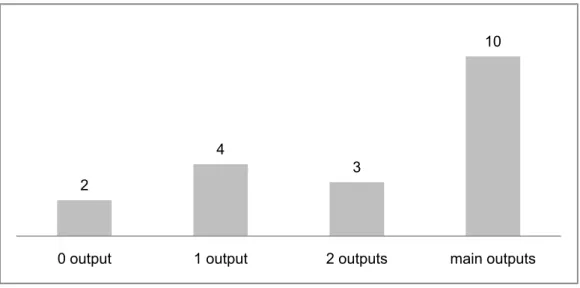
Validation was intended to determine whether the model was successful in addressing its intended purpose. In this study, the intended purpose was to assist farmers to make farm management decisions. Two attributes were analyzed for this validation: the use of the model and the usefulness of the model to improve management decisions and practices. Validation of the use of the model was based on two criteria: the famers’ ability to design consistent alternative scenarios, and the farmers’ understanding of the model, with the assumption that an understanding of how calculations are made in the model would favour its use. The ability of farmers to design consistent alternative scenarios was considered good when farmers were able to design at least one alternative scenario based on the analysis of the outputs of the previous one. This validation was based on surveys made by the researcher during the application of the model. The researcher also observed the attitudes of the farmer. Once each scenario was analysed, farmers were interviewed regarding the difficulties encountered in the development of the scenarios and the analysis of outputs, and their interest in and opinion of the exercise. The understanding of the model was assessed by the number of outputs farmers were able to remember 6 months to one year after they had used the model. Understanding was considered to be good when half of the farmers were
www.ccsenet.org/jas Journal of Agricultural Science Vol. 4, No. 9; 2012
164
able to describe at least two of the main four balances calculated by the model. This evaluation was made in October 2010 with 19 of the farmers that had used the model.
Validation of the usefulness of the model also was assessed 6 months to one year after they had used the model (Becu et al., 2008). It was based on two criteria: the farmers’ declarations of having acquired additional knowledge by using the model, and the changes they had carried out during the cropping season that followed their use of the model. The impact of the tool on knowledge was considered good when half of the farmers were able to describe their new knowledge in some detail and in relation to what they had been doing before. The impact of the tool on practices was considered good when half of the farmers had made some changes that they were able to describe (not only responding “yes” or “no”).
3. Results
3.1 Applying the Model: An Iterative Design of Scenarios by Farmers and Advisors
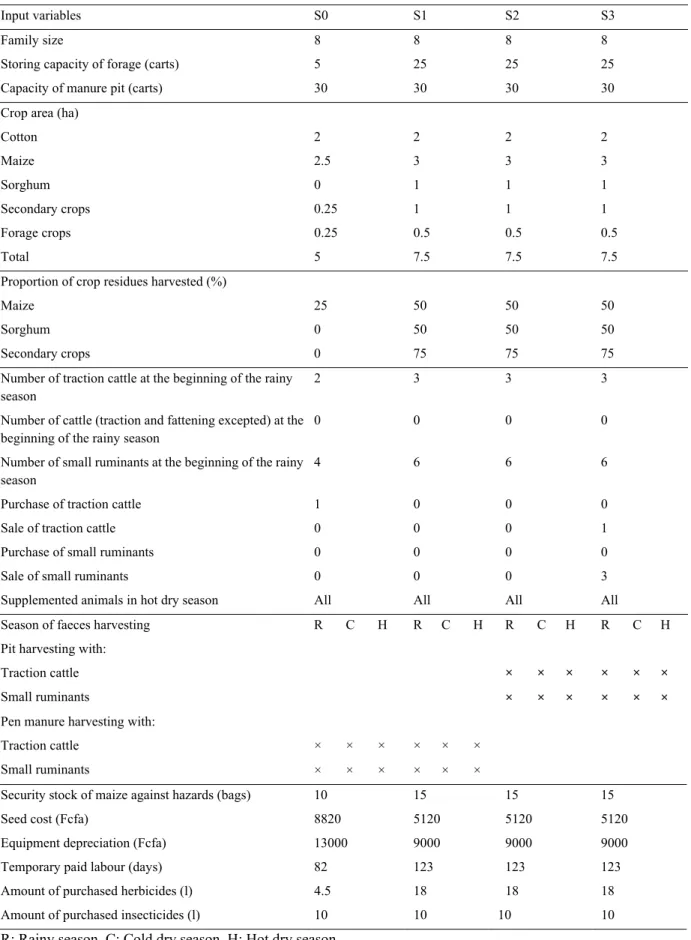
Table 1 presents the characteristics of the 4 scenarios simulated on one of the crop farms, and Figure 3 presents the main results obtained. The simulation of scenario S0 shows that there is a surplus in the cereal balance no matter the type of climate year. The nitrogen balance on maize has a slight deficit. The forage balance also has a deficit and the model recommends the purchase of 1.8 sacks of cotton cakes for an average climatic year. Crops are the sole source of revenue because the animals present on the farm are not sold. The economic balance therefore is linked strongly to crop yields, and consequently to the weather. These results matched the farmer’s experience, the results of the previous year being considered by the farmer as having been good.
To promote the sale of surplus cereals, and limit the purchases of feed for cattle revealed in S0, the farmer tested a scenario 1 in which he expands his cultivated surface area from 5 to 7.5 ha by getting back land that he had loaned to another farmer. He aims to increase the surface area under maize, forage, and secondary crops, and to introduce an area sown with sorghum. He also plans an increased reliance on paid labour (from 80 to 120 days) to respond to the increased work load during weeding and harvesting. Finally, the farmer plans to increase fivefold his storage capacity of crop residues and to increase their collection rate. S1 permits an improvement in the forage balance, rendering the purchase of cotton cakes unnecessary. The economic balance of the farm thereby is improved due to a reduction in costs linked to livestock (eliminating expenses due to the purchase of cotton cakes and no plan to purchase draught cattle by the farmer) and to the increase in crop products linked to the cultivation of a larger surface area with crops that do not require extensive inputs.
Relatively satisfied with the economic balance obtained through S1, the farmer formulated a S2 scenario that was distinguished from S1 by the type of manure produced and used. Under S2, all animal faeces present on the farm are recuperated year-round in a pit. The farmer estimated that collecting and storing manure would not require additional temporary paid labour in comparison with his current mode of manure production. Figure 3 demonstrates the positive effect of the application of pit manure on the nitrogen balance of maize compared to the current simple use of manure collected from the pens.
The advisor then presented scenario S3 to the farmer, it allowed an analysis of a diversification of income sources through a more efficient utilization of the herds by selling some surplus sheep, made possible by their prolificity. In the same manner, the sale of one of his three draught oxen could be envisioned. S3 led to a slight reduction in the nitrogen balance on maize due to a reduced quantity of faeces but to an improvement in the economic balance. Having already secured a minimum income in the case of unfavourable weather, the farmer was able to assess the advantages of a more efficient utilization of his livestock.
www.ccsenet.org/jas Journal of Agricultural Science Vol. 4, No. 9; 2012
Table 1. Input data for 4 scenarios simulated with a crop farm: S0: the baseline scenario, S1: the farmer plans extension of the cropped area, S2: the farmer plans improvement of the quality of organic fertilizer, and S3: the advisor’s proposal to achieve a more efficient utilization of livestock
Input variables S0 S1 S2 S3
Family size 8 8 8 8
Storing capacity of forage (carts) 5 25 25 25
Capacity of manure pit (carts) 30 30 30 30
Crop area (ha)
Cotton 2 2 2 2 Maize 2.5 3 3 3 Sorghum 0 1 1 1 Secondary crops 0.25 1 1 1 Forage crops 0.25 0.5 0.5 0.5 Total 5 7.5 7.5 7.5
Proportion of crop residues harvested (%)
Maize 25 50 50 50
Sorghum 0 50 50 50
Secondary crops 0 75 75 75
Number of traction cattle at the beginning of the rainy season
2 3 3 3 Number of cattle (traction and fattening excepted) at the
beginning of the rainy season
0 0 0 0 Number of small ruminants at the beginning of the rainy
season
4 6 6 6
Purchase of traction cattle 1 0 0 0
Sale of traction cattle 0 0 0 1
Purchase of small ruminants 0 0 0 0
Sale of small ruminants 0 0 0 3
Supplemented animals in hot dry season All All All All
Season of faeces harvesting R C H R C H R C H R C H
Pit harvesting with:
Traction cattle Small ruminants
× × × × × × × × × × × ×
Pen manure harvesting with:
Traction cattle Small ruminants
× × × × × × × × × × × ×
Security stock of maize against hazards (bags) 10 15 15 15
Seed cost (Fcfa) 8820 5120 5120 5120
Equipment depreciation (Fcfa) 13000 9000 9000 9000
Temporary paid labour (days) 82 123 123 123
Amount of purchased herbicides (l) 4.5 18 18 18
Amount of purchased insecticides (l) 10 10 10 10
www.ccsen S0: initial 3.2 Valida 3.2.1 Scen Table 2. E Crop-livesto farm Livestock fa Crop farm S0: Initial S1: Innova S2: Innova et.org/jas configuration
ation of the Use
narios Built and Examples of inv ock How work p How t How satisfy farm How t How with a How t How t How t more How a econo sale pr How t econo How cotton scenario ative scenario / ative scenario / Figure 3. Res / S1: Extendin e of the Model d Farmers’ und vestigated issu Issues raised to reduce wor productivity? to improve anim to reduce wor ying economic b to improve the f to reduce depe a low autonomy to improve the f to improve anim to reduce cotton efficiently the li an increase of c omic balance ass
rice? to jointly impro omic balance? to maintain i n cultivation? / First round / Second round Journal of A
sults of the fou ng cropped are
l
derstanding of ues and simulat
from S0 and S1 rkload while im mal diet quality?
rkload while k balance? forage balance? ndency on cott of crop residues forage balance?
mal diet quality? n dependency by
ivestock? cotton area woul
suming an incre ove the crop nut income while d Agricultural Sci 166 ur scenarios sim ea / S2: Using p f the Model ted solutions w 1 mproving Red sea Sto keeping a Red Ext Incr ton cakes s? Mix Red incr cap Sto y utilizing Sel cap area ld impact ease of its Sim high trient and Dev Sel stopping Fatt ience mulated in a cr pit manure / S3 with 24 farms Contemplated ducing the numb
son
ring crop residu ducing cotton ar tending cattle fa reasing collectio xing urea with s ducing the num reasing collectio pacities
ring crop residu ling small rum pacity, increasin
as against cotton mulating an incr
her sale price of veloping manure ling sheep tening animals rop farm 3: Selling anim solutions by the ber of fattening ues with higher f
rea attening on of crop residu straw mber of fatten on of crop resi ues with higher f inants, extendin ng cereals and n ease of cotton a f cotton e pit Vol. 4, No. 9; mals e farmer in S2 g cattle in hot d forage quality ues
ning cattle whi idues and storag forage quality ng forage storin
secondary crop area linked with
2012 dry ile ge ng ps h a
www.ccsenet.org/jas Journal of Agricultural Science Vol. 4, No. 9; 2012
Figure 4. Numbers of model outputs farmers remember six months to one year after model use
All farmers were able to design at least one alternative scenario (S1). They also were able to describe a scenario S2 intended to correct the imbalances detected by S0 and S1. The nature of the scenarios tested was linked to the socio-economic context of the farms, specifically the reassessment of the cotton crop area due to a drop in the sale price and an increase in the price of inputs over several successive crop years. However, the issues studied and the scenarios developed by the farmers in response to this context were diverse depending on their farm type (Table 2). Reducing workload was of particular interest to crop-livestock farmers. Farmers figured it out based on their estimations of the manpower necessary to carry out the strategic and tactical choices entered in the model and tested scenarios that required lower workload, reducing, for example, the size of a fattening unit or the total cultivated surface area. Reducing cotton dependency was of particular interest to crop farmers who rarely consider the possibility to develop a small ruminant fattening unit whereas livestock farmers were more interested in forage management issues.
Figure 4 shows that 13 of the farmers were able to remember at least 2 of the 4 main balances of the model, which reflects a good understanding of the simulation results. The farmers who best described the model were those with a higher level of French language skills, which is likely a reflection of a higher education level.
3.2.2 Behavior of Farmers during the Use of the Model
All farmers found that the model’s capacity to highlight the synergy between cropping and livestock systems, and to simulate the farming system’s overall profitability, was helpful in raising their awareness of the possibility of diversifying their activities and served as a useful discussion support tool. However, the analysis of farmer-advisor interactions shows that those most interested in the model were young farmers who did not yet have a definite plan for their farms’ development, and farmers in the midst of considering how to transform their farms to improve performance. For the most experienced and often oldest farmers (4 of the farmers surveyed) whose farming systems were the most well established, the simulation outputs did not provide elements of a response to their more technical questions (genetic improvement of animals, animal diets, erosion control techniques). These farmers said that they would have prefered technical training or visits on farms that had tried innovative practices.
3.3 Validation of the Usefulness of the Model
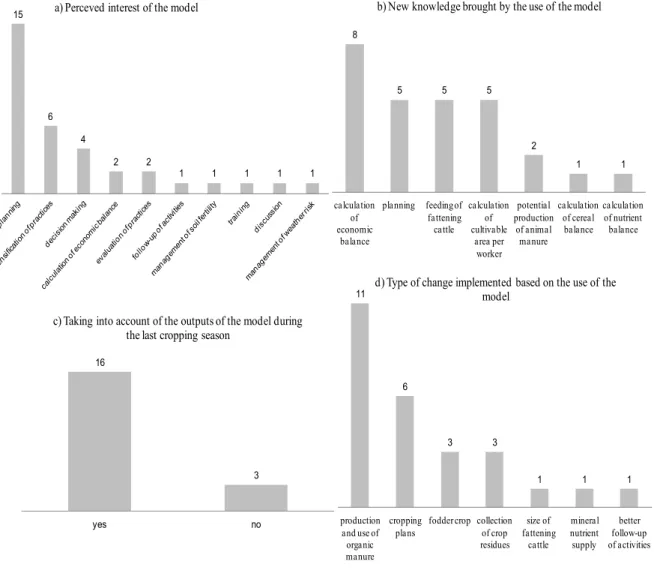
The types of knowledge mentioned by farmers were very diverse, from management skills (planning), calculation skills (calculation of economic balance or cultivable area per worker), to more technical knowledge (how to feed fattening cattle).
A large majority declared having implemented some technical or organisational changes during the cropping season; including, for example, producing and using organic manure or planning their cropping season (Figure 5). Although few farmers were interested in the insights provided by the model on nutrient balance, a majority of them declared having produced and used organic manure. Before using the model, many farmers were aware of the positive effect of organic nutrients on soil fertility and yields but they had never really quantified the possible
2
4
3
10
www.ccsenet.org/jas Journal of Agricultural Science Vol. 4, No. 9; 2012
168
decrease in the cost of mineral fertilizers permitted by an increase of organic nutrient production. The model revealed a favourable impact on farm revenue that farmers had not expected.
They added that the model was a useful tool for planning and for deciding whether and how to intensify practices.
Figure 5. Ex-post evaluation by farmers of the interest of the model, and its impacts on their knowledge and practices
4. Discussion
4.1 Cikeda, a Valid Tool ?
This study analyzed the validity of a model that was designed by stakeholders. The analysis considered the use and usefulness of the model for stakeholders, assessed immediately after the exercise and six to twelve months later. This validation was based on declarations of farmers with the assumption that their answers were not biased by advantages expected from the presence of the research program. In action research programs, assessments by stakeholders is favoured, based on the assumption that stakeholders’ skills and evaluation criteria are particularly relevant to the specific context, and that relationships of confidence are established between stakeholders and scientists (Becu et al., 2008 ; Chia, 2005; Chia & Deffontaines, 1999). We may thus consider that this kind of tool and more broadly this kind of participative modelling exercise is able to assist farmers in making farm management decision.
For this action research program, two boundary objects were used: an organisational one (the CVDs), and a technical one (the model). Each object did not play the same role in the process. The role of CVDs was to alert scientists to agropastoral problems as well as to empower farmers (Merril-Sand & Collion, 1994) to help them
16
3
yes no
c) Taking into account of the outputs of the model during the last cropping season
11 6 3 3 1 1 1 production and use of organic manure cropping plans
fodder crop collection of crop residues size of fattening cattle mineral nutrient supply better follow-up of activities
d) Type of change implemented based on the use of the model 15 6 4 2 2 1 1 1 1 1
a) Perceved interest of the model
8 5 5 5 2 1 1 calculation of economic balance planning feeding of fattening cattle calculation of cultivable area per worker potential production of animal manure calculation of cereal balance calculation of nutrient balance
www.ccsenet.org/jas Journal of Agricultural Science Vol. 4, No. 9; 2012
participate in the different stages of the research programme. A CVD operated as a “social” mediator. The role of the model was much more to create a shared understanding of the research subject: the functioning of the farming system. In this case it operated as a “cognitive” mediator (Trompette & Vinck, 2009). The complementary roles of these boundary objects may have contributed to the good perception of farmers on the usefulness of the participatory modelling approach.
Not all of the farmers demonstrated the same level of interest in the use of the model. Nevertheless, the farmers immediately interested by the tool were the farmers targeted by this approach, namely, farmers in the midst of considering how to transform their farms to improve performance. These farmers are confronted with the need to explore new problem definitions and make progress that Sterk et al. (2006) described as one of the most important criteria for finding niches for whole-farm design models.
Model-based approaches are increasingly integrated within broader participatory approaches (Becu et al., 2008; Ritzema, Froebrich, Raju, Sreenivas, & Kselik, 2010). However, Martin, Felten, and Duru (2011) noted that these approaches mainly address environmental management issues at the regional scale. Lisson et al. (2010) added that there are few examples of the application of simulation models that have led successfully to demonstrable impacts on smallholder farms. Furthermore, examples of the effective use of the models by stakeholders in these approaches are rare. Models remain tools used by researchers to produce knowledge on alternative scenarios that are discussed in a second step with farmers (Casagrande et al., 2010; van Wijk et al., 2009). Consequently, the production of knowledge is disassociated from the action with stakeholders, which can be inefficient (Hatchuel, 2000). In the action research presented here, these two steps are carried out jointly.
The balance-based modelling structure allowed researchers to clearly explain to farmers and advisors how the relationship between crops and livestock within a farm were represented. Calculations made by the model formalized some of the reasoning that farmers conduct empirically in the course of their management processes, for instance: how much forage would I need to feed my herd during the dry season? Would I get enough manure to fertilize my maize crop? The capacity of the model to evaluate quantitatively the balance between resource supply and demand provided a way for farmers to better plan their actions, something they were not used to doing. On the economic side, the outputs calculated were a simple financial translation of technical inputs and productions. They were, however, of great value for farmers, whose reasoning was based more on cash flows than on margins and annual income.
The quantitative results of the model were based on a simplified representation of biotechnical processes using constants based on farmer or advisor opinion or obtained from literature on the region. These so called “operational” models are simplified and rely on data that are easily accessible in the field (Bockstaller et al., 2008). This methodological choice allows stakeholders to be involved in the modelling process. Outputs of the model have an exploratory rather than a predictive interest, which would require a high level of precision. The comparison of magnitudes and trends between scenarios can support the farmer’s reflexion and analysis regarding the changes to be implemented on the farm (Andrieu & Nogueira, 2010; Lisson et al., 2010). Nevertheless, reliable data sources must be used when the constants of the model are being set. Specific constant setting procedures have been explored through surveys focussing on the processes to be modelled and focus group sessions gathering farmers, advisors and researchers to collectively define the value or values of various constants (Ritzema et al., 2010).
As for any intermediary tool (Liu, 1997; Trompette & Vinck, 2009), the model is intended to disappear at the end of the action research, or as soon as the questions asked by stakeholders change. In this context, and as is true for other participative modelling processes (Becu et al., 2008; Voinov & Bousquet, 2010), the model itself is less important than its design and use process, and the dialogue it promotes between a farmer and an advisor.
4.2 The Respective Role of Stakeholders in the Modelling Process
Developing an ad-hoc model (Affholder et al., 2012) instead of adapting an existing one is in accordance with the research approach chosen, which seeks to build a common language between stakeholders on the functioning of a crop-livestock farm and capture the specific interactions taking place between its components. There was a risk that users not included in the design process of an existing model may not familiarize themselves with it, which could result in a normative use of the model. In this process, the different stakeholders and researchers did not have the same functions. Farmers provided the questions to be addressed by the model, the farm elements and the management processes to be modelled, and the input data required to characterize the various scenarios. They also validated the modelling choices, proposed the scenarios of change and analyzed the outputs. Researchers made modelling choices to translate the knowledge collected from farmers into a conceptual model that was acceptable to the stakeholders involved in the research. They also observed and analyzed the interaction between farmers and
www.ccsenet.org/jas Journal of Agricultural Science Vol. 4, No. 9; 2012
170
advisors in order to improve the modelling process. Advisors in charge of using the model and analyzing simulation outputs with farmers played the role of a translator or intermediary between the scientific and empirical worlds.
Advisors indeed may play a major role in breaking away from the linear transfer of knowledge and innovation that often is still encountered in agriculture (Röling & de Jong, 1998; Sumberg, 2005). They must effectively become familiar with the modelling process, which assumes a capacity to grasp abstractions of reality, the possession of technical skills in the fields addressed by the model, computer skills, and a good interpersonal relationship with farmers. The approach thereby contributes to the training of advisors on models and the technical skills needed for their use. Given the simplifications in the model, whose outputs have an exploratory rather than a predictive value, advisors must take care not to adopt a normative or prescriptive attitude.
The development and use of this kind of model within advisory structures that use conventional approaches (technical outreach, advice based on an analysis of past farming results) should require the involvement of the managers of the advisory structures in participatory action research and consequently a redefinition of their interactions with farmers and researchers (Djamen Nana, Djonnewa, Havard, & Legile, 2003; Koye & Havard, 2010; Percy, 2011). The design and testing of such an innovative approach therefore must be supported by further research on the development of advisory service mechanisms (Le Gal et al., 2011). Regarding software development, this research should be based on a participatory design methodology (Kensing & Blomberg, 1998), which claims that technology (here the software) has strong impacts on workers (here the advisor) and that workers must be involved in their design in order to improve the efficiency of the whole design and utilization process (Béguin, Cerf & Prost, 2010).
5. Conclusion
This paper presents the results of a participative modelling exercise. Farmers and advisors were part of an organisational device called, “Committee of Village Deliberation”, that allowed them to be involved in all of the steps of the research programme: the choice and design of models, the definition and analysis of scenarios, the design of alternative strategies, and the assessment of the approach. The modelling principle adopted was to estimate the supply and demand of nutrients, cereals, forage and cash using a limited number of simulated biophysical and decision making processes. The model thus matches data entered by the user on the farm structure and on the strategic and tactical choices to be tested with various parameters estimated with stakeholders that enable the main biophysical processes to be characterized. Validation was intended to assess the use and usefulness of the model. It was done by using the model with farmers and advisors, and by evaluating 6 months to one year after the farmers had used the model if they remembered well the outputs of the model and their perception of the new knowledge and practices induced by the exercise. A large majority of the farmers were able to design alternative management strategies based on the outputs of the previous scenarios simulated. They were able to describe at least two of the main four outputs of the model, suggesting a good understanding of the tool. A large majority declared having acquired new knowledge on how to calculate the economic balance or on how to plan the cropping season. They also declared to have adopted new technical practices such as the production and use of organic manure, and new management practices, such as planning their cropping pattern. Research remains to be conducted on the design of advisory services with stakeholders that can integrate these models and provide a central role to advisors with reinforced skills.
Acknowledgements
This study was funded by the Corus program of the French Ministry of Foreign Affairs. The authors thank the farmers and advisors from Koumbia and Kourouma who accepted to work with them throughout the study. The students of the University of Bobo-Dioulasso are acknowledged for the implementation of the interface of Cikεda, and Grace Delobel for translating the paper into English.
References
Adesina, A. A. A., & Ouattara, A. D. (2000). Risk and agricultural systems in northern Côte d'Ivoire. Agricultural
Systems, 66, 17-32. http://dx.doi.org/10.1016/S0308-521X(00)00033-0
Affholder, F., Jourdain, D., Quang, D. D., Tuong, T. P., Morize, M., & Ricome, A. (2010). Constraints to farmers’ adoption of direct-seeding mulch-based cropping systems: A farm scale modeling approach applied to the mountainous slopes of Vietnam. Agricultural Systems, 103, 51-62. http://dx.doi.org/10.1016/j.agsy.2009.09.001
Affholder, F., Tittonell, P., Corbeels, M., Roux, S., Motisi, N., Tixier, P., & Wery, J. (2012). Ad Hoc Modeling in Agronomy: What Have We Learned in the Last 15 Years? Agronomy Journal, 104, 735-748.
www.ccsenet.org/jas Journal of Agricultural Science Vol. 4, No. 9; 2012
Andrieu, N., & Nogueira, D. M. (2010). Modeling biomass flows at the farm level: a discussion support tool for farmers. Agronomy for sustainable development, 30, 505-513. http://dx.doi.org/10.1051/agro/2009047 Aubry, C., Papy, F., & Capillon, A. (1998). Modelling decision-making processes for annual crop management.
Agricultural Systems, 56, 45-65. http://dx.doi.org/10.1016/S0308-521X(97)00034-6
Becu, N., Neef, A., Schreinemachers, P., & Sangkapitux, C. (2008). Participatory computer simulation to support collective decision-making: Potential and limits of stakeholder involvement. Land use policy, 25, 498-509. http://dx.doi.org/10.1016/j.landusepol.2007.11.002
Béguin, P., Cerf, M., & Prost, L. (2010). Co-design as a distributed dialogical design. In 9th European IFSA
Symposium, 393-401.Vienna, Austria.
Bockstaller, C., Guichard, L., Makowski, L., Aveline, A., Girardin, P., & Plantureux, S. (2008). Agri-environmental indicators to assess cropping and farming systems. A review. Agronomy for Sustainable
Development, 28, 139-149. http://dx.doi.org/10.1051/agro:2007052
Callon, M., Lascousme, P., & Barthes, Y. (2001). Agir dans un monde incertain. Essai sur la démocratie technique. Paris, France, Le Seuil.
Casagrande, M., Dogliotti, S., Groot, J., Aguerre, V., Abbas, A., Albín, A., Claassen, F., Chilibroste, P., Rossing, W. (2010). Exploring options for sustainable farming systems development for vegetable family farmers in Uruguay using a modeling toolkit. In Building sustainable rural futures. The added value of systems approaches in times of change and uncertainty, Vienna, Austria, 04 - 07 July, 2010. Vienna: University of Natural Resources and Applied Life Sciences, 2010 - ISBN 9783200019089 9th European IFSA Symposium, Vienna, Austria, 2010-07-04/ 2010-07-07, pp. 463-469.
Cash, D. W., Clark, W. C., Alcock, F., Dickson, N. M., Eckley, N., Guston, D. H., Jäger, J., & Mitchell, R. B. (2003). Knowledge systems for sustainable development. Proceedings of the National Academic Sciences,
100, 8086-8091. http://dx.doi.org/10.1073/pnas.1231332100PMid:12777623PMCid:166186
Chia, E. (2005). Principes, méthodes de la recherche en partenariat: une proposition pour la traction animale.
Revue d'élevage et de mèdecine vétérinaire des pays tropicaux, 57, 233-240.
Chia, E., Deffontaines, J. P. (1999). Pratiques et dispositifs de recherches face à un problème d’environnement.
Nature Sciences Société, 7, 31-41. http://dx.doi.org/10.1016/S1240-1307(99)80004-1
Cooper, P. J. M., Dimes, J., Rao, K. P. C., Shapiro, B., Shiferaw, B., & Twomlow, S. J. (2008). Coping better with current climatic variability in the rain-fed farming systems of sub-Saharan Africa: An essential first step in adapting to future climate change? Agriculture. Ecosystems and Environment, 126, 24-35. http://dx.doi.org/10.1016/j.agee.2008.01.007
Debaeke, P., & Aboudrare, A. (2004). Adaptation of crop management to water-limited environments. European
Journal of Agronomy, 21, 433-446. http://dx.doi.org/10.1016/j.eja.2004.07.006
Djamen Nana, P., Djonnewa, A., Havard, M., & Legile, A. (2003). Former et conseiller les agriculteurs du Nord-Cameroun pour renforcer leurs capacités de prise de décision. Cahiers Agricultures, 12, 241-245. Dugué, P., & Dongmo Ngoutsop, A. L. (2004). Traction animale et association agriculture élevage dans les
savanes d'Afrique de l'Ouest et du Centre. D'un modèle techniciste à une démarche d'intégration raisonnée à différentes échelles. Revue d'élevage et de mèdecine vétérinaire des pays tropicaux, 57, 157-165.
Faure, G., Gasselin, P., Triomphe, B., Hocdé, H., & Temple, L. (2010). Innover avec les acteurs du monde rural: La recherche-action en partenariat. Versailles, France, Quae.
Fox, P., Rockström, J., & Barron, J. (2005). Risk analysis and economic viability of water harvesting for supplemental irrigation in semi-arid Burkina Faso and Kenya. Agricultural Systems, 83, 231-250. http://dx.doi.org/10.1016/j.agsy.2004.04.002
Giller, K. E., Tittonell, P., Rufino, M. C., Wijk, M. T. V., Zingore, S., Mapfumo, P., … Vanlauwe, B. (2011). Communicating complexity: Integrated assessment of trade-offs concerning soil fertility management within African farming systems to support innovation and development. Agricultural Systems, 104, 191-203. http://dx.doi.org/10.1016/j.agsy.2010.07.002
Hatchuel, A. (2000). Recherche, Intervention et production de connaissances. Recherche pour et sur le développement territorial - Tome 2: conférences et ateliers. Orientation et Organisation 27-40.
www.ccsenet.org/jas Journal of Agricultural Science Vol. 4, No. 9; 2012
172
Herrero, M., Thornton, P. K., Notenbaert, A. M., Wood, S., Msangi, S., Freeman, H. A., … Rosegrant, M. (2010). Smart Investments in Sustainable Food Production: Revisiting Mixed Crop-Livestock Systems. Science, 327, 822-825. http://dx.doi.org/10.1126/science.1183725
Keating, B. A., & McCown, R. L. (2001). Advances in farming systems analysis and intervention. Agricultural
Systems, 70, 555-579. http://dx.doi.org/10.1016/S0308-521X(01)00059-2
Kensing, F., & Blomberg, J. (1998). Participatory design: issues and concerns. Computer Supported Cooperative
Work, 7, 167-185. http://dx.doi.org/10.1023/A:1008689307411
Koye, D., & Havard, M. (2010). De l’encadrement au conseil aux exploitations agricoles familiales : une évolution indispensable pour les zones cotonnières du Tchad et du Cameroun. Canadian Journal of Development
Studies, 31, 25-38.
Larrat, R., Levif, J., Pagot, J., Vandenbussche, J. (1988). Manuel vétérinaire des agents techniques de l'élevage
tropical (2nd ed.). Paris, La documentation française.
Le Gal, P. Y., Dugué, P., Faure, G., & Novak, S. (2011). How does research address the design of innovative agricultural production systems at the farm level? A review. Agricultural Systems, 104, 714-728. http://dx.doi.org/10.1016/j.agsy.2011.07.007
Lisson, S., MacLeod, N., McDonald, C., Corfield, J., Pengelly, B., Wirajaswadi, L., … Brennan, L. (2010). A participatory, farming systems approach to improving Bali cattle production in the smallholder crop–livestock systems of Eastern Indonesia. Agricultural Systems, 103, 486-497. http://dx.doi.org/10.1016/j.agsy.2010.05.002
Liu, M. (1997). Fondements et pratiques de la recherche action. Paris: l’Harmattan.
Martin, G., Felten, B., & Duru, M. (2011). Forage rummy: A game to support the participatory design of adapted livestock systems. Environmental Modelling & Software, 26, 1442-1453. http://dx.doi.org/10.1016/j.envsoft.2011.08.013
Meinke, H., Baethgen, W. E., Carberry, P. S., Donatelli, M., Hammer, G. L., Selvaruju, R., & Stöckle, C. O. (2001). Increasing profits and reducing risks in crop production using participatory systems simulation approches. Agricultural Systems, 70, 493-513. http://dx.doi.org/10.1016/S0308-521X(01)00057-9
Merrill-Sands, D., & Collion, M. H. (1994). Farmers And Researchers: The Road To Partnership. Agriculture and
Human Values, 11, 26-37. http://dx.doi.org/10.1007/BF01530444
Nziguheba, G., Palm, C. A., Berhe, T., Denning, G., Dicko, A., Diouf, O., … Sanchez, P. A. (2010). The African Green Revolution: Results from the Millennium Villages Project. Advances in Agronomy, 109, 75-115. http://dx.doi.org/10.1016/B978-0-12-385040-9.00003-7
Okello, J. J., Kirui, O. K., Njiraini, G. W., & Gitonga, Z. M. (2012). Drivers of Use of Information and Communication Technologies by Farm Households: The Case of Smallholder Farmers in Kenya. Journal of
Agricultural Science, 4, 111-124.
Pavé, A. (2005). La modélisation et la simulation des objets et processus complexes. Questions scientifiques, méthodologiques et éthiques. Natures Sciences Sociétés, 13, 169-171.
Percy, R. (2005). The contribution of transformative learning theory to the practice of participatory research and extension: Theoretical reflections. Agriculture and Human Values, 22, 127-136. http://dx.doi.org/10.1007/s10460-004-8273-1
Ritzema, H., Froebrich, J., Raju, R., Sreenivas, C., & Kselik, R. (2010). Using participatory modelling to compensate for data scarcity in environmental planning: A case study from India. Environmental Modelling
& Software, 25, 1450-1458. http://dx.doi.org/10.1016/j.envsoft.2010.03.010
Röling, N., & de Jong, F. (1998). Learning: shifting paradigms in education and extension studies. The Journal of
Agricultural Education and Extension, 5, 143-161. http://dx.doi.org/10.1080/13892249885300281
Saka, J. O., Okoruwa, V. O., Oni, O. A., & Oyekale, A. S. (2011). The Structure and Determinants of Land-use Intensity among Food Crop Farmers in Southwestern Nigeria. Journal of Agricultural Science, 3, 194-205. Sangaré, M. (2005). Synthèse des résultats acquis sur l'élevage des petits ruminants dans les systèmes de
www.ccsenet.org/jas Journal of Agricultural Science Vol. 4, No. 9; 2012
Sterk, B., Ittersum, M. K. V., Leeuwis, C., Rossing, W. A. H., van Keulen, H., & Ven, G. W. J. V. D. (2006). Finding niches for whole-farm design models – contradictio in terminis? Agricultural Systems, 87, 211-228. http://dx.doi.org/10.1016/j.agsy.2004.11.008
Sumberg, J. (1998). Mixed farming in Africa: the search for rder, the search for sustainability. Land use policy, 15, 293-317. http://dx.doi.org/10.1016/S0264-8377(98)00022-2
Sumberg, J. (2005). Constraints to the adoption of agricultural innovations - Is it time for a re-think? Outlook on
Agriculture, 34, 7-10. http://dx.doi.org/10.5367/0000000053295141
Thornton, P. K., & Herrero, M. (2001). Integrated crop-livestock simulation models for scenario analysis and impact assessment. Agricultural Systems, 70, 581-602. http://dx.doi.org/10.1016/S0308-521X(01)00060-9 Trompette, P., & Vinck, D. (2009). Retour sur la notion d'objet-frontière. Revue d'anthropologie des
connaissances, 3, 5-27.
Twomlow, S., Mugabe, F. T., Mwale, M., Delve, R., Nanja, D., Carberry, P., & Howden, M. (2008). Building adaptive capacity to cope with increasing vulnerability due to climatic change in Africa – A new approach.
Physics and Chemistry of the Earth, 33, 780-787. http://dx.doi.org/10.1016/j.pce.2008.06.048
Vall, E., Chia, E., Andrieu, N., & Bayala, I. (2008). Role of partnership and experimentation for the co-design of sustainable innovations: The case of the West of Burkina Faso. In Empowerment of the rural actors. A
renewal of farming systems perspectives, Ed. Dedieu, Benoît. Clermont-Ferrand: 8 th European IFSA
Symposium.
Vall, E., Dugue, P., & Blanchard, M. (2006). Le tissage des relations agriculture-élevage au fil du coton. Cahiers
Agriculture, 15, 72-79.
van Rijn, F., Bulte, E., & Adekunle, A. (2012). Social capital and agricultural innovation in Sub-Saharan Africa.
Agricultural Systems, 108, 112-122. http://dx.doi.org/10.1016/j.agsy.2011.12.003
Van Wijk, M. T., Tittonell, P., Rufino, M. C., Herrero, M., Pacini, C., Ridder, N. D., & Giller, K. E. (2009). Identifying key entry-points for strategic management of smallholder farming systems in sub-Saharan Africa using the dynamic farm-scale simulation model NUANCES-FARMSIM. Agricultural Systems, 102, 89-101. http://dx.doi.org/10.1016/j.agsy.2009.07.004
Voinov, A., & Bousquet, B. (2010). Modelling with stakeholders. Environmental Modelling & Software, 25, 1268-1281. http://dx.doi.org/10.1016/j.envsoft.2010.03.007
Whitbread, A. M., Robertson, M. J., Carberry, P. S., & Dimes, J. P. (2010). How farming systems simulation can aid the development of more sustainable smallholder farming systems in southern Africa. European Journal