HAL Id: hal-01828600
https://hal.archives-ouvertes.fr/hal-01828600
Submitted on 21 Dec 2018
HAL is a multi-disciplinary open access
archive for the deposit and dissemination of
sci-entific research documents, whether they are
pub-lished or not. The documents may come from
teaching and research institutions in France or
abroad, or from public or private research centers.
L’archive ouverte pluridisciplinaire HAL, est
destinée au dépôt et à la diffusion de documents
scientifiques de niveau recherche, publiés ou non,
émanant des établissements d’enseignement et de
recherche français ou étrangers, des laboratoires
publics ou privés.
Boukary Ouedraogo, Yasuko Inoue, Alinsa Kambiré, Kankoé Sallah, Sokhna
Dieng, Raphael Tine, Toussaint Rouamba, Vincent Herbreteau, Yacouba
Sawadogo, Landaogo Ouedraogo, et al.
To cite this version:
Boukary Ouedraogo, Yasuko Inoue, Alinsa Kambiré, Kankoé Sallah, Sokhna Dieng, et al..
Spatio-temporal dynamic of malaria in Ouagadougou, Burkina Faso, 2011–2015. Malaria Journal, BioMed
Central, 2018, 17 (1), pp.138. �10.1186/s12936-018-2280-y�. �hal-01828600�
RESEARCH
Spatio-temporal dynamic of malaria
in Ouagadougou, Burkina Faso, 2011–2015
Boukary Ouedraogo
1*†, Yasuko Inoue
1,2†, Alinsa Kambiré
1, Kankoe Sallah
1,3, Sokhna Dieng
1,4, Raphael Tine
1,
Toussaint Rouamba
1,5,6, Vincent Herbreteau
7, Yacouba Sawadogo
8, Landaogo S. L. W. Ouedraogo
9,
Pascal Yaka
10, Ernest K. Ouedraogo
10, Jean‑Charles Dufour
1and Jean Gaudart
1Abstract
Background: Given the scarcity of resources in developing countries, malaria treatment requires new strategies that target specific populations, time periods and geographical areas. While the spatial pattern of malaria transmission is known to vary depending on local conditions, its temporal evolution has yet to be evaluated. The aim of this study was to determine the spatio‑temporal dynamic of malaria in the central region of Burkina Faso, taking into account meteorological factors.
Methods: Drawing on national databases, 101 health areas were studied from 2011 to 2015, together with weekly meteorological data (temperature, number of rain events, rainfall, humidity, wind speed). Meteorological factors were investigated using a principal component analysis (PCA) to reduce dimensions and avoid collinearities. The Box–Jen‑ kins ARIMA model was used to test the stationarity of the time series. The impact of meteorological factors on malaria incidence was measured with a general additive model. A change‑point analysis was performed to detect malaria transmission periods. For each transmission period, malaria incidence was mapped and hotspots were identified using spatial cluster detection.
Results: Malaria incidence never went below 13.7 cases/10,000 person‑weeks. The first and second PCA components (constituted by rain/humidity and temperatures, respectively) were correlated with malaria incidence with a lag of 2 weeks. The impact of temperature was significantly non‑linear: malaria incidence increased with temperature but declined sharply with high temperature. A significant positive linear trend was found for the entire time period. Three transmission periods were detected: low (16.8–29.9 cases/10,000 person‑weeks), high (51.7–84.8 cases/10,000 person‑ weeks), and intermediate (26.7–32.2 cases/10,000 person‑weeks). The location of clusters identified as high risk varied little across transmission periods.
Conclusion: This study highlighted the spatial variability and relative temporal stability of malaria incidence around the capital Ouagadougou, in the central region of Burkina Faso. Despite increasing efforts in fighting the disease, malaria incidence remained high and increased over the period of study. Hotspots, particularly those detected for low transmission periods, should be investigated further to uncover the local environmental and behavioural factors of transmission, and hence to allow for the development of better targeted control strategies.
Keywords: Malaria, Spatio‑temporal dynamic, Hotspots, Spatial clusters
© The Author(s) 2018. This article is distributed under the terms of the Creative Commons Attribution 4.0 International License (http://creativecommons.org/licenses/by/4.0/), which permits unrestricted use, distribution, and reproduction in any medium, provided you give appropriate credit to the original author(s) and the source, provide a link to the Creative Commons license, and indicate if changes were made. The Creative Commons Public Domain Dedication waiver (http://creativecommons.org/ publicdomain/zero/1.0/) applies to the data made available in this article, unless otherwise stated.
Open Access
*Correspondence: boukary.ouedraogo@univ‑amu.fr
†Boukary Ouedraogo and Yasuko Inoue are both first authors and
contributed equally to this work
1 Aix Marseille Univ, INSERM, IRD, SESSTIM UMR1252 Sciences
Economiques & Sociales de la Santé & Traitement de l’Information Médicale, Marseille, France
Background
In 2015, malaria was the first cause of outpatient con-sultations (48.0%), hospitalizations (22.6%) and death (23.9%) in Burkina Faso [1]; it was also the main cause of illness among children (80%) [2]. Given the scarcity of resources in the country, malaria treatment requires new strategies that target specific populations, time periods and geographical areas. The World Health Organization (WHO) recommends implementing 2 sets of comple-mentary interventions [3]: (i) universal strategies based on vector control, such as universal distribution of long-lasting insecticide-treated nets (LLINs) and universal access to rapid diagnosis and treatment in health facili-ties (pillar 1 of the 2015 WHO malaria report); and, (ii) locally tailored strategies that target vulnerable popula-tions (e.g., chemoprevention in pregnant women and children under 5 years), and ones that target spatio-tem-poral malaria hotspots (with a specific focus on parasites and vectors) (pillars 2 and 3 of the report). For their part, Yukich et al. recommend active case detection and preva-lence surveillance at very precise levels of transmission [4]. A number of studies have highlighted the importance of targeting high incidence areas and/or asymptomatic carriers to reduce malaria transmission [5–7]. Others have argued that insofar as spatial heterogeneity gradu-ally increases with the decrease in transmission intensity, intervention programmes should be implemented during low transmission periods [8].
In Burkina Faso, the current national policy is based on universal access to rapid diagnostic test (RDT) and arte-misinin-based combination therapy (ACT), and on uni-versal distribution of LLINs [9]. Similar to the situation in other West African countries where malaria transmission is seasonal [10], a strategy targeting children during high transmission periods was implemented in July 2016 in 50 out of 70 health districts (covering a total of 10,874,840 inhabitants) [11]. Each year, this seasonal malaria chem-oprevention (SMC) programme covers children aged 3–59 months from July to October [2]. Despite such efforts, the incidence of malaria remains high throughout Burkina Faso. In view of this, malaria treatment requires new, targeted strategies that are based on spatio-tempo-ral assessments of malaria transmission [4].
In Ouagadougou, the capital of Burkina Faso, a previ-ous cross-sectional study (2004) investigating 8 out of 30 neighbourhoods showed that malaria incidence among children (6–12 years) was heterogeneous and associated with lower economic or education levels, distance from hydrological areas, irregularly built-up areas, and lack of LLIN use [12]. However, the dynamic of malaria trans-mission in the entire central region, including the capi-tal city and the adjacent rural areas has to be explored. In the context of seasonal control strategies, high and
low transmission periods need to be properly defined, and the relationships between meteorological factors and onsets of the yearly epidemic need to be better under-stood, as this will make it possible to anticipate the trans-mission of the disease.
Lastly, while the spatial pattern of malaria transmis-sion is known to vary depending on local conditions, its temporal evolution has yet to be evaluated. Studies have shown that even at a very local scale, Anopheles density and malaria incidence are heterogeneous and associated with spatial and temporal hotspots [8, 13, 14]. Conse-quently, hotspots should be thoroughly investigated to allow for the development of targeted control strategies [8, 15–17].
The aim of this study was to determine the spatio-tem-poral dynamic of malaria in the central region of Burkina Faso, taking into account meteorological factors.
Methods
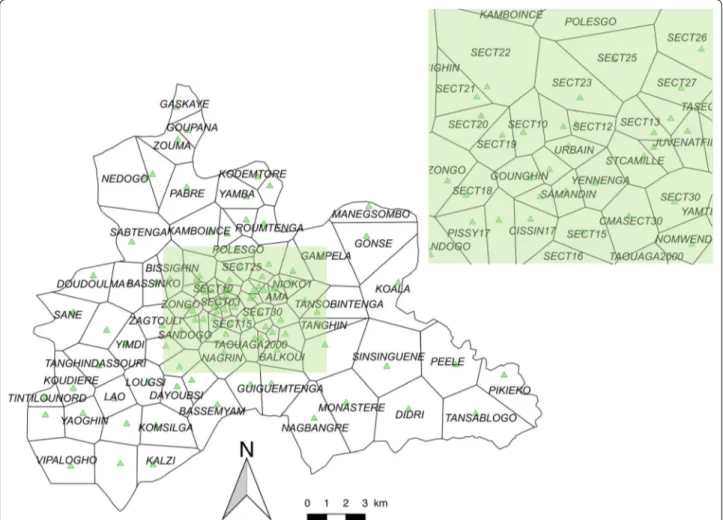
The central region of Burkina Faso has a surface area of 2869 sq km, and includes the capital Ouagadougou (urban area) along with 6 semi-urban or rural provincial departments. In 2015, the population of the region was 2,637,303, representing 14.86% of the national popula-tion, and its annual growth rate was 4.2% [1]. The region is divided into 101 health areas (HAs) distributed in 5 health districts (Fig. 1).
The global positioning system (GPS) coordinates of each HA were extracted from the national health map [18] and confirmed by field investigations. Estimated population per HA was extracted from the yearly national action plan for each health district, based on the last cen-sus (2006) and the projection (until 2016) released by the
Institut National de la Statistique et de la Démographie
(INSD).
In Burkina Faso, data on malaria incidence can be obtained from 2 sources. The first is the national epi-demiological surveillance system, known as the
Télé-gramme Lettre Officiel Hebdomadaire (TLOH). In this
system, HAs are required to provide weekly reports on 11 diseases (including malaria) to their respective health districts; reported cases are then gathered and controlled by the health districts before being sent to the Ministry of Health. The second is a national database known as ‘BD-Malaria’, which focuses on malaria and is mainly aimed at facilitating the management of RDT and ACT. This data-base publishes monthly reports on the number of malaria cases, RDT use, treatment stocks (ACT), and the number of LLINs distributed to pregnant women. It relies on the monthly reports provided by all health facilities of Bur-kina Faso.
In this study, malaria cases were extracted from the TLOH database (weekly) and the BD-Malaria database
(monthly) for a 5-year period (2011/1/3–2015/12/27) and for each HA. The 2 databases were compared to validate/ correct the weekly number of cases.
Weekly meteorological data were obtained from one meteorological station (Station de l’Aéroport
Interna-tional de Ouagadougou) of the Direction NaInterna-tionale de la Météorologie for the same study period. The
meteoro-logical variables included were: weekly rainfall (mm), the number of rain events per week, weekly averages of mini-mum and maximini-mum daily temperature (°C), weekly aver-ages of minimum and maximum daily relative humidity (%), and weekly averages of daily wind speed (km/h).
To begin, meteorological factors were identified using a principal component analysis (PCA) to reduce dimensions and avoid collinearities. The stationarity of the malaria time series and that of the combined mete-orological time series derived from the main compo-nents were determined with the Box–Jenkins ARIMA modelling procedure (seasonal auto-regressive inte-grated moving average) [19–21]. The lags between
the stationary time series of malaria and the station-ary time series of each meteorological factor were measured using cross-correlation functions. Second, the impact of the different meteorological factors on malaria incidence was assessed using a general addi-tive model (GAM). The latter included meteorological components (presenting a significant cross-correlation after the time series was shifted by the time lag), sea-sonality and trends. A negative binomial distribution was used to account for over-dispersion, and the log-transformed population count was used as an offset to estimate standardized incidence ratios [22]. Fur-thermore, spline smoothing was performed to capture the non-linear relationship between malaria incidence and combined meteorological factors. Third, a change-point analysis was conducted to detect high, low and intermediate transmission periods (respectively, HTP, LTP and ITP). The change-point analysis in mean and variance was performed using the pruned exact linear time algorithm (PELT) [23].
Fig. 1 Health area limits and locations of health facilities. Black lines correspond to the limits of the HAs (Thiessen polygons). Each green triangle
For each transmission period derived from the change-point analysis, malaria incidence was mapped, and hotspots were identified using Kulldorff’s spatial scan statistic. The latter approach seeks to group the various neighbouring spatial units into potential clusters by mov-ing a scannmov-ing window across the geographical region of interest. The algorithm uses circular windows centred at each HA. Potential clusters are defined for a radius rang-ing from 1 to 50% of the population [24].
The incidences were mapped at the health area scale. Currently, each health facility is associated with an administrative HA defined by the Ministry of Health. The field investigation showed that these administra-tive boundaries were not relevant as inhabitants mainly accessed the closest health facility, and not the health facility administratively associated to their home. Using the GPS of each health facility, the areas based on the Thiessen polygon approach were estimated. This approach allowed to propose a theoretical area associ-ated with each health facility. Between each point cre-ated, corresponding to each health facility, a bisector was drawn to delimit the HA of two adjacent health facilities.
Each polygon represented the area around each health facility. The variation in the HA size was explained by the density of health facilities, greater in central urban area than in rural/remote ones.
Spatial cluster analysis was performed using Satscan software version 9.4 (Information Management Services Inc, Silver Spring, Maryland, USA). All other statistical analyses were performed using R v3.3.0 (The R Founda-tion for Statistical Computing, Vienna, Austria) (pack-ages {mgcv}{caschrono}{FactoMineR}{forecast}). QGIS software (version 2.12.2, Open Source Geospatial Foun-dation, Boston, USA) was used to provide maps. Figures were formatted with Paint.net software (v4.0.13, Warren Paint & Color Co., Nashville, USA).
Results
Overview of the time series
From 2011 to 2015, the malaria incidence time series revealed an association between classical seasonality and dry/rainy annual periodicity (Fig. 2). The highest incidences were observed between June and November. Beyond the classical seasonal pattern, a small rebound
Fig. 2 Weekly meteorological factors and malaria incidence from 2011 to 2015. Upper left y‑axis represents malaria incidence (1000 person‑weeks,
red curve); lower left y‑axis represents rainfall (mm, blue bar chart), maximum and minimum humidity (%, respectively continuous and dashed green curves); upper right y‑axis represents maximum and minimum temperature (°C, respectively continuous and dashed black curves). The white/ grey background (upper panel) represents the different transmission periods (white for intermediate, light grey for low, and dark grey for high)
was observed just after each annual epidemic. Yet despite the implementation of national control policies during this period, no decreasing trend was observed. Moreover, malaria incidence never went below 13.7 cases/10,000 person-weeks whatever the HA.
Meteorological data and malaria incidence analysis
Combination of the meteorological factors allowed to identify 3 main components (derived from the PCA, representing 90.17% of the inertia). The first compo-nent (53.6% of the inertia) was constituted by rain (rain-fall amount and number of rain events) and humidity (maximum and minimum weekly averages). Minimal and maximal temperatures (weekly averages) were combined into the second component (22.16% of the inertia). The weekly average wind speed formed the third component (14.41% of the inertia), see Additional file 1.
After stationarity, the first meteorological component (rainfall, rain events, humidity) was positively and sig-nificantly correlated with malaria incidence with a lag of 2 weeks (correlation coefficient: 0.18). The second
meteorological component (minimum and maximum temperatures) was negatively and significantly correlated with malaria incidence with a lag of 2 weeks (correlation coefficient: − 0.13). The third component (wind speed) was not significantly correlated with malaria incidence.
The multivariate analysis (GAM modelling) assessed the relationship between malaria incidence and the dif-ferent meteorological components (taking into account the time lag between them), explaining 75% of the devia-tion. It found a quasi-linear relationship with the first meteorological component (rainfall, rain events, humid-ity), indicating a significant increase in malaria incidence (p < 0.001; Fig. 3a). The impact of the second meteorolog-ical component (minimum and maximum temperatures) was significantly non-linear: malaria incidence increased with temperature but declined sharply with high tem-perature, indicating a negative impact of high tempera-ture on malaria (p < 0.001; Fig. 3b). A significant positive linear trend (p < 0.001) was also found for the entire time period, indicating an overall increase in malaria inci-dence in the region (Fig. 3c).
Fig. 3 Relationship between malaria incidence and the first meteorological factor (rainfall, rain events, humidity), the second meteorological
component (maximum and minimum temperatures), and time. The continuous black curves represent adaptive smooth relationships of malaria incidence according to the first meteorological component (a), the second meteorological component (b), and time (c), with a CI of 95% (dashed black curves)
Spatial hotspot distribution
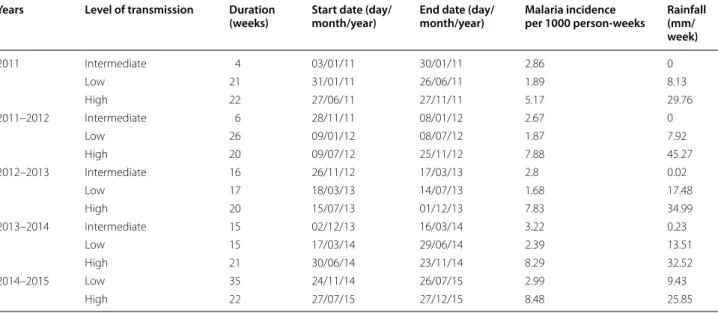
The change point analysis performed on the malaria inci-dence time series allowed to identify 3 transmission peri-ods: low, high, and intermediate (Table 1, Fig. 2).
Malaria incidence for LTPs ranged from 16.8 to 29.9 cases/10,000 person-weeks. LTPs generally began in February or March and lasted from 15 to 35 weeks; they overlapped with the dry and hot season for about 3–4 months, until the beginning of the rainy season. Note that the LTP of 2014–2015 was different from the other LTPs, with an observed mean rainfall of 9.43 mm/week.
Malaria incidence for HTPs ranged from 51.7 to 84.8 cases/10,000 person-weeks. HTPs began around the end of June or beginning of July, just after the start of the rainy season, and lasted until the middle or end of November. The duration of HTPs ranged from 20 to 22 weeks, and observed rainfall ranged from 25.85 to 45.27 mm.
ITPs started just after HTPs, and were distinguished from LTPs by significantly higher malaria incidence, which ranged from 26.7 to 32.2 cases/10,000 person-weeks. The duration of ITPs ranged from 4 to 16 person-weeks. ITPs overlapped with the dry and cold season (Decem-ber, January, February), for which almost no rain was recorded (i.e., observed mean rainfall ranged from 0 to 0.23 mm/week). Note that no ITP was detected for the year 2014–2015 (see Additional file 2).
Low transmission periods
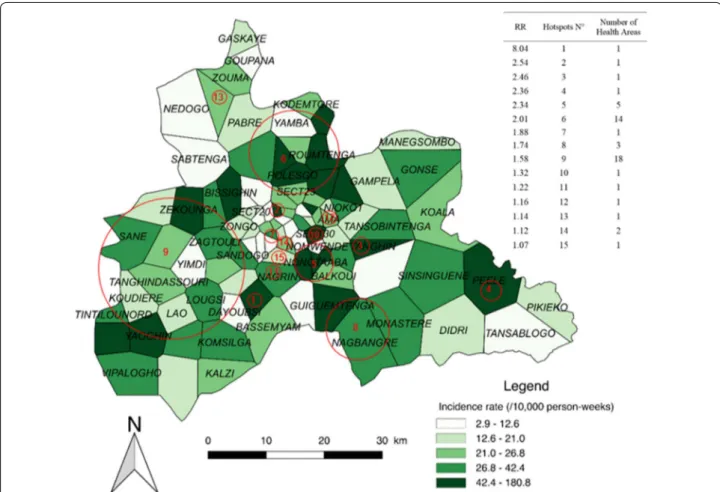
Fifteen significant hotspots including 52 HAs were detected for the combined LTPs, which presented an overall incidence rate of 22.7 cases/10,000 person-weeks. The highest-risk hotspot (Fig. 4, n°1) had a risk ratio
(RR) of 8.04 (p < 0.0001) and was composed of one HA (Zeguedesse). This HA was located in a rural area (in the southern and central part of the region), and had an inci-dence rate of 180.8 cases/10,000 person-weeks for a pop-ulation of 2969 inhabitants. The largest hotspot (Fig. 4, n°9) was located in a mixed urban/rural area in the west-ern part of the region. It was composed of 18 HAs, and had a RR of 1.58 (p < 0.0001) and an incidence rate of 34.2 cases/10,000 person-weeks.
The rural environment accounted for the highest num-ber of HAs (25); these were located in 6 hotspots present-ing an incidence rate of 39.1 cases/10,000 person-weeks (147,013 inhabitants). The urban environment accounted for 20 HAs; these were located in 11 hotspots present-ing an incidence rate of 35.3 cases/10,000 person-weeks (557,582 inhabitants) (see Additional file 3).
High transmission periods
Eight significant hotspots, including 61 HAs, were detected for the combined HTPs, which presented an overall incidence rate of 75.3 cases/10,000 person-weeks. The highest-risk hotspot (Fig. 5, n°1) had a RR of 2.86 (p < 0.0001) and was composed of 9 HAs (see Additional file 3). It was located in the northern part of the region, and had an incidence rate of 206.9 cases/10,000 person-weeks for a population of 53,216 inhabitants. The largest hotspot (Fig. 5, n°3) was located in a mixed urban/rural area in the southwestern and slightly central part of the region. It was composed of 25 HAs, and had a RR of 2.17 (p < 0.0001) and an incidence rate of 146.5 cases/10,000 person-weeks with a population of 224,778 inhabitants. Table 1 Malaria incidence and rainfall according to duration, start and end dates for the 3 transmission periods by year
Years Level of transmission Duration
(weeks) Start date (day/month/year) End date (day/month/year) Malaria incidence per 1000 person-weeks Rainfall (mm/ week) 2011 Intermediate 4 03/01/11 30/01/11 2.86 0 Low 21 31/01/11 26/06/11 1.89 8.13 High 22 27/06/11 27/11/11 5.17 29.76 2011–2012 Intermediate 6 28/11/11 08/01/12 2.67 0 Low 26 09/01/12 08/07/12 1.87 7.92 High 20 09/07/12 25/11/12 7.88 45.27 2012–2013 Intermediate 16 26/11/12 17/03/13 2.8 0.02 Low 17 18/03/13 14/07/13 1.68 17.48 High 20 15/07/13 01/12/13 7.83 34.99 2013–2014 Intermediate 15 02/12/13 16/03/14 3.22 0.23 Low 15 17/03/14 29/06/14 2.39 13.51 High 21 30/06/14 23/11/14 8.29 32.52 2014–2015 Low 35 24/11/14 26/07/15 2.99 9.43 High 22 27/07/15 27/12/15 8.48 25.85
The rural environment accounted for the highest num-ber HAs (40); these were located in 4 hotspots present-ing an incidence rate of 132.8 cases/10,000 person-weeks (381,421 inhabitants). The urban environment accounted for 15 HAs; these were located in 6 hotspots present-ing an incidence rate of 141 cases/10,000 person-weeks (413,713 inhabitants) (see Additional file 3). Note that the HA of Zeguedesse, located in hotspot n°3, had the high-est incidence rate with 852.4 cases/10,000 person-weeks. Intermediate transmission periods
Thirteen significant hotspots including 51 HAs were detected for the combined ITPs, which presented an overall incidence rate of 291 cases/10,000 person-weeks. The highest risk hotspot (Fig. 6, n°1) had a RR of 8.28 (p < 0.0001) and was composed of a single HA (Zeguedesse). This hotspot had an incidence rate of 238.9 cases/10,000 person-weeks for a population of 2969 inhabitants. The largest hotspot (Fig. 6, n°8) was located in a mixed urban/rural area in the western part of the region. It was composed of 18 HAs, and had a RR of 1.72
(p < 0.0001) and an incidence rate of 47.3 cases/10,000 person-weeks (196,730 inhabitants).
The rural environment accounted for the highest num-ber of HAs (27); these were located in 7 hotspots present-ing an incidence rate of 55 cases/10,000 person-weeks (38,684 inhabitants). The urban environment accounted for 20 HAs; these were located in 9 hotspots present-ing an incidence rate of 48.6 cases/10,000 person-weeks (107,430 inhabitants) (see Additional file 3).
Discussion
This study highlighted the spatial variability and relative temporal stability of malaria incidence around the capi-tal Ouagadougou, in the central region of Burkina Faso. Despite increasing efforts in fighting the disease, malaria incidence remained high and increased over the study period. The positive quasi-linear relationship between the first meteorological component (rainfall, rain events, humidity) and malaria was similar to that observed elsewhere.
Fig. 4 Spatial pattern of incidence per health area and spatial hotspots for low transmission periods. The choropleth map presents the incidence
rate (/1000 person‑weeks) for the combined LTPs over the 5 years. The red circles represent the high‑risk clusters. The attached Table presents the RRs for each hotspot along with the number of HAs
Studies have shown that small puddles of stagnant water exposed to the sun during the rainy season and the beginning of the dry/cold season are favourable to larvae development and mosquito survival in urban set-tings [25–28]. In this study, no negative impact of strong rains (which can destroy breeding sites) was found [29]. Moreover, the lag of 2 weeks between the first mete-orological component (rainfall, rain events, humidity) and malaria incidence was shorter than that reported in other countries assessing rainfall only (a lag of 3 months was reported in Mali [30], and lags of 2–3 months were reported in Ethiopia and East African highlands [28, 31]). This may be due to the presence of permanent water bodies in the region (with 5 dams) and permanent agri-culture areas that contribute to a constant presence of vectors at these locations. This may explain the rapid onset of malaria incidence at the beginning of the rainy season. Furthermore, publications assessing the relation-ship between vegetation and malaria showed similar lags [32–35]. This result could also be due to the analysis at the weekly scale (and not at the monthly scale) and by
the use of combinations of meteorological factor (using PCA).
The impact of temperature on malaria incidence has also been highlighted in several studies [36, 37]. In the context of Ethiopia [38], Peterson et al. identified a posi-tive impact of minimum temperature on malaria inci-dence after a lag of 4 weeks. Entomological studies have stressed the negative impact of high temperature, which increases Anopheles death rate [39–41]. Indeed, tempera-ture influences the duration of larvae development, the incubation period of parasites and mosquito survival [27,
37, 42]. Accordingly, the results showed both a positive impact of decreasing temperatures and a negative impact of increasing temperatures on malaria incidence.
While previous studies have found a decreasing impact of wind speed on mosquito survival [43–45], no sig-nificant relationship between wind speed and malaria incidence was observed. This results may be due to the higher incidence rate and relatively low wind speeds observed. In fact, during the harmattan period (mainly November to March) [46], high wind speed is associated
Fig. 5 Spatial pattern of incidence per health area and spatial hotspots for high transmission periods. The choropleth map presents the incidence
rate (/1000 person‑weeks) for the combined HTPs over the 5 years. The red circles represent the high‑risk clusters. The attached Table presents the RRs for each hotspot along with the number of HAs
with drought and high temperatures, making it difficult to study the impact of wind speed independently from temperature and drought.
While the impact of meteorological factors on malaria incidence has been the focus of numerous studies, malaria is also caused by other factors, notably parasitae-mia and human behaviour. Indeed, humans are the only reservoir of parasites, which means that sub-microscopic and asymptomatic carriage should be investigated for a better understanding of the dynamic of transmission [30,
36, 47]. Nevertheless, meteorological variables can be used to estimate and forecast malaria incidence, thereby providing public health decision-makers with a useful tool [48].
Most published studies (e.g. [12, 49]) describe 2 peri-ods of malaria transmission. By contrast, 3 transmission periods were identified, which did not perfectly cor-respond to the climatic seasons of Burkina Faso (hot– dry, rainy, cold–dry seasons). HTPs lasted from June to December, whereas the rainy season usually lasts from
April to October. This lag should be kept in mind when implementing pre-traveller prevention strategies or pro-grammes of SMC and intermittent treatment and pre-vention during pregnancy.
The definition of hotspots by using the Satscan method allowed to detect high-risk areas. This method has been developed to detect spatial or space–time clusters of cases, for different distributions [50–52], and for different cluster shapes [53]. This scanning approach makes it pos-sible to overcome the problem of the proximity matrix and the distance weighting function. Based on the like-lihood ratio test and a Monte Carlo approach, it allows taking into account the problem of the multiplicity of tests (unlike other scan methods) [24]. But the hotspots definition is relative to the overall incidence and not to particular high-risk places. Even if the method is not constrained by the scanning window shape, the circular or elliptic-shaped scanning window available within the software may impact the results in case of non-circular clusters or edge effects [54]. This approach tends then
Fig. 6 Spatial pattern of incidence per health area and spatial hotspots for intermediate transmission periods. The choropleth map presents the
incidence rate (/1000 person‑weeks) for the combined ITPs over the 5 years. The red circles represent the high‑risk clusters. The attached Table presents the RRs for each hotspot along with the number of HAs
to detect clusters that are too broad (lack of specificity), by absorbing nearby spatial units [24, 56]. Furthermore, the Satscan performances decrease for low baseline inci-dences, low sizes of the at-risk population and for low relative risks [55, 57].
Some hotspot locations varied little across the different transmission periods, indicating a relatively stable spa-tio-temporal pattern. Only the associated relative risks changed across transmission periods, though this was probably due to the method used to estimate these risks.
The specific HA of Zeguedesse (corresponding to hot-spot n°1 of the LTPs and to hothot-spot n°1 of the ITPs) was at higher risk of malaria throughout the 5-year period. This may be partly explained by population growth. Indeed, the construction of a new hospital centre (Cen-tre Hospitalier Universitaire Blaise Compaoré) in 2010 led to the destruction of the villages of Bassemyam and Dayoubsi (114 ha) and to the re-housing of the popula-tion in Zeguedesse. The populapopula-tion growth that ensued may have prompted an increase in transmission inten-sity, and hence in the number of reported cases. How-ever, given that no population census has been conducted since 2010, it may be that the population of Zeguedesse was underestimated, thereby leading to overestimated incidences.
When the transmission periods were compared, 3 zones of particular interest were found. The first zone was located in the southwestern part of the region, and included almost all rural areas of the Boulmiougou health district. Hotspots n°1 and 9 of the LTPs (Fig. 4) were included in hotspot n°3 of the HTPs (Fig. 4), with risk ratios (RRs) increasing from 1.58 and 8.04, respec-tively, for the LTPs to 2.17 for the HTPs. This zone also corresponded to hotspots n°1 and 8 of the ITPs, which presented RRs of 8.28 and 1.72, respectively. Second, a high-risk area was detected in the northern part of the region, with RRs of 2.01, 2.86 and 1.92 for the LTPs, HTPs, and ITPs, respectively (Figs. 4, 5, 6), correspond-ing to hotspots n°6, 1, and 5. Third, a stable high-risk area was found in the southeastern part of the region, with RRs of 1.74, 1.74, and 1.75 for the LTPs, HTPs, and ITPs, respectively (Figs. 4, 5, 6), corresponding to hotspots n°8, 5, and 7. In this zone, the location of hotspots n°4 and 2 was the same for the LTPs and the ITPs (Figs. 4, 6).
These 3 zones of interest are located in a similar envi-ronment. Indeed, there are 3 dams in the north of the capital, one dam in the southwest (near Boulmiougou), and one dam in the southeast (near Koubri). Further-more, the eastern part of the region is characterized by the presence of the Nakambe forest. This specific envi-ronment may be associated with a higher risk of malaria because it is favourable to the development of Anopheles breeding sites [58–61].
Conclusions
Despite increasing efforts to fight the disease, the inci-dence of malaria increased between 2011 and 2015 in the central region of Burkina Faso. For each year of the study, 3 periods of malaria transmission were identi-fied: all 3 periods were associated with relatively stable hotspots located in a similar environment (dams). The hotspots detected during the LTPs had a higher inci-dence of malaria. Future studies should investigate these hotspots to uncover the local environmental and behav-ioural factors of transmission, as this would allow for the development of better-targeted control strategies. For this purpose, a real-time monitoring system should be implemented based on the existing national monitoring system.
Abbreviations
ACT : artemisinin‑based combination therapy; ARIMA: seasonal auto‑regressive integrated moving average; GAM: general additive model; GPS: global positioning system; HAs: health areas; HTP: high transmission period; ITP: intermediate transmission period; LLIN: long‑lasting insecticide net; LTP: low transmission period; PCA: principal component analysis; PELT: pruned exact linear time; RDT: rapid diagnostic test; RR: risk ratio; SMC: seasonal malaria chemoprevention; TLOH: Télégramme Lettre Officiel Hebdomadaire; WHO: World Health Organization.
Authors’ contributions
BO, YI and JG designed the study, performed data validation and cleaning, analysed the data, and wrote the first draft of the manuscript; JCD contributed to the interpretation of the results and to the writing of the manuscript; AK, PY, EKO, YS, and LSLWO contributed to data collection, to data validation, and to the writing of the manuscript; KS, SD, RT, TR, and VH contributed to statisti‑ cal analysis, to data interpretation, and to the writing of the manuscript. All authors read and approved the final manuscript.
Author details
1 Aix Marseille Univ, INSERM, IRD, SESSTIM UMR1252 Sciences Economiques
& Sociales de la Santé & Traitement de l’Information Médicale, Marseille, France. 2 Embassy of Japan in the Republic of Guinea, Conakry, Guinea. 3 Prospective et Coopération, Laboratoire d’Idées, Bureau d’Etudes Recherche,
Marseille, France. 4 Ecole des Hautes Etudes en Santé Publique, Rennes, France. 5 Université libre de Bruxelles, EPS, Centre de Recherche en Epidémiologie,
Biostatistique et Recherche Clinique, Brussels, Belgium. 6 IRSS‑Clinical Research
Unit of Nanoro (IRSS‑CRUN), Nanoro, Burkina Faso. 7 IRD, UMR 228 ESPACE‑DEV,
Station SEAS‑OI, Saint‑Pierre, France. 8 Programme National de Lutte contre
le Paludisme, Ministère de la Santé, Ouagadougou, Burkina Faso. 9 Direction
Régionale de la Santé du Centre, Ministère de la Santé, Ouagadougou, Burkina Faso. 10 Direction de la Météorologie, Ministère des Transports, Ouagadougou,
Burkina Faso.
Acknowledgements
The authors would like to thank the staff of health information and epide‑ miological surveillance centers of the five health districts (central region).
Additional files
Additional file 1. First and second meteorological components derived from the PCA.
Additional file 2. Malaria transmission period (low, high, intermediate) by year and season. Malaria incidence (/10,000 person‑weeks) is presented for each year and season (dry/hot, rainy, dry/cold) from 2011 to 2015.
The authors are also grateful to the Chief Medical Officers for facilitating exchanges, and particularly, the health district of Baskuy for facilitating the study. The authors also acknowledge to meteorological service actors who collected and transmitted meteorological data, particularly Dr. Waongo Moussa.
Competing interests
The authors declare that they have no competing interests.
Availability of data and materials
The datasets used and/or analysed during the current study are available from the corresponding author on reasonable request.
Consent for publication
Not applicable.
Ethics approval and consent to participate
Not applicable.
Funding
This work was carried out thanks to the support of the A*MIDEX Grant (n°ANR‑ 11‑IDEX‑0001‑02) funded by the French Government Investissements d’Avenir programme). This work was also supported by OpenHealth Institut, the French NGO Prospective & Cooperation and by the AMMA Consortium (African Monsoon Multidisciplinary Analyses). None of the 3 funding organizations influenced the design, analysis or interpretation of the work.
Publisher’s Note
Springer Nature remains neutral with regard to jurisdictional claims in pub‑ lished maps and institutional affiliations.
Received: 13 November 2017 Accepted: 21 March 2018
References
1. Ministère de la santé. Annuaire statistique 2015. Direction générale des études et des statistiques sectorielles. 2016. http://www.sante .gov.bf/ index .php?optio n=com_edocm an&view=docum ent&id=113&catid =7&Itemi d=1123. Accessed 10 Jan 2017.
2. Tiono AB, Kangoye DT, Rehman AM, Kargougou DG, Kaboré Y, Diarra A, et al. Malaria incidence in children in south‑west Burkina Faso: comparison of active and passive case detection methods. PLoS ONE. 2014;9:e86936.
3. WHO. Global Malaria Programme. Global technical strategy for malaria, 2016–2030. Geneva: World Health Organization; 2015. http://www.who. int/malar ia/publi catio ns/atoz/97892 41564 991/en/. Accessed 8 Feb 2017. 4. Yukich J, Bennett A, Yukich R, Stuck L, Hamainza B, Silumbe K, et al.
Estimation of malaria parasite reservoir coverage using reactive case detection and active community fever screening from census data with rapid diagnostic tests in southern Zambia: a re‑sampling approach. Malar J. 2017;16:137.
5. Bousema T, Stresman G, Baidjoe AY, Bradley J, Knight P, Stone W, et al. The impact of hotspot‑targeted interventions on malaria transmission in Rachuonyo South District in the western Kenyan highlands: a cluster‑ randomized controlled trial. PLoS Med. 2016;13:e1001993.
6. Mogeni P, Williams TN, Omedo I, Kimani D, Ngoi JM, Mwacharo J, et al. Detecting malaria hotspots: a comparison of rapid diagnostic test, microscopy, and polymerase chain reaction. J Infect Dis. 2017;216:1091–8. 7. Larsen DA, Ngwenya‑Kangombe T, Cheelo S, Hamainza B, Miller J, Winters A, et al. Location, location, location: environmental factors better predict malaria‑positive individuals during reactive case detection than index case demographics in Southern Province, Zambia. Malar J. 2017;16:18. 8. Mogeni P, Omedo I, Nyundo C, Kamau A, Noor A, Bejon P, et al. Effect of
transmission intensity on hotspots and micro‑epidemiology of malaria in sub‑Saharan Africa. BMC Med. 2017;15:121.
9. Ministère de la Santé. Directives nationales pour la prise en charge du paludisme dans les formations sanitaires du Burkina Faso. 2010. http:// pdf.usaid .gov/pdf_docs/PA00J PHB.pdf. Accessed 2 Aug 2017.
10. Arab A, Jackson MC, Kongoli C. Modelling the effects of weather and climate on malaria distributions in West Africa. Malar J. 2014;13:126. 11. Ministère de la Santé. Lutte contre le paludisme au Burkina Faso: la campagne de la chimio‑prévention du paludisme saisonnier (CPS) lancée. 2016. http://www.sante .gov.bf/index .php?optio n=com_conte nt&view=artic le&id=307:cps‑2&catid =87&Itemi d=1075. Accessed 8 Feb 2017.
12. Baragatti M, Fournet F, Henry M‑C, Assi S, Ouedraogo H, Rogier C, et al. Social and environmental malaria risk factors in urban areas of Ouaga‑ dougou, Burkina Faso. Malar J. 2009;8:13.
13. Sissoko MS, van den Hoogen LL, Samake Y, Tapily A, Diarra AZ, Coulibaly M, et al. Spatial patterns of Plasmodium falciparum clinical incidence, asymptomatic parasite carriage and anopheles density in two villages in Mali. Am J Trop Med Hyg. 2015;93:790–7.
14. Espié E, Diene Sarr F, Diop F, Faye J, Richard V, Tall A, et al. Spatio‑ temporal variations in malaria incidence in children less than 10 years old, Health District of Sokone, Senegal, 2010–2013. PLoS ONE. 2015;10:e0137737.
15. Bousema T, Griffin JT, Sauerwein RW, Smith DL, Churcher TS, Takken W, et al. Hitting hotspots: spatial targeting of malaria for control and elimination. PLoS Med. 2012;9:e1001165.
16. Ruktanonchai NW, DeLeenheer P, Tatem AJ, Alegana VA, Caughlin TT, Zu Erbach‑Schoenberg E, et al. Identifying malaria transmission foci for elimination using human mobility data. PLoS Comput Biol. 2016;12:e1004846.
17. Nkumama IN, O’Meara WP, Osier FHA. Changes in malaria epidemiol‑ ogy in Africa and new challenges for elimination. Trends Parasitol. 2017;33:128–40.
18. Premier Ministère. Carte sanitaire du Burkina Faso. Conseil National de la Statistique du Burkina Faso. 2010. http://www.cns.bf/IMG/pdf/carte _sanit aire_2010.pdf. Accessed 10 Jan 2017.
19. Jere S, Moyo E. Modelling epidemiological data using Box–Jenkins proce‑ dure. Open J Stat. 2016;06:295–302.
20. Metcalfe AV, Cowpertwait PSP. Introductory time series with R. New York: Springer; 2009.
21. Shumway RH, Stoffer DS. Time series analysis and its applications. 3rd ed. Cham: Springer International Publishing; 2011.
22. Wood S. Generalized additive models: an introduction with R. 1st ed. Boca Raton: Chapman & Hall/CRC; 2006.
23. Killick R, Eckley I. changepoint: an R package for changepoint analysis. J Stat Softw. 2014;58:1–19.
24. Gaudart J, Giorgi R, Poudiougou B, Touré O, Ranque S, Doumbo O, et al. Détection de clusters spatiaux sans point source prédéfini: utilisation de cinq méthodes et comparaison de leurs résultats. Rev Epidemiol Santé Publique. 2007;55:297–306.
25. Brain WRB, Walton JN, editors. Brain’s diseases of the nervous system. 10th ed. Oxford: Oxford University Press; 1993.
26. Teklehaimanot HD, Lipsitch M, Teklehaimanot A, Schwartz J. Weather‑ based prediction of Plasmodium falciparum malaria in epidemic‑prone regions of Ethiopia I. Patterns of lagged weather effects reflect biological mechanisms. Malar J. 2004;3:41.
27. Adimi F, Soebiyanto RP, Safi N, Kiang R. Towards malaria risk prediction in Afghanistan using remote sensing. Malar J. 2010;9:125.
28. Abeku T, De Vlas SJ, Borsboom GJ, Tadege A, Gebreyesus Y, Gebreyo‑ hannes H, et al. Effects of meteorological factors on epidemic malaria in Ethiopia: a statistical modelling approach based on theoretical reasoning. Parasitology. 2004;128:585–93.
29. Devi NP, Jauhari RK. Relationship between Anopheles fluviatilis & A. stephensi (Diptera: Culicidae) catches & the prevalence of malaria cases at Kalsi area in Dehradun District (Uttaranchal). Indian J Med Res. 2006;123:151–8.
30. Coulibaly D, Travassos MA, Tolo Y, Mattew BL, Abdoulaye KK, Karim T, et al. Spatio‑temporal dynamics of asymptomatics malaria: bridging the gap between annual malaria resurgences in a Sahelian environment. Am J Trop Med Hyg. 2017;97:1761–9.
31. Pascual M, Cazelles B, Bouma MJ, Chaves LF, Koelle K. Shifting patterns: malaria dynamics and rainfall variability in an African highland. Proc Biol Sci. 2008;275:123–32.
32. Gaudart J, Touré O, Dessay N, Dicko AL, Ranque S, Forest L, et al. Model‑ ling malaria incidence with environmental dependency in a locality of Sudanese savannah area, Mali. Malar J. 2009;8:61.
• We accept pre-submission inquiries
• Our selector tool helps you to find the most relevant journal
• We provide round the clock customer support
• Convenient online submission
• Thorough peer review
• Inclusion in PubMed and all major indexing services
• Maximum visibility for your research Submit your manuscript at
www.biomedcentral.com/submit
Submit your next manuscript to BioMed Central
and we will help you at every step:
33. Gomez‑Elipe A, Otero A, Van Herp M, Aguirre‑Jaime A. Forecasting malaria incidence based on monthly case reports and environmental factors in Karuzi, Burundi, 1997–2003. Malar J. 2007;6:129.
34. Patz JA, Strzepek K, Lele S, Hedden M, Greene S, Noden B, et al. Predicting key malaria transmission factors, biting and entomological inocula‑ tion rates, using modelled soil moisture in Kenya. Trop Med Int Health. 1998;3:818–27.
35. Silue KD, Raso G, Yapi A, Vounatsou P, Tanner M, N’Goran EK, et al. Spatially‑explicit risk profiling of Plasmodium falciparum infections at a small scale: a geostatistical modelling approach. Malar J. 2008;7:111. 36. Zhou G, Minakawa N, Githeko AK, Yan G. Association between climate
variability and malaria epidemics in the East African highlands. Proc Natl Acad Sci USA. 2004;101:2375–80.
37. Paaijmans KP, Read AF, Thomas MB. Understanding the link between malaria risk and climate. Proc Natl Acad Sci USA. 2009;106:13844–9. 38. Peterson I, Borrell LN, El‑Sadr W, Teklehaimanot A. A temporal–spatial
analysis of malaria transmission in Adama, Ethiopia. Am J Trop Med Hyg. 2009;81:944–9.
39. Christiansen‑Jucht C, Parham PE, Saddler A, Koella JC, Basáñez M‑G. Tem‑ perature during larval development and adult maintenance influences the survival of Anopheles gambiae s.s. Parasit Vectors. 2014;7:489. 40. Abiodun GJ, Maharaj R, Witbooi P, Okosun KO. Modelling the influence
of temperature and rainfall on the population dynamics of Anopheles arabiensis. Malar J. 2016;15:364.
41. Murdock CC, Sternberg ED, Thomas MB. Malaria transmission potential could be reduced with current and future climate change. Sci Rep. 2016;6:27771.
42. Colón‑González FJ, Tompkins AM, Biondi R, Bizimana JP, Namanya DB. Geospatial health 11(1s) 2016: healthy future. Assessing the effects of air temperature and rainfall on malaria incidence: an epidemiological study across Rwanda and Uganda. 2016. http://www.geosp atial healt h.net/ index .php/gh/artic le/view/379/436. Accessed 28 Apr 2017. 43. Vezenegho SB, Carinci R, Gaborit P, Issaly J, Dusfour I, Briolant S, et al.
Anopheles darlingi (Diptera: Culicidae) dynamics in relation to mete‑ orological data in a cattle farm located in the coastal region of French Guiana: advantage of mosquito magnet trap. Environ Entomol. 2015;44:454–62.
44. Parham PE, Pople D, Christiansen‑Jucht C, Lindsay S, Hinsley W, Michael E. Modeling the role of environmental variables on the population dynamics of the malaria vector Anopheles gambiae sensu stricto. Malar J. 2012;11:271.
45. Al‑Mansoob MAK, Al‑Mazzah MM. The role of climate on malaria inci‑ dence rate in four governorates of Yemen. Med J Malaysia. 2005;60:349. 46. Kabore AV. sidwaya. Les maladies de l’harmattan. 2003. http://www.sante
tropi cale.com/Actua lites /0103/actua lites %20010 3_2.htm. Accessed 14 Sep 2017.
47. Ouédraogo AL, Gonçalves BP, Gnémé A, Wenger EA, Guelbeogo MW, Ouédraogo A, et al. Dynamics of the human infectious reservoir for malaria determined by mosquito feeding assays and ultrasensitive malaria diagnosis in Burkina Faso. J Infect Dis. 2016;213:90–9. 48. Girond F, Randrianasolo L, Randriamampionona L, Rakotomanana F,
Randrianarivelojosia M, Ratsitorahina M, et al. Analysing trends and fore‑ casting malaria epidemics in Madagascar using a sentinel surveillance network: a web‑based application. Malar J. 2017;16:72.
49. Coulibaly D, Rebaudet S, Travassos M, Tolo Y, Laurens M, Kone AK, et al. Spatio‑temporal analysis of malaria within a transmission season in Bandiagara, Mali. Malar J. 2013;12:82.
50. Gaudart J, Poudiougou B, Dicko A, Ranque S, Toure O, Sagara I, et al. Space–time clustering of childhood malaria at the household level: a dynamic cohort in a Mali village. BMC Public Health. 2006;6:286. 51. Kulldorff M. SaTScan user guide for version 9.5; 2018. https ://www.satsc
an.org/cgi‑bin/satsc an/regis ter.pl/SaTSc an_Users _Guide .pdf?todo=proce ss_userg uide_downl oad. Accessed 9 Feb 2018.
52. Kulldorff M, Nagarwalla N. Spatial disease clusters: detection and infer‑ ence. Stat Med. 1995;14:799–810.
53. Block R. Software review: scanning for clusters in space and time: a tuto‑ rial review of SaTScan. Soc Sci Comput Rev. 2007;25:272–8.
54. Jacquez GM, Greiling DA. Local clustering in breast, lung and colorectal cancer in Long Island, New York. Int J Health Geogr. 2003;2:3. 55. Guttmann A, Li X, Feschet F, Gaudart J, Demongeot J, Boire JY, et al.
Cluster detection tests in spatial epidemiology: a global indicator for performance assessment. PLoS ONE. 2015;10:e0130594.
56. Guttmann A, Li X, Gaudart J, Gérard Y, Demongeot J, Boire JY, et al. Spatial heterogeneity of type I error for local cluster detection tests. Int J Health Geogr. 2014;13:15.
57. Guttmann A, Ouchchane L, Li X, Perthus I, Gaudart J, Demongeot J, et al. Performance map of a cluster detection test using extended power. Int J Health Geogr. 2013;12:47.
58. Yewhalaw D, Legesse W, Van Bortel W, Gebre‑Selassie S, Kloos H, Ducha‑ teau L, et al. Malaria and water resource development: the case of Gilgel‑ Gibe hydroelectric dam in Ethiopia. Malar J. 2009;8:21.
59. Kibret S, Lautze J, Boelee E, McCartney M. How does an Ethiopian dam increase malaria? Entomological determinants around the Koka reservoir. Trop Med Int Health. 2012;17:1320–8.
60. Erhart A, Thang ND, Van Ky P, Tinh TT, Van Overmeir C, Speybroeck N, et al. Epidemiology of forest malaria in central Vietnam: a large scale cross‑ sectional survey. Malar J. 2005;4:58.
61. Sharma SK, Tyagi PK, Padhan K, Upadhyay AK, Haque MA, Nanda N, et al. Epidemiology of malaria transmission in forest and plain ecotype villages in Sundargarh District, Orissa, India. Trans R Soc Trop Med Hyg. 2006;100:917–25.