HAL Id: hal-03047117
https://hal.archives-ouvertes.fr/hal-03047117
Submitted on 16 Dec 2020HAL is a multi-disciplinary open access archive for the deposit and dissemination of sci-entific research documents, whether they are pub-lished or not. The documents may come from teaching and research institutions in France or abroad, or from public or private research centers.
L’archive ouverte pluridisciplinaire HAL, est destinée au dépôt et à la diffusion de documents scientifiques de niveau recherche, publiés ou non, émanant des établissements d’enseignement et de recherche français ou étrangers, des laboratoires publics ou privés.
section
Julien Charreau, Jerome Lave, Christian France-Lanord, Nicolas Puchol, P.H.
Blard, Raphaël Pik, Ananta Prasad Gajurel, Maurice Arnold, Georges
Aumaitre, D.L. Bourles, et al.
To cite this version:
Julien Charreau, Jerome Lave, Christian France-Lanord, Nicolas Puchol, P.H. Blard, et al.. A 6 Ma record of palaeodenudation in the central Himalayas from in situ cosmogenic 10 Be in the Surai section. Basin Research, Wiley, inPress, �10.1111/bre.12511�. �hal-03047117�
A 6 Ma record of palaeodenudation in the central Himalayas from in situ cosmogenic 10Be in the Surai section
Journal: Basin Research Manuscript ID BRE-032-2020.R1 Manuscript Type: Original Article Date Submitted by the
Author: n/a
Complete List of Authors: Charreau, Julien; Université de Lorraine-CNRS, CRPG UMR 7358 Lavé, Jérôme; Université de Lorraine-CNRS, CRPG UMR 7358
France-Lanord, Christian; Université de Lorraine-CNRS, CRPG UMR 7358 Puchol, Nicolas; Université de Lorraine-CNRS, CRPG UMR 7358
Blard, Pierre-Henri; Université de Lorraine-CNRS, CRPG UMR 7358 Pik, Raphael; Université de Lorraine-CNRS, CRPG UMR 7358
Gajurel, Ananta Prasad ; Tribhuvan University, Department of Geology ASTER Team, ASTER Team; Aix-Marseille Université, CEREGE-CNRS-IRD-Collège de France-INRAE
1
A 6 Ma record of palaeodenudation
2
in the central Himalayas
3
from in situ cosmogenic
10Be in the Surai section
4
5 Julien Charreau1*, Jérôme Lavé1, Christian France-Lanord1, Nicolas Puchol1, Pierre-Henri Blard1, Raphaël 6 Pik1, Ananta Prasad Gajurel2 and ASTER Team3,+
7
8 1. CRPG, UMR7358, Université de Lorraine - CNRS, 15 rue Notre-Dame des pauvres, 54500 9 Vandoeuvre-lès-Nancy, France
10 2. Department of Geology, Tribhuvan University, Kathmandu, Nepal
11 3. Aix-Marseille Université, CNRS-IRD-Collège de France-INRAE, UM 34 CEREGE, Technopôle de 12 l’Environnement Arbois-Méditerranée, BP80, 13545 Aix-en-Provence, France
13 + Maurice Arnold, Georges Aumaître, Didier L Bourlès, Karim Keddadouche. 14
15 *corresponding author: julien.charreau@univ-lorraine.fr 16
17 Key word: Himalaya, cosmogenic 10Be, palaeodenudation rates, late Neogene
18
19
Abstract
20 To better constrain late Neogene denudation of the Himalayas, we analysed in situ 10Be concentrations in 21 17 Neogene sediment samples of the Surai section (central Nepal) and two modern sediment samples of the Rapti 22 River. We first refined the depositional ages of the Surai section from 36 new paleomagnetic analyses, five 23 26Al/10Be burial ages, and, based on the Dynamic Time Warping algorithm, 104 automatically calculated likely
24 magnetostratigraphic correlations. We also traced changing sediment sources using major element and Sr-Nd
25 isotopic data, finding at 4-3 Ma a switch from a large, trans-Himalayan river to a river draining only the Lesser
26 Himalaya and Siwalik piedmont, increasing the contribution of recycled sediments at that time. 10Be concentrations
27 in Neogene sediments range from (1.00 ± 0.36) to (5.22 ± 0.98) 103 at g–1 and decrease with stratigraphic age. 28 Based on a flood plain transport model, our refined age model, and assuming a drainage change at 4-3 Ma, we 29 reconstructed 10Be concentrations at the time of deposition. Assuming cosmogenic production rates similar to those 30 of the modern basins, we calculated palaeodenudation rates of 0.9 ± 0.5 to 3.9 ± 2.7 mm a–1 from ~6 to ~3 Ma in 31 the palaeo-Karnali basin and 0.6 ± 0.2 to 1.6 ± 0.8 mm a–1 since ~3 Ma in the palaeo-Rapti basin. Given the 32 uncertainties and similar modern values of ~2 mm a–1, the palaeo-Karnali denudation rates may have been steady 33 at ~1.7 ± 0.3 mm a–1 for the last ~6 Ma. A transient acceleration of the denudation in the palaeo-Rapti basin of 34 ~1.5 mm a–1 since ~1.5 Ma was likely due to the reworking of older, 10Be-depleted Siwalik sediments in the 35 foreland. If true, this steadiness of the denudation rates may suggest that Quaternary glaciations did not largely 36 affect Himalayan denudation.
37 38
39
1. Introduction
40 The denudation history of the Himalayas, the largest and highest mountain range in the world, remains 41 controversial, precluding a strong understanding of how this large mountain range grew. Sediment budget from 42 basins surrounding the Himalayas are difficult to reconstruct because the depositional areas are very large, 43 including the Ganga basin and the Indus and Bengal fans. Moreover, it is not straightforward to accurately assess 44 both the complex geometry and chronology of sediment infilling in these locations. Consequently, published 45 Cenozoic Himalayan sedimentary budgets have yielded inconsistent constrains (e.g. Burbank et al., 1993; Clift, 46 2006; Métivier et al., 1999). For example, according to Métivier et al. (1999) the average accumulation rates curve
47 for Asian sedimentary basins increased quickly in an exponential manner from 0.5x10⁶ km3 Ma-1 in the Oligocene
48 to their maximum values >1.5x10⁶ km3 Ma-1 in the Quaternary. Clift (2006) reported an increase in sedimentation
49 rate from <20 to ~100-120x103 km3.Ma-1 from 50 to ~15Ma, then a drop between ~15 and ~10 Ma followed by a
50 new acceleration until the Quaternary where sedimentation rates reached precedent early Miocene values.
51 Similarly, thermochonological studies have brought contrasted constraints on the late Cenozoic evolution 52 of Himalayan denudation. The interpretation of the in situ bedrock thermochronological ages (Herman et al., 2013; 53 Huntington et al., 2006) suggest that the denudation rates along the Himalayan arc increased by a factor of 1 to 4 54 during the Quaternary, which some ascribe to an increased climatic, not tectonic, forcing. However, the denudation 55 history is spatially variable across the range, and some regions, e.g., Bhutan, are characterized by lower denudation 56 rates during the last 6–8 Ma (Adams et al., 2015; Thiede and Ehlers, 2013). Similarly, thermochronological 57 analyses of detrital grains in molasse sediments deposited at the Himalayan front suggest either quite stable basin-58 averaged denudation rates since the mid-Miocene in central Nepal (Bernet et al., 2006; Harrison et al., 1993; Szulc 59 et al., 2006; van der Beek et al., 2006) or a rapid acceleration of the denudation around 5Ma in the eastern
60 Himalayan syntaxis (Lang et al., 2016). Notably, however, this thermochronological technique averages
61 denudation rates over timescales of a few million years, possibly smoothing and offsetting rapid changes related, 62 for example, to climate.
63 An alternative method to reconstruct denudation histories of a mountain range is to reconstruct basin
64 average paleodenudation rates from the measurement of in situ cosmogenic nuclides (e.g., 10Be) in ancient (>1
65 Ma) river sediments (Charreau et al., 2011; Puchol et al., 2017). Cosmogenic nuclide concentrations in river sands 66 average the concentrations in all surficial rocks outcropping in the drainage basin (e.g. Brown et al., 1995). When 67 measured in ancient sediments, cosmogenic nuclides average the palaeodenudation rates of the drainage basin at 68 the time of deposition (Charreau et al., 2011; Puchol et al., 2017; Refsnider, 2010; Schaller et al., 2002). This 69 approach is advantageous as it averages denudation rates over short characteristic timescales, typically <5 ka for 70 denudation rates larger than 0.1 mm a–1.
71 Here, to reconstruct past Himalayan denudation rates, we analysed in situ 10Be concentrations in Neogene 72 sediments sampled from the Surai section (Fig. 1), a well-documented stratigraphic section in the piedmont 73 covering the last 6 Ma. The section has been dated by magnetostratigraphy (Appel et al., 1991; Ojha et al., 2009; 74 Rosler et al., 1997) and biostratigraphy (Corvinus and Rimal, 2001). Moreover, during recent decades, it has been 75 extensively studied through geochemical (Huyghe et al., 2001; Szulc et al., 2006), mineralogical (Szulc et al., 76 2006), and thermochronological studies (Bernet et al., 2006; Szulc et al., 2006; van der Beek et al., 2006). These 77 data are key to tracing changes in sediment provenance, which are needed to estimate the cosmogenic production
79
80
2. Geological Setting
81 2.1 Geology of the Himalayas
82 The geology of the Himalayan arc in Nepal is traditionally divided into five main units from north to 83 south: the Thetyan Sedimentary Series (TSS), the Higher Himalaya Crystalline unit (HHC), the Lesser Himalaya
84 unit (LH), the Siwalik folded molasse, and the foreland basin of the Ganga plain (Fig. 1). These units are separated
85 by four major faults (Gansser, 1964): from north to south, the Southern Tibetan Detachment (STD), the Main 86 Central Thrust (MCT), the Main Boundary Thrust (MBT), and the Main Frontal Thrust (MFT). Along the Southern 87 Tibetan plateau, the TSS comprises Mesozoic and Palaeozoic marine sediments and medium- to low-grade 88 metamorphic rocks. The HHC comprises high-grade crystalline metamorphic units. Both formations are intruded 89 by Miocene leucogranites and form the highest relief of the Nepalese Himalaya. To the south, the HHC units 90 overthrust the LH at the MCT level and occur as two major klippen in western Nepal. The LH series comprises 91 low-grade Precambrian detrital continental meta-sediments and Cretaceous to Eocene marine sediments; it 92 represents an intermediate midland relief between the higher relief of the HHC to the north and the Siwalik Hills 93 to the south, the first significant relief at the foot of the Himalayas (Figs. 1 and 2a).
94
95 2.2 The Siwalik Hills
96 The Siwalik Hills, bounded to the north by the MBT and to the south by the MFT (Figs. 1, 2a and 2b), 97 comprise successive fold and thrust belts oriented WNW-ESE along the Himalayas (Auden, 1935). The Siwalik 98 Hills do not exceed 1,000 m elevation and comprise a thick (>5 km) pile of Neogene molasse produced by several 99 million years of intense denudation in the Himalayas (DeCelles et al., 1998; Hérail and Mascle, 1980).
100 How the sediments are currently deposited in the modern Ganga plain provides useful information to
101 understand the palaeoenvironmental setting in which the Siwalik sediments formed (e.g. Sinha et al., 2005). At 102 the very front of the Himalayas, in the Ganga plain, sediments are deposited on a series of large alluvial megafans 103 (104–105 km2) associated with trans-Himalayan rivers that drain the Himalayas from the lowland piedmont to the
104 high elevated regions (Fig. 1) (DeCelles et al., 1998; Gupta, 1997). These megafans alternate with smaller interfans
105 associated with smaller rivers originating in the Lesser Himalaya (Fig. 1) (DeCelles et al., 1998; Gupta, 1997; 106 Wells and Dorr, 1977). Although the facies and origins of the Siwalik sediments vary considerably along the strike 107 of the >2,000-km-long range, these molasse, mainly of continental origin, are usually stratigraphically divided into 108 three litho-stratigraphic units (DeCelles et al., 1998; Dhital et al., 1995) namely the Lower, the Middle and the 109 Upper Siwaliks and showing an upward coarsening related to the progressive southward migration of the 110 Himalayan thrust wedge and depositional facies (Dubille and Lavé, 2015; Lyon-Caen and Molnar, 1985). 111
112 2.3 The Surai section
113 The Surai section is in the southern part of western-central Nepal, ~5 km to the southeast of the town 114 Bhalubang (Figs. 2a, b). In this area, Siwalik sediments are folded into a ~750-m-high, >100-km-long ridge 115 developed on the hanging wall of the MFT, the so-called Dundwa ridge, which is progressively propagating to the 116 west. A piggy-back basin has developed to the north of the Dundwa ridge, in which the West Rapti River (not to 117 be confused with the East Rapti River, a tributary of the Narayani River) deviates to the West (Figs. 1 and 2). The 118 Surai Khola, which drains the most southern segment of the Siwaliks into the Ganga plain (Fig. 2b), has deeply
119 incised the uplifting Dundwa ridge. Construction of the 19-km-long RH01 road between Chanauta and Bhalubang 120 between 1983 and 1986 exposed a nearly continuous >5,000-m-thick section of outcrops of Siwalik sediments 121 dipping to the north at 60–70° (Fig. 2d). This section, the ‘Surai section’, has enabled dense palaeomagnetic 122 sampling for magnetostratigraphic analyses, which have roughly constrained the depositional ages of the Lower 123 and Middle Siwaliks groups to ~14–10 Ma and 10–4 Ma, respectively (Appel et al., 1991; Corvinus and Rimal, 124 2001; Ojha et al., 2009; Rosler et al., 1997; Rosler and Appel, 1998). However, some ambiguities and uncertainties 125 persist for the upper, coarser part of the section that is less amenable to palaeomagnetic sampling. The depositional 126 ages of the top of the section are hence more loosely constrained between 4 and 1.5 Ma.
127 Building on this chronology, the Surai section has been intensively examined by palaeontological 128 (Corvinus and Rimal, 2001), sedimentological (DeCelles et al., 1998; Dhital et al., 1995; Nakayama and Ulak, 129 1999), sediment provenance (DeCelles et al., 1998; Szulc et al., 2006), geochemical (Huyghe et al., 2001; Lupker 130 et al., 2012b; Szulc et al., 2006), and thermochronological studies (Bernet et al., 2006; Szulc et al., 2006; van der 131 Beek et al., 2006). The section consists mainly of fluvial sediments that gradually coarsen upward, and includes 132 the Upper, Middle, and Lower Siwaliks groups (Fig. 2), which have been subdivided from bottom to top into the 133 Bankas, Chor Khola, Surai Khola, Dobatta, and Dan Khola local formations (Corvinus and Rimal, 2001; Dhital et 134 al., 1995; Nakayama and Ulak, 1999). Sedimentological facies associations reveal that the depositional 135 environmental changed from a small meandering river channel to a larger braided river channel around 10–6 Ma 136 (DeCelles et al., 1998; Nakayama and Ulak, 1999). Upsection, the river remained braided, but evolved from a 137 sand- to a gravel-dominated system in the middle of the Dhan Khola formation (Fig. 4) (Nakayama and Ulak, 138 1999). Most palaeocurrents measured along the section suggest that the riverflowed toward the south (DeCelles 139 et al., 1998; Szulc et al., 2006), led DeCelles et al. (1998) to conclude that the sediment source was persistently to 140 the north; they excluded the possibility of syntectonic sedimentation by local rivers draining the uplifting Dundwa 141 ridge itself. However, palaeocurrent directions in the Upper Siwaliks group exhibit more scatter than down section 142 (DeCelles et al., 1998), suggesting the possible contribution of local tributaries. Based on provenance data,
143 DeCelles et al. (1998) further suggested that the river that deposited the upper and middle Surai section was similar 144 to present trans-Himalayan rivers. It is, however, difficult from the sedimentological record alone to discriminate 145 between a large river draining the internal part of the range and smaller interfan rivers draining only the Lesser
146 Himalaya.
147 The mineralogical, isotopic, and/or geochemical compositions of the sediments in the Surai section reveal 148 further details of their source rocks. Several tracers suggest that the exhumation of the LH began ~12 Ma and has 149 remained a significant source of sediment in the area (DeCelles et al., 1998; Huyghe et al., 2001; Szulc et al., 150 2006). High-grade metamorphic minerals present in the section suggest that the palaeo-Rapti River has likely also 151 continuously eroded HHC rocks (Szulc et al., 2006), although the exact source remains ambiguous due to the 152 presence of the HHC klippe thrust over the midland and LH (Fig. 2). Therefore, these petrologic data only constrain 153 that the palaeo-drainage basin has always reached, at least, the HHC klippe (Fig. 2). Importantly, it remains 154 uncertain whether the river drained the entire Himalayas or only the Lesser Himalaya.
155
156
3. Methods and sampling
158 To document palaeodenudation rates in the Surai section, we measured the bulk 10Be concentrations (at 159 g–1, see section 3.2) of Siwalik sediments exposed along the Surai section (𝑁 ). The basin-averaged denudation
total
160 rate is calculated from 𝜀 𝑁total by solving the equation (e.g. Charreau et al., 2011; Puchol et al., 2017):
161 𝑁total= 𝑒―𝜆𝑡
[
∑𝑗 = 1,3 (1) 𝑃𝑗𝜀 𝜌r 𝛬𝑗
+ 𝑁fp
]
+ 𝑁recent162 where is the overall palaeoproduction rate of 𝑃 10Be averaged over the drainage basin at the time of erosion, which
𝑗
163 accounts for all cosmogenic production mechanisms (spallation, ‘n’, and slow and fast muons, ‘µs’ and ‘µf’, 164 respectively, indicated by j = 1–3), is the density of the denuded rocks (taken as 2.7 g cm𝜌 –3), λ the radioactive
r
165 decay constant, the characteristic attenuation lengths of the cosmogenic production mechanisms (Λ𝛬𝑗 n = 160 g 166 cm–2, Λ
µs = 1,500 g cm–2, and Λµf = 4,320 g cm–2) (Braucher et al., 2011), and t the time at which the sediments 167 were buried (i.e., the depositional age). 𝑁 and are the number of 10Be atoms (per g of quartz) accumulated
fp 𝑁recent
168 by the sediments during their transport and final deposition in the Ganga plain (i.e., until buried deep enough to 169 be fully shielded from cosmic rays) and during their most recent exposure in outcrop, respectively.
170 Several corrections and assumptions are required (Charreau et al., 2011; Puchol et al., 2017) to derive 171 palaeodenudation rates from the measured 10Be concentrations along the Surai section. First, we assumed 𝑁
recent
172 to be negligible because of the recent road cut (Fig. 2) and the high erosion rates expected in the Siwalik hills
173 (Hurtrez et al., 1999; Lavé and Avouac, 2000). Then, solving equation (1) requires precise knowledge of the
174 depositional ages t, especially to correct the measured concentrations for radioactive decay. To this aim, we refined 175 the depositional ages of the Surai section, especially in the upper part of the section, using new palaeomagnetic 176 analyses, stochastic magnetostratigraphic correlations (Lallier et al., 2013), and 26Al/10Be cosmogenic burial dating 177 (e.g., Granger and Muzikar, 2001; see section 3.3). We also estimated the contribution of 𝑁fp during sediment 178 transfer in the foreland plain and after its definitive burial in the plain, i.e. after its burial below the depth of
179 potential sediment remobilisation induced by the migration of the channel into its floodplain (section 3.4). The
180 cosmogenic palaeoproduction rates P at the time of deposition are mainly controlled by the distribution of 181 elevations in the drainage basin. Therefore, we reconstructed in detail the sediment sources and their evolution 182 through time using geochemical records, including new major and trace element and Sr-Nd isotopic analyses 183 (section 3.5).
184 The cosmogenic production rates were estimated using the Basinga GIS Tool (Charreau et al., 2019) (Sup. 185 Info.) and the topography of modern drainage basins expected to be like the past drainage basins. Indeed,H and 186 O isotopic analyses suggest that the topography of the northern Himalayas has remained similar since the early 187 Miocene (Gébelin et al., 2013). Sediment provenance analyses also suggest that the drainage systems of several 188 Himalayan rivers (Yamuna, Ganga, Tinau, Karnali) have remained steady during the late Cenozoic (Mandal et al., 189 2019; Szulc et al., 2006). Our calculation excludes corrections for snow and glacial shielding (see Supplementary
190 Material for justifications) meaning that the derived denudation rates must be considered as maximum values. The
191 uncertainties on paleo-denudation rates were calculated using a Monte-Carlo simulation similar to Puchol et al.
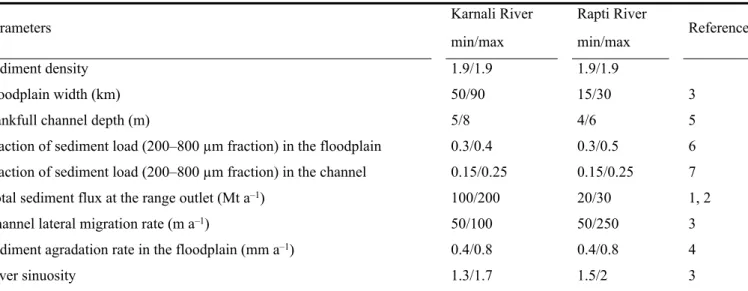
192 (2017). This approach explores conservatively the range of all the input parameters (Table A) to provides an
193 efficient and accurate determination of the uncertainty attached to the calculated paleo–denudation rates.
194
196 Seventeen samples of typically medium to coarse sandstone were collected from the Surai section for 197 10Be analyses (Fig. 2c). Sampling locations were selected at maximum at the bottom of 10-20m high cliffs to 198 minimize possible post burial recent exposures (Fig. 2c and d). We collected samples at maximum at the base of
199 paleo-channel to ensure rapid burial and avoid 10Be accumulation. However, Puchol et al. (2017) show that the
200 10Be concentrations are independent of the sedimentary facies and the vertical position within each
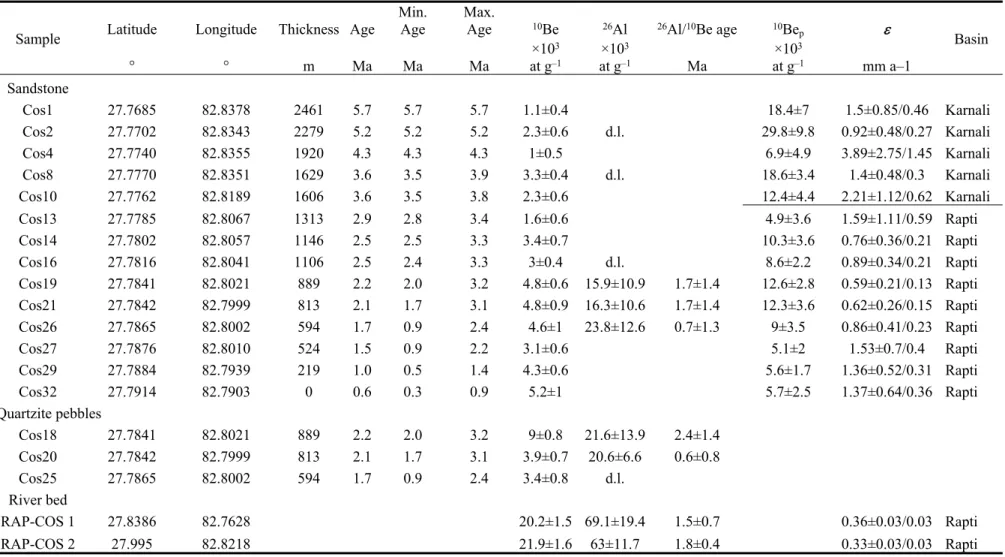
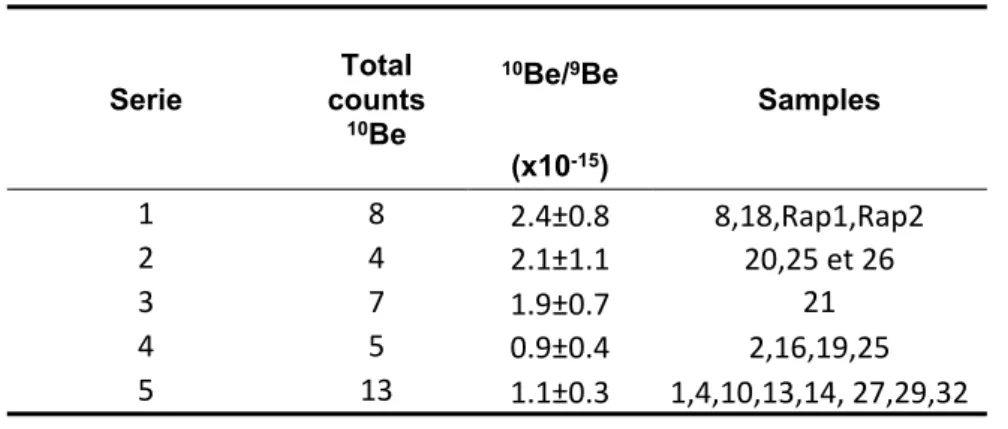
201 sedimentary unit. To document present denudation rates, we also sampled two river-bank deposits in the present-202 day West Rapti River: Rap-Cos1 was collected upstream of the Siwaliks (~5 km north of the MBT, Fig. 2a) and 203 Rap-Cos2 was sampled north of the Dundwa ridge, just north of the Siling thrust at the Bahlubang bridge (Fig. 2a 204 and b). Because we suspected high denudation rates (>1 mm a–1), and therefore very low initial 10Be concentrations 205 in the sampled sediments, we sampled unusually large masses of sand (sometimes >5 kg) to ensure enough pure 206 quartz to provide detectable amounts of 10Be. The sample treatment and 10Be analysis procedures are detailed in 207 the supplementary material.
208
209 3.3 Age model: magnetostratigraphy, stochastic correlations, and cosmogenic burial ages
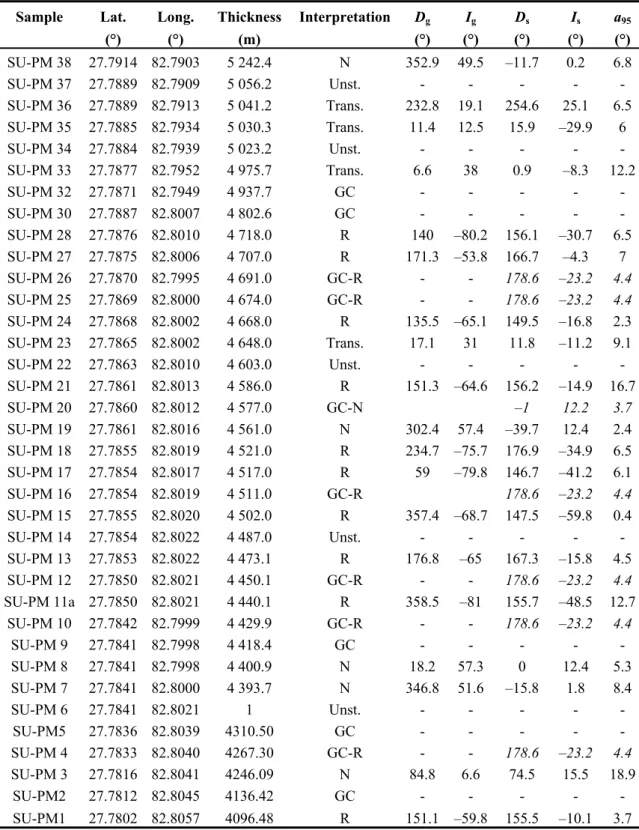
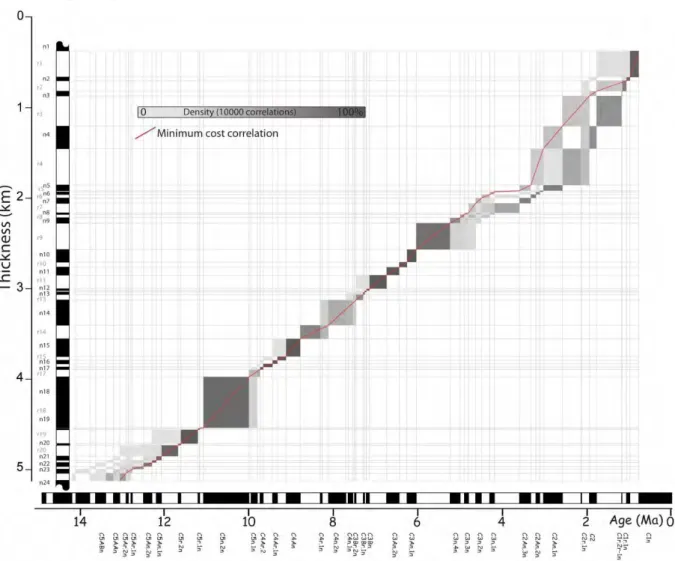
210 We collected 36 new samples for palaeomagnetic analyses (Figs. 2 and 3) in the upper conglomeratic part 211 of the section. Because most of the layers were either too coarse for palaeomagnetic analysis or not amenable to 212 drilling, we sampled only the finer silty to sandy horizons by hand by inserting quartz cylinders. We established 213 the magnetic polarity sequence of the Surai section by incorporating our results (see the Supplementary 214 information for more technical details) into the 436 samples analysed and interpreted by Appel et al. (1991). 215 Magnetic intervals were identified as at least two successive horizons with the same polarity. This revised column
216 (see Supplementary information for the depth of the polarity intervals) was then correlated to the reference scale
217 of Ogg (2012) to establish the depositional ages of the section. To minimize ambiguities and uncertainties related 218 to these correlations, we used a numerical method based on the dynamic time warping (DTW) algorithm 219 (https://www.ring-team.org/software/downloads) (Lallier et al., 2013) and automatically calculated 10,000 220 reasonably likely correlations. In this approach, the correlations are computed to minimize the local variation of 221 the accumulation rate and ranked based on the calculation of a cost.
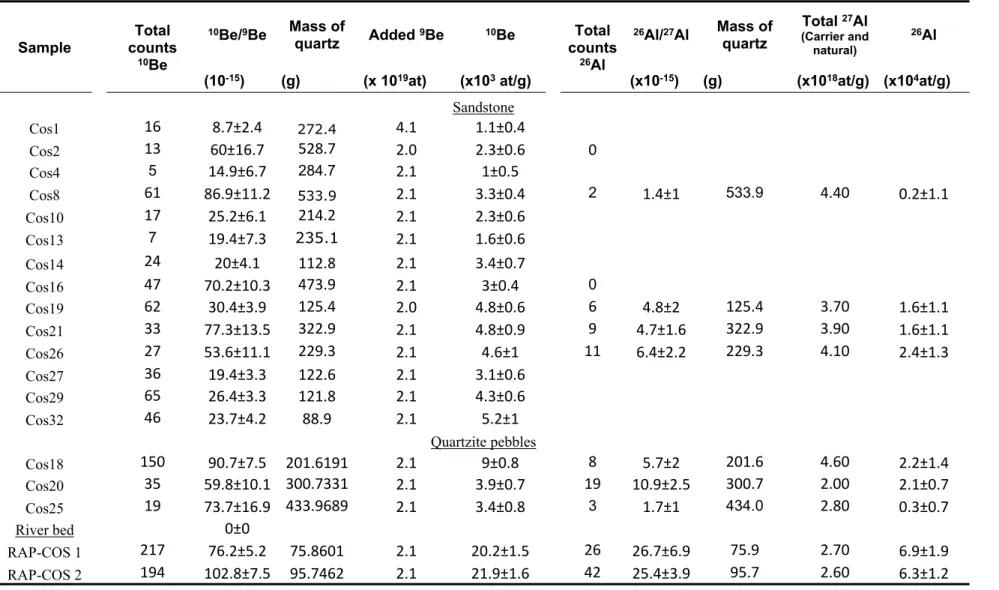
222 To estimate 26Al/10Be cosmogenic burial ages in the upper part of the section, (e.g., Granger and Muzikar, 223 2001), five of the 10Be samples were also analysed for 26Al, and we measured both 10Be and 26Al in three other 224 quartzite pebbles (Table 1). The corresponding burial ages were then calculated from the measured 10Be and 26Al 225 concentrations and the mean elevation of the present drainage basin using the Matlab® code of Blard et al. (2019). 226
227 3.4 10Be accumulation in the flood plain
228 Charreau et al. (2011) and Puchol et al. (2017), based on on the sedimentological analysis of the foreland
229 sediments (Charreau et al., 2009), assumed that sediments in the Tianshan foreland are nearly continuously and
230 progressively buried at a rate equal to the long-term (>100-ka) mean deposition rate, and therefore that 10Be 231 accumulation during transport is minimal. This implies grain transport without interaction with the plain, and 232 deposition of thin, regular sediment layers. However, rivers draining through the Ganga plain are much larger,
233 deeper and active than in the northern Tian Shan piedmont. They display rapid channel migration or avulsion
234 (Sinha, 2009; Sinha et al., 2005), whether they are braided in their upper reach or meandering in their lower reach.
236 indicate an average lateral migration of its channel of ~70m/a all along its course in the Ganga plain. A direct
237 consequence of this lateral migration is bank erosion on one side and bank deposition on the other side. Sediment
238 transfer through the floodplain is therefore better characterized by successive phases of (1) brief periods of
239 transport, (2) temporary deposition in the floodplain, (3) floodplain and bank erosion followed by a new phase of
240 transport. Through bank erosion and deposition, sediments are constantly exchanged between the active channel
241 and the floodplain. For the Himalayan setting we therefore need to account for this sediment reworking and
242 exchange to estimate the floodplain contribution (Nfp) and 10Be accumulation during sediment transfer and final
243 burial.
244 Lauer and Willenbring (2010) proposed a simplified steady-state mass-balance model accounting more 245 realistically for cosmogenic nuclide accumulation during sediment transfer within a foreland basin. In this model,
246 already applied to the Ganga plain by Lupker et al. (2012b), floodplain sediments are regularly reworked by
247 channel migration across the fan surface (considered as rectangular), and final sediment burial occurs through the 248 base of the channel, i.e., when sediments are buried deeper than the mean channel reworking depth. Although this 249 model represents a strong simplification of river dynamics, we use it but deprived of lateral supply (generally 250 negligible along proximal parts of the Himalayan river fans) to predict the first-order evolution of 10Be 251 accumulation during floodplain transfer (see Supplementary information). More importantly, we hypothesize that
252 this model, calibrated through observations on modern Karnali or Rapti rivers, can be applied to describe plain
253 dynamic in the past. Such assumption is primarily based on the fact that external forcing like subsidence rates or
254 incoming Himalayan sediment flux have remained roughly stable since 6Ma as described further in the text
255 (section 4). It is also supported by sedimentologic description of the middle Siwalik facies along the Surai Khola
256 section: this formation that presents thick, cross-bedded, multi-stored sandstones was presumably laid down by
257 wide, braided river systems, and the presence of erosive bases attests for continuous reworking during the erosional
258 and aggradational cycles due to stream migration (Corvinus and Rimal, 2001).
259
260 3.5 Tracing sediment sources: major element and Sr and Nd isotopic analyses
261 The three main Himalayan units are distinguishable by their uniqueNd and 87Sr/86Sr ratios characteristics 262 and can be tracked back in sediments(Deniel et al., 1987; France-Lanord et al., 1993; Morin, 2015; Parrish and 263 Hodges, 1996; Robinson et al., 2001). Moreover, major element data allow the characterization of sediment sorting 264 (for example, Al/Si and Fe/Si ratios are closely related to grain size; Lupker et al., 2011) , and apparent weathering 265 intensity (i.e., K/Al and Na/Si ratios, because Na and K are mobile elements potentially affected by weathering; 266 Lupker et al., 2012b). Such approaches provide information critical to identifying reworking in weathered 267 sediments or potential changes in sediment sources (e.g., Mandal et al., 2019).
268 We refined the existing Surai section record (Huyghe et al., 2001; Robinson et al., 2001; Szulc et al., 269 2006), especially in the upper part of the section where sampling has been less dense. We analysed the major 270 element compositions of 14 new samples of silts and fine sandstones (SU-PM2 to 38), adding to the 35 samples 271 already analysed by Lupker et al. (2012b) (samples 94-04 to 94-60 in their Table 2). We also analysed present 272 Rapti River sands collected at the outlet of the LH (Rap-Cos1) and 200 km downstream, at the front of the MFT 273 (Nag9, Fig. 2a).
274
276 4.1 Age model from magnetostratigraphic data and 26Al/10Be burial ages
277 We found a consistent demagnetization pattern in 31 of our 36 samples (Figure 3a–c) (see supplementary 278 information for more technical details) with unambiguous and robust polarities despite low magnetic signal. 279 Among the 31 analysed samples, 19 can be interpreted as having primary magnetizations direction and 12 had 280 remanence trajectories spread out about great circles (Fig. 3d) that never reached stable endpoints but had clear 281 polarities. These 31 samples were considered to construct the magnetostratigraphic column (Fig. 4f). The resulting 282 magnetostratigraphic column based on these new data and 436 previously analysed samples (Appel et al., 1991, 283 with stratigraphic depths from Rosler et al., 1997) is presented in Figure 4 and compared to the previous columns 284 of Appel et al. (1991), Rosler et al. (1997), and Ojha et al. (1999). It includes 24 and 23 normal and reversed 285 polarity intervals, respectively. To correlate this polarity column to the reference scale, the reverse interval r5, 286 which relied on only two samples of the same polarity, was arbitrarily omitted during the calculations (see 287 supplementary material for justification). Figure 4f shows the density plot compiling the 10,000 possible 288 correlations to the reference scale calculated using the DTW algorithm (Lallier et al., 2013). All found correlations 289 date the Surai section to between ~13–14 Ma and ~1–2 Ma (chrons C5A to C1), broadly similar to the previous 290 calculations that considered all polarity intervals. However, our new accumulation rates are, on average, more 291 steady and likely more realistic.
292 26Al analyses were successful for only 7 of the 10 samples analysed, returning associated burial ages 293 ranging from 2.4 ± 1.4 to 0.6 ± 0.8 Ma (Table 1). The 26Al contents of the three remaining samples were below 294 the detection limit (< ~5 103 at g–1), two of which (Cos8 and Cos16) correspond to the oldest sediments of the 295 record. The burial ages are burdened by large error bars that can reach 100% because of high analytical 296 uncertainties on both 10Be and 26Al concentrations and do not allow to constrain the burial ages better than 0.8Ma. 297 Though they do not provide data critical to better constraining the depositional ages in the upper part of the Surai 298 section, these burial ages remain, at first order, consistent with the proposed magnetostratigraphic correlations 299 (Fig. 4). Unfortunately, given the uncertainties attached to both these burial ages and their respective depositional
300 ages, it is impossible by comparing the two set of ages (Fig. 4h) to identify neither sediments recycling nor recent
301 re-exposure.
302
303 4.2 Major element and Sr-Nd isotopic compositions: evidence of a drainage change at 3–4 Ma?
304 The complete geochemical results measured along the Surai section, combining our new analyses with 305 previously published data (Huyghe et al., 2001; Lupker et al., 2012b; Robinson et al., 2001; Szulc et al., 2006) are 306 listed in Supplementary Table D. The main data are presented in age logs (Fig. 5) and in Na/Si vs. Al/Si and Sr vs. 307 Nd plots (Fig. 6) with data from modern river sediments for comparison.
308 The Sr and Nd isotopic compositions of the silicate fractions are relatively close to the HHC and TSS 309 endmembers of Morin (2015): 87Sr/86Sr ratios range from 0.724 to 0.795 and Nd values from –19.2 to –14.7 (Fig. 310 6b). Neither isotopic composition displays any temporal variation (Fig. 5). The two modern Rapti River sediments 311 plot in the middle of the Surai section sample array. These data suggest that the palaeodrainage basin of the Surai 312 section has been dominated by erosion of the High Himalaya (HHC and TSS), with secondary contributions (0– 313 30%) from the LH.
314 Siwalik sediments in the Surai section have Al/Si ratios ranging between 0.03 and 0.34. With a few 315 exceptions, sediments older than ~3.5 Ma show Al/Si > 0.1, whereas several samples from the upper part of the
316 section (i.e., younger than ~3.5 Ma) present Al/Si < 0.1, markedly below those of bed sediments or sandy banks 317 of modern Himalayan front rivers, including the rivers draining the Siwaliks (Figs. 5 and 6, Supplementary Table
318 D). These results suggest a higher degree of sediment sorting than observed in modern main Himalayan rivers and
319 floodplain banks. Yet, as the Himalayan range has encroached on the foreland basin, one may expect the length of 320 transport to decrease toward the top of the section (Fig. 7), and hence the depositional area to be more proximal, 321 resulting in decreased sorting. Consistently, to reach such low Al/Si values (<0.1) in the samples younger than ca.
322 3.5 Ma may require multiple episodes of erosion/transport of sediments that had already been sorted, potentially
323 indicating the recycling of older Siwalik sediments already transported into the depositional plain.
324 Sediments of the Surai section have Na/Si ratios ranging from 0.001 to 0.035 that tend to decrease with 325 decreasing depositional age, reaching values below 0.005 in the upper part of the section (i.e., younger than ~3–4 326 Ma). Na/Si ratios in the Surai section are far lower than those of the Ganga in Bangladesh (0.3–0.4), implying that 327 weathering reactions affecting plagioclase were intense in the Surai section sandstones either at the time of 328 deposition (Lupker et al., 2012b) and/or during recent exhumation of the Siwalik folds (France-Lanord et al., 329 2003). Na concentrations in the Surai section are also markedly depleted compared to those in modern main 330 Himalayan river sediments, which have Na/Si ratios ranging between 0.035 and 0.055 (Figs. 5 and 6, 331 Supplementary Table D). Only the Karnali River is characterized by lower Na/Si ratios between 0.020 and 0.035 332 that are comparable to those of the lower (>3–4 Ma) part of the Surai section, which has been attributed to a 333 significant contribution from erosion of the Siwaliks (Lupker et al., 2012b). In contrast, the Na/Si ratios of 334 sediments younger than ~3–4 Ma are significantly lower than those observed in Siwalik rivers, suggesting a higher 335 degree of weathering for the upper conglomeratic part of the section. The increased weathering intensity in the 336 upper part of the section is further supported by the higher degree of carbonate dissolution indicated by the lower 337 CaO concentrations observed in sediments younger than 4 Ma (mean = 5.4 wt%, = 6.3) compared to older 338 sediments (mean = 11.6 wt%, = 8.3; Supplementary Table D). This evolution (i.e., increased plagioclase 339 weathering and carbonate dissolution upsection) is counter-intuitive, as one would expect the amplitude of 340 weathering to decrease as deposition nears the Himalayan front and the residence time in the Ganga plain surface 341 decreases. The most intense sediment weathering, as expressed by very low Na/Si values, therefore requires 342 additional weathering. Such a process could occur in-situ during sediments exhumation toward the surface and
343 could be favoured by the coarser grain size and hence the higher permeability found at the top of the section.
344 However, first, if such process occurs, we would expect low Na/Si values at other stratigraphic level of the section
345 where the grain size is also locally coarse (Fig. 4). Second, the sampled sediments were fresh as recently excavated
346 by the construction of the road. Third, the grain size of the samples is similar throughout the section and fourth,
347 the low Al/Si values found at the top request additional sorting and transport that can not be made in-situ.
348 Alternatively, additional weathering can be met for Siwalik sediments derived from already altered materials, for
349 example by recycling of older Siwalik sediments. In such a case, sediments younger than ~3–4 Ma might represent 350 sediments affected by two successive weathering cycles during the Himalayan orogeny.
351 Although Sr-Nd isotopic tracers reveal only that the palaeodrainage basin of the Surai section remained 352 essentially steady, our and previous major element data indicate both (1) a strong increase in plagioclase 353 weathering (leading to Na/Si ratios nearing zero) and (2) the appearance of well sorted sand since 3–4 Ma. Among 354 the sediments exported by the modern river system in Nepal (Fig. 6a), only rivers that dominantly drain the 355 Siwaliks carry sediments comparably well sorted (low Al/Si) and Na-depleted as those in the Surai section (Fig.
356 6b, Supplementary Table D). The geochemical characteristics of sediments in the Surai section are therefore 357 consistent with an increasing proportion of sediment derived from recycling of the Siwaliks, not directly eroded 358 from the High Himalaya. We note that such recycling is not incompatible with the stability of the Sr-Nd isotopic 359 dataset, as recycling does not impact the original source signal (Lupker et al., 2012b; Morin, 2015).
360 Despite very high denudation rates (>1 mm a–1 Lavé and Avouac, 2000) the small areal contribution of 361 the Siwalik Hills to the drainage basins of most trans-Himalayan rivers prevents sediments in these large drainage 362 basins from becoming significantly depleted in Na (or Al) upon addition of Siwalik-derived material (Fig. 6). For 363 recycled, more mature Siwalik sediments to affect a marked change in the major element signal, as observed in 364 the upper part of the Surai section, the relative sediment flux from terrains north of the MBT must be strongly 365 reduced. We therefore interpret the major compositional change observed in the Surai section at ~3–4 Ma (Fig. 5) 366 as a shift of the contributing drainage basin from a trans-Himalayan basin towards one draining the Lesser
367 Himalaya (Fig. 7), characterized by reduced sediment flux due to a smaller basin area north of the MBT and greatly
368 reduced erosion rates in the Lesser Himalaya compared to the High Himalayan regions (Godard et al., 2014). This 369 process does not require a reorganization of the river network across the mountain range in the Karnali region but 370 can simply arise from steady facies migration in the Ganga plain during the growth and southward migration of 371 the Himalayan range. As the locus of sedimentation associated with the Surai section progressively migrated 372 towards the Himalayan front, the proportion of recycled Siwalik sediment could have suddenly increased upon 373 crossing a boundary between two alluvial fans associated with a trans-Himalayan and a medium-sized drainage 374 basin (Fig. 7).
375
376 4.3 Measured cosmogenic concentrations, corrections, and palaeoconcentrations
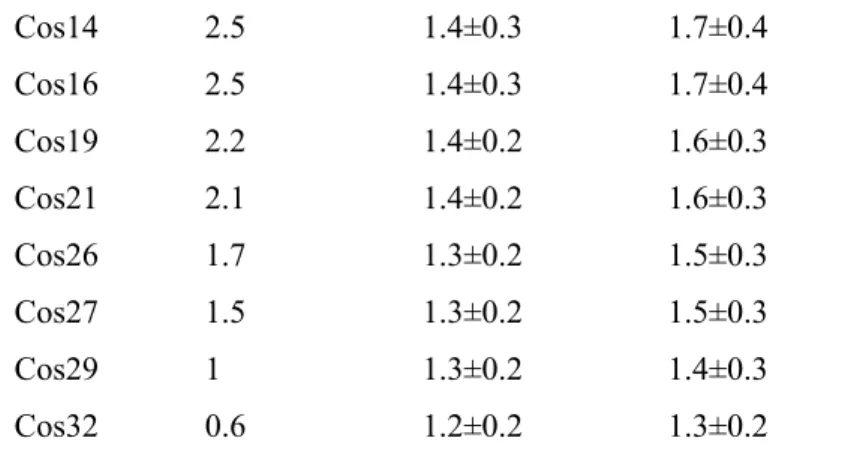
377 The complete results of our cosmogenic analyses are presented in Table 1 (raw data are provided in 378 Supplementary Tables E). The measured 10Be concentrations are on average relatively low and range between 379 (1.00 ± 0.36) to (5.22 ± 0.98) 103 at g–1. They decrease with increasing depositional age, as expected a priori 380 from radioactive decay (Table 1). The relative uncertainties on these concentrations, which mainly arise from 381 accelerator mass spectrometer counting statistics, are higher in the oldest strata, in which the measured 382 concentrations are lower.
383 The modelled 10Be contributions during transport in the Ganga plain are reported in Supplementary Table 384 C. They range from (1.2 ± 0.2) to (1.6 ± 0.3) 103 at g–1 and from (1.3 ± 0.2) to (2.4 ± 0.7) 103 at g–1 considering 385 the Karnali and Rapti fans, respectively. Although these values were calculated based on modern rivers, they may 386 also represent the 10Be contribution at the time of deposition. These contributions represent 4 to 20% of the total 387 measured cosmogenic concentrations after correction for radioactive decay, irrespective of the fan model (Karnali 388 vs. Rapti).
389 After correcting for radioactive decay and floodplain exposure, the 10Be palaeoconcentrations of 390 sediments leaving the Himalayan range that are directly related to its denudation, range between (4.9 ± 3.6) and 391 (29.8 ± 9.8) 105 at g–1 (Table 1). The correction for floodplain exposure was applied consistent with a change of 392 the contributing basin area due to facies migration at 4-3 Ma (see section 4.2): the floodplain corrections for 393 sediments deposited before and after 4-3 Ma were based on the modern Karnali and Rapti Rivers, respectively. 394
396 Again, consistent with a change of the contributing basin area due to facies migration at 4-3 Ma, we 397 assumed that the topography of the drainage basin was similar to that of the present-day Rapti catchment during 398 3–0 Ma. The basin-averaged 10Be cosmogenic surface production rates during this period were therefore estimated 399 to be 10.95, 0.02, and 0.05 at g–1 a–1 for spallation and slow and fast muogenic processes, respectively. During 6– 400 3 Ma, we considered that the catchment area was draining the entire Himalayas and estimated cosmogenic 401 production rates of 39.59, 0.04, and 0.06 at g–1 a–1 for spallation and slow and fast muogenic processes, 402 respectively.
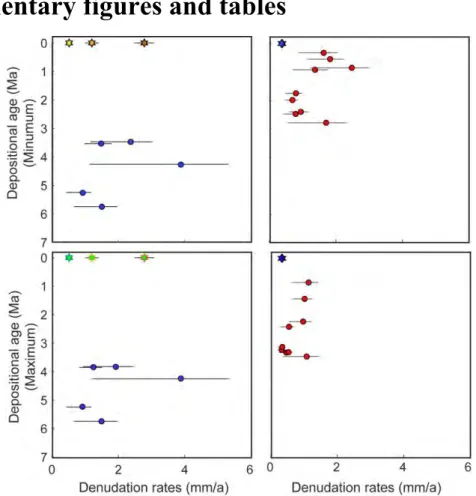
403 Between 6 and 3.5 Ma, denudation rates were relatively steady at around 1.7 ± 0.3 mm a–1 in the palaeo-404 Karnali basin (Table 1 and Fig. 8) (except for one sample that returned a rate of ~3.9 mm a–1, but which was 405 affected by a large uncertainty of ±2.7 mm a–1). Palaeodenudation rates associated with a Rapti-type drainage basin 406 during 3–0 Ma were lower, ranging from 0.6 ± 0.2 to 1.6 ± 1.1 mm a–1, but denudation rates markedly increased 407 during 1.5–0.5 Ma (Table 1 and Fig. 8). These values are higher than the modern denudation rates of 0.36 ± 0.03 408 and 0.33 ± 0.03 mm a–1 that we determined for present-day Rapti sediments upstream of the MBT, i.e., without 409 any contribution from the actively uplifted and exhumed frontal fold. Only three samples (Cos14, 19, and 21; 410 Table 1) returned palaeodenudation rates consistent (within uncertainties) with this modern rate.
411
412
5. Discussion
413 5.1 Robustness of the reconstructed 10Be palaeoconcentrations and derived palaeodenudation rates 414 10Be accumulation during sediment transport was likely of second order compared to that during 415 denudation of the source rocks. Our sediment transport model, though simplified and strongly based on present-416 day basin characteristics, suggests that 10Be concentrations increased by less than 10 and 15% of the concentrations 417 in modern Rapti and Karnali sediments, respectively, during transport. We therefore extrapolate such moderate 418 contributions during transport to the older deposits (though we note that this is dependent on our choice of model). 419 This contrasts, however, with Charreau et al.'s (2011) approach to estimate floodplain exposure by the steady 420 sedimentation of thin sediment sheets at the long term subsidence rate (~0.5 mm/a), which predicted contributions 421 during accumulation of ~7.3 103 at g–1, or 40–>600% of the total measured concentrations. These would make
422 the correction for accumulation higher than the measured concentration and demonstrate that the approach of
423 Charreau et al. (2011) to calculate the contribution of 10Be accumulation in the floodplain is not appropriate for
424 the case of the Himalayan foreland.
425 In the lower part of the section (up to 2,500 m stratigraphic depth, reverse interval r9), our 426 magnetostratigraphic correlations agree relatively well with previous correlations. The depositional ages and hence 427 the derived 10Be palaeoconcentrations in this lower part of the section are robust and reliable. Upsection, 428 correlation of the n5–n9 sequence remains problematic but our new sampling documents the existence of several 429 reversals and protracted periods of reversed polarities, suggesting that sediment deposition did not stop around 3 430 Ma (normal reference chron C2An), but lasted another several hundreds of thousands of years, probably even more
431 up to the base of Matuyama chron (C1) around 0.7 Ma. Despite those uncertainties, the difference, for a given
432 stratigraphic level, between the minimum and maximum ages found from all the 10000 correlations never exceeds
433 ~1 Ma (Fig. 4). Hence and to the first order, our denudation rates and their temporal evolution are similar even 434 when considering extreme age models (Supplementary Fig. B).
435 Our interpretation that the contributing drainage basin shifted at ~4–3 Ma is consistent with detrital apatite 436 fission-track (AFT; van der Beek et al., 2006) and Ar-Ar ages (Szulc et al., 2006) that show a ~2 Ma increase in 437 lag time (based here on our revised ages) after ~4-3 Ma (Fig. 9). Such an increased depositional lag time is evident 438 even if we consider the magnetostratigraphic correlation that gives the oldest depositional ages in the upper part 439 of the section (i.e., dating the top at ~2 Ma; Fig. 4). This increased lag time may reflect either (1) decreased 440 exhumation rates across the drainage basins or (2) the reworking of older detrital grains. Indeed, the AFT age at 441 the top of the section is older than those lower in the section (Supplementary Fig. C; van der Beek et al., 2006); as 442 this is unrealistic in such an orogenic setting, it suggests the reworking of older grains. However, some cautions
443 are needed because the increase in thermochronological lag-time is supported by only one AFT sample and is not
444 seen in the ZFT data. But, similarly, provenance analyses of the Mohand-Rao sections (northwest India) evidence
445 the recycling of Siwalik sediments, there starting at ~5.5 Ma (Mandal et al., 2019). We therefore continue our 446 discussion under the assumption that the contributing drainage basin migrated across distinct zones of fan 447 deposition at 3–4 Ma and subsequently recycled older Siwalik sediments.
448 The impact of such sediment recycling on our derived denudation rates must be evaluated before 449 discussing the palaeo-denudation rates. The 10Be concentrations measured at the outlet of the palaeo-Rapti basin 450 reflect the mixing of 10Be-enriched sediments from the Lesser Himalaya with 10Be-deprived sediments from the 451 rapidly exhuming frontal Siwaliks folds. However, the initial concentrations in Siwalik sediments before 452 exhumation may not be null, and could be inherited from the original Mio-Pliocene erosion of the Himalayan
453 ranges and vary according to the exhumation level. Most original 10Be in the older Lower and Middle Siwaliks
454 sediments has already radioactively decayed. The incorporation of such depleted sediments could lower the
455 concentration measured in the river. Siwalik sediments eroded and shed to the river between the two modern
456 samples (RapCos 1 and 2) are mainly Middle to Lower Siwalik. Yet, the 10Be concentrations measured in the two
457 samples are not significantly different likely because the addition in RapCos1 represents less than 10% of the
458 drainage area of Rap-Cos2, and secondly, because this drained Siwalik part is not the most active one in terms of
459 tectonic uplift and therefore probably in terms of erosion (Lavé and Avouac, 2000). Alternatively, in the younger
460 Upper Siwaliks sediments the initial and inherited 10Be concentrations has not yet radioactively decayed and
461 remain elevated. During the past, the erosion of the most frontal and rapidly uplifting structures may have produced
462 a significant volume of such younger enriched sediments equivalent to the Upper Siwalik and biased the
463 cosmogenic signal. To explore further potential variations of denudation in the palaeo-Rapti basin, we therefore
464 built a simple model of frontal fold erosion and sediment mixing with a LH-draining river such as the Rapti River 465 (see Supplementary materials for more details). We calculated, as a function of the time since fold initiation 466 (assumed at 3 Ma), the evolution of the 10Be concentration expected from the denudation of the Siwalik Hills only 467 (𝑁Siw) and the final concentration after mixing of recycled Siwalik sediments with sediments shed from the 468 upstream midland basin above the MBT (𝑁 ). Consistent with modern 10Be concentrations measured in the Rapti
out
469 basin upstream of the Siwaliks at the MBT, we assumed that the upstream sediments shed from the Rapti basin
470 during Siwaliks reworking have a steady 10Be concentration of (~20 ± 2) 103 at g–1. We hence assume a steady
471 denudation rates ~0.3 mm/a across the Rapti basin upstream of the Siwaliks at the MBT. The mean 10Be
472 concentration of the reworked Siwalik sediments can be inferred from the concentration measured in 7–3 Ma
473 sediments in the Surai section, corrected for radioactive decay and transport in the floodplain (~17 ± 6) 103 at
475 The model results are shown in Figure 10 and compared to the 10Be palaeoconcentrations measured in 476 0–3 Ma sediments of the Surai section. Within errors, the measured palaeoconcentrations are consistent with the 477 modelled 𝑁out values. The model also indicates that the 10Be concentrations may vary by a factor of >2 between 478 the early and later stages of frontal fold development due to the exhumation of Siwalik sediments with variable 479 10Be inheritances. Although the model results are strongly dependent on various parameters (e.g., the relative areas 480 of the Midland and Siwalik parts of the catchment, and the erosion rate of the Midland), the model yields two 481 important insights. First, the variations of 10Be palaeoconcentrations measured in Surai sediments younger than 482 ~3.5 Ma may reflect frontal fold activity, or even steady fold accretion, and not necessarily a change of erosion 483 rate in the contributing drainage basin. Second, the low 10Be concentrations measured in the upper Surai section, 484 which are up to 5 times lower than present-day concentrations in Rapti River sediments above the MDT, can 485 indeed be explained by mixing with 10Be-depleted material shed from rapidly exhumed Siwalik sandstone in the 486 hanging wall of the MFT. Therefore, we propose that recycling of Na- and 10Be-depleted materials through 487 denudation of the Siwalik belt has strongly impacted the chemistry and 10Be concentrations of the sands exported 488 by frontal- or midland-draining rivers and their associated fan deposits; additional measurements (major elements, 489 10Be,
Nd) of recent Rapti River sediments up- and downstream of the MFT fold should be performed to fully 490 ascertain our assessment. To reconstruct palaeodenudation rates from in situ cosmogenic 10Be analyses of foreland 491 sediments, it is therefore critical to trace potentially recycled sediments. In the Himalayas, although Sr-Nd isotopes 492 have been widely used to study sediment provenance, our results and those of Mandal et al. (2019) suggest that 493 these geochemical proxies are insensitive to sediment recycling, which is better identified by simpler major and 494 trace element analyses, notably Al/Si and Na/Si, which are linked to weathering and sorting processes, respectively 495 (Lupker et al., 2012b, 2011).
496
497 5.2 Implications for the late Cenozoic evolution of denudation rates in the central Himalayas
498 The palaeodenudation rates associated with the Karnali-type basin from ~6 to 3 Ma are close to the 499 modern denudation values measured along the Karnali downstream of the Siwaliks (Fig. 8; Lupker et al., 2012a). 500 Though denudation rates since 3.5 Ma for a Karnali-type basin are missing from our record, this similarity might 501 suggest that average denudation rates in the Karnali basin may have remained steady at around ~1.7 ± 0.3 mm a–1 502 since ~6 Ma. For the period 3–0 Ma and sediments associated with smaller basins like the Rapti, direct comparison 503 of 10Be palaeodenudation rates and observed modern denudation rates is complicated by the recycling of Siwalik 504 sediments. If we accept that the low 10Be concentrations measured in the upper Surai section (<3 Ma) are related 505 to the recycling of older, 10Be-depleted Siwalik sediments, then our denudation rates should be considered 506 maximum values. Although it is almost impossible to reconstruct the true palaeodenudation rates in the basin 507 upstream of the Siwaliks, our simple sediment mixing model suggests that denudation rates similar to modern rates 508 yield theoretical 10Be concentrations consistent with those measured downstream of the Siwaliks. Consequently,
509 a steady denudation at around ~0.3 mm a–1 since 3 Ma in the palaeo-Rapti basin, together with recycling in the
510 Siwalik, could produce the 10Be concentrations that we observe in the Surai section. Although this conclusion is
511 tentative given the over-simplifications in our recycling model, the range of expected 10Be palaeo- (≥0.3 and << 512 1.6 mm a-1) and modern Rapti basin denudation rates (~0.3 mm a–1, as measured above the MDT; Figs. 1, 2, and 513 8) are consistent with denudation rates of 0.1–0.5 mm a–1 reported in other midland drainage basins of central
514 Nepal (Godard et al., 2014; Scherler et al., 2014). These 10Be data thus suggest that (1) denudation rates are higher 515 in the HHC than in the LH and (2) denudation may have remained steady since ~6 Ma, at least in the Karnali basin. 516 As no in situ thermochronologically derived denudation rates are available for sites nearer the Karnali 517 and Rapti basins, we compare our 10Be denudation rates to in situ thermochronological data for the Sutlej region 518 (western India, near the Nepal border) and for central Nepal (i.e., at the longitude of Kathmandu). Denudation 519 rates in those areas range between ~0.5 and 3 mm a–1 (Bojar et al., 2005; Herman et al., 2010; Patel and Carter, 520 2009; Thiede and Ehlers, 2013). Consistent with our findings, thermochronologically derived denudation rates 521 tend to be lower in the LH (0.3–0.5 mm a–1) than in the HHC, where rates can reach up to ~3 mm a–1 (e.g., Herman 522 et al., 2010; Thiede and Ehlers, 2013). High denudation rates in the HHC have also been reported from in situ 523 thermochronological data in other regions across the Himalayas (Blythe et al., 2007; Herman et al., 2010; 524 Huntington et al., 2006; Thiede and Ehlers, 2013), and petrological and mineralogical analyses, sediment flux 525 monitoring (Garzanti et al., 2007), and fluvial incision rates (e.g., Lavé and Avouac, 2001) further suggest that the 526 LH denude at lower rates than the HHC. This discrepancy between the LH and HHC is likely due to crustal wedge 527 deformation and duplexing along the Main Himalayan Thrust, which orographically triggers monsoonal 528 precipitation, enhancing denudation in the HHC (Herman et al., 2010; Thiede and Ehlers, 2013).
529 To further examine the temporal evolution of our 10Be denudation rates, we compared with denudation 530 histories derived from thermochronological analyses of detrital grains. In the Karnali section, assuming a 531 geothermal gradient of 20 °C, Bernet et al. (2006) and van der Beek et al. (2006) reported exhumation rates of 532 ~1–2 mm a–1. In the Surai section, if we consider only the period before the recycling of Siwalik sediments (>3–4 533 Ma), likely also associated with the Karnali basin, revised zircon fission track (ZFT) and Ar-Ar lag times are on
534 average ~4 and ~6 Ma, respectively, whereas AFT ages are similar to depositional ages (Bernet et al., 2006; Szulc 535 et al., 2006; van der Beek et al., 2006) (Supplementary Fig. C). Van der Beek et al. (2006) assumed a geothermal 536 gradient of ~20 °C and ZFT and Ar-Ar closure temperatures of 240 °C and 350 °C, respectively. This would yield
537 respective denudation rates of ~3 and ~2.9 mm a–1, markedly higher than 10Be-derived denudation rates for the 538 Karnali and Surai sections. Two effects may explain this discrepancy. First, interpretation and population 539 modelling of detrital age distributions are not straightforward and may suffer from several biases (Naylor et al., 540 2015; Sundell and Saylor, 2017). Indeed, recent slow denudation rates may be unrepresented to detrital analyses 541 because the rocks may have not yet reached the surface (Naylor et al., 2015; Willenbring and Jerolmack, 2016), 542 yielding overestimated denudation rates during the last few million years. Moreover, as detrital denudation rates 543 are derived by comparing only the youngest peak to depositional ages, such denudation rates are maximum values 544 that may preferentially sample the most eroding regions within a basin and, hence, may not truly average 545 denudation throughout the basin.
546 Second, detrital thermochronological ages and denudation rates depend on the local geotherm, which may 547 reach 100 °C/km in regions of rapid tectonic exhumation (Braun, 2005). Although high geothermal gradients (>50 548 °C/km) were observed in the Namche Barwa region (Craw et al., 2005), this region presents extreme tectonic 549 exhumation rates and thus may not be a good analogue of the Karnali basin. Geothermal gradients of 20–50 °C/km 550 have also been reported in central Nepal (Bollinger et al., 2006), but correspond to the LH where denudation is 551 relatively slow (<1 mm a–1). Therefore, a more realistic value of the average geothermal gradient for the entire 552 Karnali basin is likely ~50 °C/km, which would yield detrital thermochronological denudation rates of 0.6–1.2 553 mm a–1 in the Karnali and Surai sections. These values are more consistent with our 10Be-derived rates for a
554 Karnali-type drainage basin. However, these thermochronological denudation rates remain crude estimates. To
555 provide more accurate values a careful reassessment of the detrital thermochronological data is needed including
556 for example Monte Carlo simulations of the age population based on more realistic and spatially variable
557 geothermal gradients (e.g. Brewer et al., 2003).
558 Importantly, Lenard et al. (2020) suggest, from 10Be analyses of the sediments of the Bay of Bengal
559 seabed, a steady denudation across the Himalayas since 6Ma. In the Karnali section, depositional lag times
560 determined from ZFT and AFT ages remain remarkably steady from ~14 to ~3 Ma and from ~7 to ~3 Ma,
561 respectively (Bernet et al., 2006; van der Beek et al., 2006). In the Surai section, if we exclude the youngest part
562 of the section where recycling likely occurred (<3–4 Ma), lag times determined from AFT, ZFT, and Ar-Ar ages
563 are also relatively steady (Supplementary Fig. C). Even if we cannot fully exclude variable denudation rates in the
564 Karnali basin because we lack direct records since ~3 Ma, both 10Be data and previous detrital
565 thermochronological data are at least consistent with steady palaeodenudation rates in the region since
566 the late Miocene. All together, these results suggest a limited impact of Quaternary climatic oscillations on
567 denudation rates in the Himalaya (Lénard et al., 2020) as is the case in the Tianshan range (Puchol et al., 2017) or
568 in the southern California (Oskin et al., 2017). In that sense, they seem to contradict thermochronological data
569 results that document an accelerated Quaternary denudation rates over large mountain ranges (Herman et al.,
570 2013).
571
572
6. Conclusions
573 The Surai section in the central Siwaliks is well suited to reconstruct palaeodenudation rates from in situ 574 cosmogenic 10Be analyses. 10Be concentrations measured in 19 samples were transformed to palaeoconcentrations
575 based on several corrections and to palaeodenudation rates by assuming that cosmogenic palaeoproduction rates
576 were similar to those of the modern drainage basins and a shift from a trans-Himalayan to a midland-draining basin 577 at 4-3 Ma as suggested by major and trace element data. Consequently, we propose that denudation rates in the 578 palaeo-Karnali basin may have been steady around ~1.7 mm a–1 from ~6 to ~3 Ma. These denudation rates are 579 similar to modern values observed downstream of the Siwaliks, suggesting steady denudation rates across the 580 Karnali basin since ~6 Ma. Our data suggest that denudation rates may have accelerated from ~0.4-1.1 mm a–1 581 during ~3–1.5 Ma to ~1.5 mm a–1 since ~1.5 Ma in the palaeo-Rapti basin. However, based on a sediment-mixing 582 model, we argue that this is likely only an apparent acceleration due to the reworking of older Siwalik sediments 583 depleted in 10Be. Consequently, denudation in the Rapti basin upstream of the MBT may have also remained steady 584 at ~0.3 mm a–1 since ~3 Ma. These 10Be-derived denudation rates are consistent with those derived from detrital 585 and in situ thermochronological data. They also suggest varied denudation rates across the range that are likely 586 controlled by deformation of the structural wedge and orographic effects. Our results argue against accelerated 587 Quaternary denudation rates inferred from inversion of 1D thermochronological data, and instead suggest a limited 588 impact of Quaternary climatic oscillations on Himalayan denudation rates. However, testing the impact of 589 glaciations on Himalayan denudation at this scale requires cosmogenic data directly recording denudation during 590 3–0 Ma, which is complicated in the Surai section by basin reorganisation 4–3 Ma ago. Nevertheless, our study 591 demonstrates that it is possible to reconstruct palaeodenudation rates from the in situ 10Be concentrations of buried 592 Siwalik sediments, as long as sediment sources and recycling are traced via several geochemical proxies.
593
594 Acknowledgements
595 This study was funded by the ANR CALIMERO. This is CRPG contribution n° 2738. The authors have no conflict 596 of interest to declare. The data that support the study are available in the tables of the main manuscript or in the 597 supplementary information. We are grateful for the detailed evaluation and reviews provided by T.
598 Schildgen G. Burch Fisher, M. Oskin and D. Scherler. Their comments and suggestions permitted to
599 improve the manuscript and clarify some issues.
600
601 Bibliography
602 Adams, B.A., Hodges, K. V, Whipple, K.X., Ehlers, T.A., Soest, M.C., Wartho, J., 2015. Constraints on the 603 tectonic and landscape evolution of the Bhutan Himalaya from thermochronometry. Tectonics 1329–1347. 604 https://doi.org/10.1002/2015TC003853.Received
605 Appel, E., Rosler, W., Corvinus, G., Munchen, O., 1991. Magnetostratigraphy of the Miocene-Pleistocene Surai 606 Khola Siwaliks in West Nepal 191–198.
607 Auden, J.B., 1935. Traverses in the Himalaya. Rec. Geol. Surv. India 69, 123–167.
608 Bernet, M., van der Beek, P., Pik, R., Huyghe, P., Mugnier, J.-L., Labrin, E., Szulc, A., 2006. Miocene to Recent 609 exhumation of the central Himalaya determined from combined detrital zircon fission-track and U/Pb 610 analysis of Siwalik sediments, western Nepal. Basin Res. 18, 393–412.
https://doi.org/10.1111/j.1365-611 2117.2006.00303.x
612 Blard, P.-H., Lupker, M., Rousseau, M., Tesson, J., 2019. Two MATLAB programs for computing paleo-613 elevations and burial ages from paired-cosmogenic nuclides. MethodsX 6, 1547–1556.
614 Blythe, A.E., Burbank, D.W., Carter, A., Schmidt, K., Putkonen, J., 2007. Plio-Quaternary exhumation history of 615 the central Nepalese Himalaya: 1. Apatite and zircon fission track and apatite [U-Th]/He analyses.
616 Tectonics 26. https://doi.org/10.1029/2006tc001990
617 Bojar, A.V., Fritz, H., Nicolescu, S., Bregar, M., Gupta, R.P., 2005. Timing and mechanisms of Central 618 Himalayan exhumation: Discriminating between tectonic and erosion processes. Terra Nov. 17, 427–433. 619 https://doi.org/10.1111/j.1365-3121.2005.00629.x
620 Bollinger, L., Henry, P., Avouac, J.P., 2006. Mountain building in the Nepal Himalaya : Thermal and kinematic 621 model. Earth Planet. Sci. Lett. 244, 58–71. https://doi.org/10.1016/j.epsl.2006.01.045
622 Braucher, R., Merchel, S., Borgomano, J., Bourlès, D.L., 2011. Production of cosmogenic radionuclides at great 623 depth : A multi element approach. Earth Planet. Sci. Lett. https://doi.org/10.1016/j.epsl.2011.06.036 624 Braun, J., 2005. Quantitative Constraints on the Rate of Landform Thermochronology. Rev. Mineral. 625 Geochemistry 58, 351–374. https://doi.org/10.2138/rmg.2005.58.13
626 Brewer, I.D., Burbank, D.W., Hodges, K. V, 2003. Modelling detrital cooling-age populations : insights from 627 two Himalayan catchments. Basin Res. 15, 305–320.
628 Brown, E.T., Stallard, R.F., Larsen, M.C., Raisbeck, G.M., Yiou, F., 1995. Denudation rates determined from 629 the accumulation of in situ produced 10Be in the Luquillo experimental forest, Puerto-Rico. Earth Planet. 630 Sci. Lett. 129, 193–202.
631 Burbank, D.W., Derry, L.A., France-Lanord, C., 1993. Reduced Himalayan sediment production 8 Myr ago 632 despite an intensified monsoon. Nature 364, 48–50.
633 Charreau, J., Blard, P.-H., Zumaque, J., Martin, L.C.P., Delobel, T., Szafran, L., 2019. Basinga: A cell-by-cell 634 GIS toolbox for computing basin average scaling factors, cosmogenic production rates and denudation 635 rates. Earth Surf. Process. Landforms 44, 2349–2365.
636 Charreau, J., Blard, P.H., Puchol, N., Avouac, J.P., Lallier-Vergès, E., Bourlès, D., Braucher, R., Gallaud, A., 637 Finkel, R., Jolivet, M., Chen, Y., Roy, P., 2011. Paleo-erosion rates in Central Asia since 9Ma: A transient 638 increase at the onset of Quaternary glaciations? Earth Planet. Sci. Lett. 304, 85–92.
639 https://doi.org/10.1016/j.epsl.2011.01.018
640 Charreau, J., Chen, Y., Gilder, S., Barrier, L., Dominguez, S., Augier, R., Sen, S., Avouac, J.-P., Gallaud, A., 641 Graveleau, F., Wang, Q., 2009. Neogene uplift of the Tian Shan Mountains observed in the magnetic 642 record of the Jingou River section (northwest China). Tectonics 28, 1–22.
643 https://doi.org/10.1029/2007TC002137
644 Clift, P.D., 2006. Controls on the erosion of Cenozoic Asia and the flux of clastic sediment to the ocean. Earth 645 Planet. Sci. Lett. 241, 571–580.
646 Corvinus, G., Rimal, L.N., 2001. Biostratigraphy and geology of the Neogene Siwalik Group of the Surai Khola 647 and Rato Khola areas in Nepal. Palaeogeogr. Palaeoclimatol. Palaeoecol. 165, 251–279.
648 Craw, D., Koons, P.O., Zeitler, P.K., Kidd, W.S.F., 2005. Fluid evolution and thermal structure in the rapidly 649 exhuming gneiss complex of Namche Barwa – Gyala Peri , eastern Himalayan syntaxis. J. Metamorph. 650 Geol. 23, 829–845. https://doi.org/10.1111/j.1525-1314.2005.00612.x
651 DeCelles, P.G., Gehrels, G.E., Quade, J., Ojha, T.P., Kapp, P.A., Upreti, B.N., 1998. Neogene foreland basin 652 deposits, erosional unroofing, and the kinematic history of the Himalayan fold-thrust belt, western Nepal. 653 Geol. Soc. Am. Bull. 2–21.
654 Deniel, C., Vidal, P., Fernandez, A., Le Fort, P., Peucat, J.J., 1987. Isotopic study of the Manaslu granite 655 (Himalaya, Nepal): inferences on the age and source of Himalayan leucogranites. Contrib. to Mineral. 656 Petrol. 96, 78–92. https://doi.org/10.1007/BF00375529
657 Dhital, M.R., Gajurel, A.P., Pathak, D., Paudel, L.P., Kizaki, K., 1995. Geology and structure of the Siwaliks 658 and Lesser Himalaya in the Surai Khola–Bardanda area, Mid Western Nepal. Bull. Dept. Geol. Tribhuvan
659 Univ. 4, 1–70.
660 Dubille, M., Lavé, J., 2015. Rapid grain size coarsening at sandstone/conglomerate transition: Similar expression 661 in Himalayan modern rivers and Pliocene molasse deposits. Basin Res. 27, 26–42.
662 https://doi.org/10.1111/bre.12071
663 France-Lanord, C., Derry, L., Michard, A., 1993. Evolution of the Himalaya since Miocene time: isotopic and 664 sedimentological evidence from the Bengal Fan. Geol. Soc. London, Spec. Publ. 74, 603–621.
665 https://doi.org/10.1144/GSL.SP.1993.074.01.40
666 France-Lanord, C., Evans, M., Hurtrez, J.E., Riotte, J., 2003. Annual dissolved fluxes from Central Nepal rivers: 667 Budget of chemical erosion in the Himalayas. Comptes Rendus - Geosci. 335, 1131–1140.
668 https://doi.org/10.1016/j.crte.2003.09.014
669 Gansser, A., 1964. Geology of the Himalayas, Wiley. ed.
670 Garzanti, E., Vezzoli, G., Andò, S., Lavé, J., Attal, M., France-lanord, C., Decelles, P., 2007. Quantifying sand 671 provenance and erosion ( Marsyandi River , Nepal Himalaya ) 258, 500–515.