HAL Id: anses-01875227
https://hal-anses.archives-ouvertes.fr/anses-01875227
Submitted on 26 May 2021
HAL is a multi-disciplinary open access
archive for the deposit and dissemination of
sci-entific research documents, whether they are
pub-lished or not. The documents may come from
teaching and research institutions in France or
abroad, or from public or private research centers.
L’archive ouverte pluridisciplinaire HAL, est
destinée au dépôt et à la diffusion de documents
scientifiques de niveau recherche, publiés ou non,
émanant des établissements d’enseignement et de
recherche français ou étrangers, des laboratoires
publics ou privés.
relationship between adult obesity and socio-economic
status: the French second National Individual Survey on
Food Consumption (INCA 2) dietary survey (2006–07)
F. Fillol, Carine Dubuisson, Lionel Lafay, Ariane Dufour, Mélanie Bertin,
Mathilde Touvier, Bernard Maire, Jean-Luc Volatier, Sandrine Lioret
To cite this version:
F. Fillol, Carine Dubuisson, Lionel Lafay, Ariane Dufour, Mélanie Bertin, et al.. Accounting for the
multidimensional nature of the relationship between adult obesity and socio-economic status: the
French second National Individual Survey on Food Consumption (INCA 2) dietary survey (2006–07).
British Journal of Nutrition, Cambridge University Press (CUP), 2011, 106 (10), pp.1602 - 1608.
�10.1017/S0007114511002030�. �anses-01875227�
Accounting for the multidimensional nature of the relationship between adult
obesity and socio-economic status: the French second National Individual
Survey on Food Consumption (INCA 2) dietary survey (2006– 07)
F. Fillol
1, C. Dubuisson
1, L. Lafay
1, A. Dufour
1, M. Bertin
1, M. Touvier
1, B. Maire
2, J.-L. Volatier
3and S. Lioret
1*
1Dietary Survey Unit – Nutritional Epidemiology, French Food Safety Agency (Afssa), Maisons-Alfort, France 2UMR 204 Nutripass (IRD, UM1, UM2, SupAgro), Montpellier, France
3Office of Scientific Support for Risk Assessment, French Food Safety Agency (Afssa), Maisons-Alfort, France (Received 19 May 2010 – Revised 14 March 2011 – Accepted 17 March 2011 – First published online 2 June 2011)
Abstract
The objective was to study the multidimensional nature of the relationship between adult obesity (OB) and socio-economic status (SES), using comprehensive indices of SES taken separately or synthesised in an overall index. A nationally representative sample of adults aged 18 – 79 years was taken from the French second National Individual Survey on Food Consumption (INCA 2) dietary survey (2006 – 07). Weight and height were measured and OB defined as BMI $ 30 kg/m2. SES variables were reported in questionnaires and included occupation, education and characteristics of household wealth. Composite indices of SES (household wealth and overall SES indices) were computed by correspondence analysis, and relationships with OB were investigated with logistic regression analysis. In total, 11·8 (95 % CI 10·1, 13·4) % of French adults were obese, without significant difference by sex. While no significant relationship was observed in men, all SES indicators were inversely correlated to OB in women. Both education and the household wealth index were retained in the stepwise multivariate model, confirming that different socio-economic variables are not necessarily proxies of each other regarding the OB issue. On the other hand, ‘controlling for SES’ while including several measures of SES in multivariate models may lead to collinearity, and thus over-adjustment. A more integrative approach may be to derive a synthetic index by including the SES factors available in a given study. Beyond this methodological perspective, understanding how OB is related to the different dimensions of SES should help to target the more vulnerable groups and increase the effectiveness of prevention.
Key words:Adults: Obesity: Socio-economic status: Composite indices
Income and education have frequently been used to describe socio-economic status (SES) in the USA, while occupation has
been more widely included in European studies(1). Using
these indicators, the inverse association between obesity (OB) and SES among adults has been well documented in
industrialised countries(2,3), including France(4 – 6). However,
the relationship of SES to OB is likely to vary according to the dimension used to define the socio-economic position. On the one hand, different socio-economic factors cannot
be assumed to be interchangeable(1). On the other hand,
‘con-trolling for SES’ while including several measures of SES in multivariate epidemiological models may lead to collinearity and over-adjustment. Thus, recent reviews have emphasised the relevance of studying several SES factors, either separately
or synthesised within a composite index(7,8). In this context,
we used the data from the French second National Indivi-dual Survey on Food Consumption (INCA 2) dietary survey (2006 – 07) to investigate the associations between adult OB and comprehensive dimensions of SES: education, occupation and household wealth. These relationships were explored in a methodological perspective both considering these three factors independently and deriving composite indices.
Research methods and procedures Subjects and study design
The cross-sectional French INCA 2 dietary survey (2006 – 07) was primarily designed to assess food intake patterns of a nationally
representative sample(9,10). Briefly, subjects were drawn on
the basis of a multistage cluster sampling technique(11).
* Corresponding author: Dr Sandrine Lioret, fax þ 61 3 9244 6017, email sandrine.lioretsuteau@deakin.edu.au
Abbreviations: ENNS, French Nutrition and Health Survey; INCA 2, second National Individual Survey on Food Consumption; OB, obesity; preOB, pre-obesity; SES, socio-economic status.
qThe Authors 2011
British
Journal
of
Nutrition
https://www.cambridge.org/core . IP address: 78.202.154.114 , on 26 May 2021 at 12:10:26, subject to the Cambridge Core terms of use, available at
https://www.cambridge.org/core/terms
.
The sampling frame was established from the national census, with a response rate of 63 % in adults. The present study included 2324 adults from the 2624 subjects aged between 18 and 79 years (twenty-eight pregnant women were excluded along with 272 individuals with missing data).
The INCA 2 survey was approved by the French data protection authority (Commission Nationale Informatique et des Liberte´s; CNIL) and the French national council for statistical information (Conseil National de l’Information Statis-tique; CNIS).
Measurements
Demographics. We considered three groups of age: 18 – 34,
35 – 54 and 55 – 79 years.
Anthropometrics. Anthropometric data were collected
during home visits by trained interviewers. Weight measure-ments were taken to the nearest 0·1 kg in light clothes using electronic scales (Terraillon, France). Height was measured to the nearest cm, in a standing position, with a portable
gauge. BMI was calculated as weight/height2 (in kg/m2).
Pre-obesity (preOB) and OB were defined according to the
WHO definition(12).
Socio-economic status. A face-to-face questionnaire
included questions on occupational status, education level, and household wealth related to ‘having gone away on holiday for more than 4 days within the last 12 months’
(yes/no), ‘the number of cars in the household’, ‘the number of domestic electrical appliances’, ‘how the financial situation is perceived’ (positively/negatively), ‘financial access to desired food products’ (yes/no), ‘whether the idea of lacking food would be a concern’ (yes/no), ‘giving up health care for financial reasons’ (yes/no), ‘housing occupation status’ (first-time buyer/owner/tenant/tenant in social housing and others) and ‘household income’. Occupational status was divided into six categories: ‘executive and top management’, ‘middle professions’, ‘farmers and skilled blue-collar workers’, ‘retired’, ‘unemployed and manual workers’ and ‘homemakers and students’. Education level was divided into three cate-gories: primary, secondary and high school, university. Household income was divided into a further three categories: ‘ , 1300’, ‘1300 to , 2500’, ‘2500 or more’ euros/month.
Geographical variables. Subjects were classified into
North, South or Paris area according to their region of living. The conglomerate size was divided into two classes: ,100 000 inhabitants and $ 100 000 inhabitants.
Statistical analyses
Analyses were computed on STATA software (release 10; StataCorpLP, College Station, TX, USA). In the initial INCA 2 sample, men and women represented 41·4 and 58·6 % of the population, respectively. With regards to the national data published in 2005 by INSEE (French National Institute
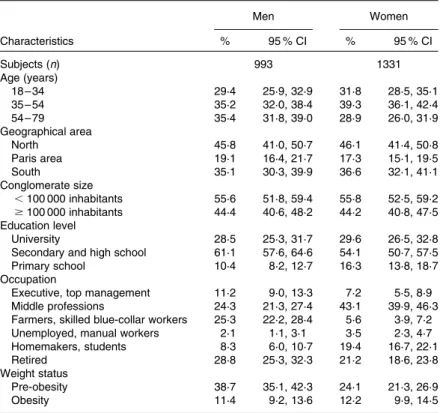
Table 1. Characteristics by sex of French adults included in the second National Individual Survey on Food Consumption (INCA 2) study*
(Percentages within characteristics and 95 % confidence intervals)
Men Women Characteristics % 95 % CI % 95 % CI Subjects (n) 993 1331 Age (years) 18 – 34 29·4 25·9, 32·9 31·8 28·5, 35·1 35 – 54 35·2 32·0, 38·4 39·3 36·1, 42·4 54 – 79 35·4 31·8, 39·0 28·9 26·0, 31·9 Geographical area North 45·8 41·0, 50·7 46·1 41·4, 50·8 Paris area 19·1 16·4, 21·7 17·3 15·1, 19·5 South 35·1 30·3, 39·9 36·6 32·1, 41·1 Conglomerate size ,100 000 inhabitants 55·6 51·8, 59·4 55·8 52·5, 59·2 $100 000 inhabitants 44·4 40·6, 48·2 44·2 40·8, 47·5 Education level University 28·5 25·3, 31·7 29·6 26·5, 32·8
Secondary and high school 61·1 57·6, 64·6 54·1 50·7, 57·5
Primary school 10·4 8·2, 12·7 16·3 13·8, 18·7
Occupation
Executive, top management 11·2 9·0, 13·3 7·2 5·5, 8·9
Middle professions 24·3 21·3, 27·4 43·1 39·9, 46·3
Farmers, skilled blue-collar workers 25·3 22·2, 28·4 5·6 3·9, 7·2
Unemployed, manual workers 2·1 1·1, 3·1 3·5 2·3, 4·7
Homemakers, students 8·3 6·0, 10·7 19·4 16·7, 22·1
Retired 28·8 25·3, 32·3 21·2 18·6, 23·8
Weight status
Pre-obesity 38·7 35·1, 42·3 24·1 21·3, 26·9
Obesity 11·4 9·2, 13·6 12·2 9·9, 14·5
* Results were weighted for unequal sampling probabilities and for differential non-responses by region, conglomerate size, age, sex, occupation of the household head, size of the household and season.
Socio-economic status and obesity 1603
British
Journal
of
Nutrition
https://www.cambridge.org/core . IP address: 78.202.154.114 , on 26 May 2021 at 12:10:26, subject to the Cambridge Core terms of use, available at
https://www.cambridge.org/core/terms
.
of Statistics and of Economic Studies)(13), women were over-represented. The youngest (, 35 years) and the oldest (. 64 years) individuals were slightly under-represented. Regarding occupational status, rates were quite comparable. Consequently, to ensure the national representativeness of the final sample, data were weighted for unequal sampling probabilities and for differential non-responses using a
post-stratification algorithm(14) according to sociodemographic
criteria: region, size of urban area, size of household, sex, age, occupation of the household head, and season. Results showed in the present paper take into account this weighting procedure. P, 0·05 was used as the threshold for significance. Composite indices of SES were derived from correspon-dence analysis. First, the household wealth composite index was built taking into account all measures of wealth pre-viously described, except household income (the latter due to 20 % missing values). Second, the overall SES composite index was derived from occupational status, educational level and the variables describing household wealth (except
household income). In both correspondence analyses, the score of each subject on the first principal component was used as the summary index, which was divided into tertiles. The two composite indices were then compared with the household income, occupational status and educational level for both internal and external validation.
All analyses were stratified by sex. To compare frequencies,
x2tests were used. Associations between OB (as the
depen-dent variable) and each of the four SES indicators (occupation, education, household wealth composite index, and overall SES index) were estimated using age-adjusted logistic regre-ssions. We then performed two sets of multivariate models including (along with demographic and geographical covari-ates): (1) education, occupation and the household wealth composite index; and (2) only the overall SES composite index. In both cases, stepwise logistic regressions were per-formed: critical P values that selected SES factors were set at P¼ 0·10.
Table 2. Characteristics of the first dimensions – household wealth composite index and overall socio-economic status (SES) composite index – derived from the two correspondence analyses (n 2324)
Household wealth composite index*
Overall SES composite index†
Variable categories Coordinates Contribution Coordinates Contribution
Having gone away on holiday for more than 4 days within the last 12 months
No 21·143 0·050 21·373 0·058
Yes 0·510 0·022 0·613 0·026
Number of cars in the household
0 22·785 0·100 22·814 0·082
$1 0·321 0·012 0·324 0·009
Number of domestic electrical appliances
,4 20·556 0·009 20·389 0·003
$4 0·160 0·002 0·112 0·001
How the financial situation is perceived
Negatively 21·292 0·094 21·384 0·086
Positively 1·062 0·077 1·137 0·071
Financial access to desired foods
No 22·541 0·149 22·564 0·121
Yes 0·574 0·034 0·579 0·027
Whether the idea of lacking food would be a concern
Yes 23·704 0·148 23·827 0·126
No 0·574 0·034 0·360 0·012
Giving up health care for financial reasons
Yes 23·273 0·131 23·188 0·100
No 0·356 0·014 0·347 0·011
Housing occupation status
Tenant in social housing and others 21·707 0·065 21·847 0·061
Tenant 20·966 0·025 20·863 0·016
First-time buyer or owner 0·842 0·054 0·847 0·044
Education level
Primary school – – 20·757 0·007
Secondary and high school – – 20·428 0·010
University – – 1·109 0·038
Occupation
Unemployed, manual workers – – 23·005 0·028
Farmers, skilled blue-collar workers – – 20·829 0·009
Middle professions – – 0·084 0
Executive, top management – – 1·821 0·032
Homemakers, students – – 21·020 0·013
Retired – – 0·593 0·008
* Accounted for 90·8 % of the explained variance. † Accounted for 71·4 % of the explained variance.
British
Journal
of
Nutrition
https://www.cambridge.org/core . IP address: 78.202.154.114 , on 26 May 2021 at 12:10:26, subject to the Cambridge Core terms of use, available at
https://www.cambridge.org/core/terms
.
Results
A total of 272 adults were excluded from the analyses due to missing data. In particular, 255 adults refused to be measured. The subjects excluded from the analyses did not differ from the others in terms of age and socio-economic variables.
Rates of preOB and OB were 31·4 (95 % CI 29·1, 33·7) and 11·8 (95 % CI 10·1, 13·4) %, respectively. Prevalence of preOB was significantly higher in men (38·7 %) than in women (24·1 %) (P, 0·0001), whereas no significant difference was observed in the prevalence of OB according to sex (Table 1). The prevalence of preOB and OB increased with age in both
men (preOB18 – 34 years¼ 23·3 (95 % CI 17·1, 29·5) %,
preOB35 – 54 years¼ 39·4 (95 % CI 33·8, 45·0) %, preOB55 – 79
years¼ 50·9 (95 % CI 44·6, 57·2) %, P,0·0001; OB18 – 34 years¼ 6·3 (95 % CI 3·1, 9·6) %, OB35 – 54 years¼ 11·6
(95 % CI 7·9, 15·4) %, OB55 – 79 years¼ 15·4 (95 % CI 11·1, 19·6)
%, P¼ 0·006) and women (preOB18 – 34 years¼ 13·6 (95 % CI 9·5,
17·8) %, preOB35 – 54 years¼ 24·7 (95 % CI 20·2, 29·2) %,
preOB55 – 79 years¼ 34·7 (95 % CI 29·0, 40·4) %, P, 0·0001;
OB18 – 34 years¼ 4·3 (95 % CI 1·0, 7·6) %, OB35 – 54 years¼ 13·9
(95 % CI 9·9, 17·8) %, OB55 – 79 years¼ 18·6 (95 % CI 14·3, 22·9)
%, P, 0·0001).
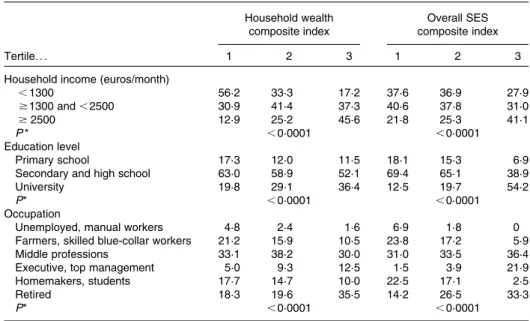
The two SES composite indices derived from correspon-dence analysis are described in Table 2. A high proportion of the variance was explained by the first axis in both cases, i.e. 90·8 % for the household wealth composite index and 71·4 % for the overall SES composite index. The interpretation of the second dimensions derived from both correspon-dence analyses was not straightforward. Consequently, only one dimension was retained in each case, which displayed gradients of wealth and overall SES, respectively. Table 3 further indicates good internal and external validation of
both composite indices regarding income, occupation and education.
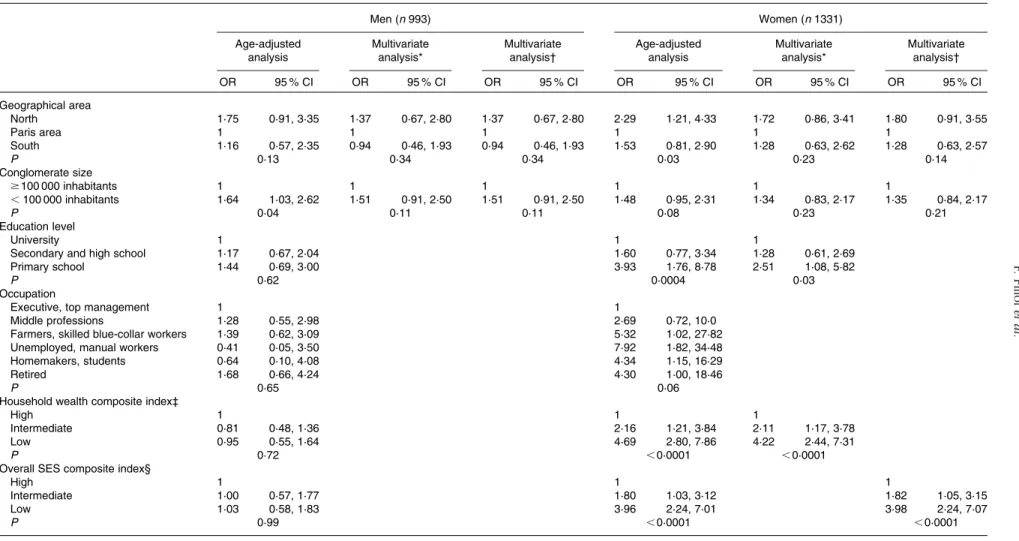
In women, education level, household wealth index and overall SES index were strongly and inversely associated with the prevalence of OB in the age-adjusted analyses, with ORhigh/low ranging from 3·93 to 4·69. The inverse association with occupation was only close to significance (P¼ 0·06). The latter factor was not retained in the stepwise multivariate model (Table 4). By contrast, none of the four SES indicators were significantly associated with the prevalence of OB in men. Further analyses undertaken with overweight (preOB þ OB) led to similar results in women (not shown). In men, overweight was slightly associated with lower education level and occupational status (P, 0·05), but not with either of the composite indices.
Discussion
The strengths of the present study are the estimation of preOB and OB rates in a representative sample of the national popu-lation based on objective measurements of height and weight. More importantly, on the behalf of comprehensive question-naires, we could investigate the relative association of differ-ent dimensions of SES to OB. We further derived composite indices (household wealth and overall SES), which is a
comp-lementary approach, rarely undertaken before(15). However,
some dimensions of SES were not taken into account in our analyses, notably the socio-economic characteristics of neigh-bourhoods, known to influence health through physical and
social features of the environment(16).
Our findings confirmed that low SES (as measured using the three dimensions: education, occupation, and house-hold wealth composite index) was associated with higher
Table 3. Relationships between the two composite indices and household income, education and occupation (n 2324)
(Percentages for each tertile)
Household wealth composite index
Overall SES composite index
Tertile. . . 1 2 3 1 2 3
Household income (euros/month)
,1300 56·2 33·3 17·2 37·6 36·9 27·9 $1300 and , 2500 30·9 41·4 37·3 40·6 37·8 31·0 $2500 12·9 25·2 45·6 21·8 25·3 41·1 P * ,0·0001 ,0·0001 Education level Primary school 17·3 12·0 11·5 18·1 15·3 6·9
Secondary and high school 63·0 58·9 52·1 69·4 65·1 38·9
University 19·8 29·1 36·4 12·5 19·7 54·2
P* ,0·0001 ,0·0001
Occupation
Unemployed, manual workers 4·8 2·4 1·6 6·9 1·8 0
Farmers, skilled blue-collar workers 21·2 15·9 10·5 23·8 17·2 5·9
Middle professions 33·1 38·2 30·0 31·0 33·5 36·4
Executive, top management 5·0 9·3 12·5 1·5 3·9 21·9
Homemakers, students 17·7 14·7 10·0 22·5 17·1 2·5
Retired 18·3 19·6 35·5 14·2 26·5 33·3
P* ,0·0001 ,0·0001
SES, socio-economic status. * By x2tests.
Socio-economic status and obesity 1605
British
Journal
of
Nutrition
https://www.cambridge.org/core . IP address: 78.202.154.114 , on 26 May 2021 at 12:10:26, subject to the Cambridge Core terms of use, available at
https://www.cambridge.org/core/terms
.
Table 4. Age-adjusted and multivariate analysis for obesity according to socio-economic and geographical factors among French adults in the second National Individual Survey on Food Consumption (INCA 2) study (analyses stratified by sex) (n 2324)
(Odds ratios and 95 % confidence intervals)
Men (n 993) Women (n 1331) Age-adjusted analysis Multivariate analysis* Multivariate analysis† Age-adjusted analysis Multivariate analysis* Multivariate analysis† OR 95 % CI OR 95 % CI OR 95 % CI OR 95 % CI OR 95 % CI OR 95 % CI Geographical area North 1·75 0·91, 3·35 1·37 0·67, 2·80 1·37 0·67, 2·80 2·29 1·21, 4·33 1·72 0·86, 3·41 1·80 0·91, 3·55 Paris area 1 1 1 1 1 1 South 1·16 0·57, 2·35 0·94 0·46, 1·93 0·94 0·46, 1·93 1·53 0·81, 2·90 1·28 0·63, 2·62 1·28 0·63, 2·57 P 0·13 0·34 0·34 0·03 0·23 0·14 Conglomerate size $100 000 inhabitants 1 1 1 1 1 1 ,100 000 inhabitants 1·64 1·03, 2·62 1·51 0·91, 2·50 1·51 0·91, 2·50 1·48 0·95, 2·31 1·34 0·83, 2·17 1·35 0·84, 2·17 P 0·04 0·11 0·11 0·08 0·23 0·21 Education level University 1 1 1
Secondary and high school 1·17 0·67, 2·04 1·60 0·77, 3·34 1·28 0·61, 2·69 Primary school 1·44 0·69, 3·00 3·93 1·76, 8·78 2·51 1·08, 5·82
P 0·62 0·0004 0·03
Occupation
Executive, top management 1 1
Middle professions 1·28 0·55, 2·98 2·69 0·72, 10·0 Farmers, skilled blue-collar workers 1·39 0·62, 3·09 5·32 1·02, 27·82 Unemployed, manual workers 0·41 0·05, 3·50 7·92 1·82, 34·48 Homemakers, students 0·64 0·10, 4·08 4·34 1·15, 16·29
Retired 1·68 0·66, 4·24 4·30 1·00, 18·46
P 0·65 0·06
Household wealth composite index‡
High 1 1 1
Intermediate 0·81 0·48, 1·36 2·16 1·21, 3·84 2·11 1·17, 3·78 Low 0·95 0·55, 1·64 4·69 2·80, 7·86 4·22 2·44, 7·31
P 0·72 ,0·0001 ,0·0001
Overall SES composite index§
High 1 1 1
Intermediate 1·00 0·57, 1·77 1·80 1·03, 3·12 1·82 1·05, 3·15
Low 1·03 0·58, 1·83 3·96 2·24, 7·01 3·98 2·24, 7·07
P 0·99 ,0·0001 ,0·0001
SES, socio-economic status.
* Multivariate logistic regressions of obesity including as independent variables: age (in three categories), the two geographical cofactors and the three SES indices (education, occupation and household wealth composite index). Stepwise multivariate logistic regressions were performed. In the final multivariate logistic model, SES covariates were retained if they were significant at the 10 % level.
† Multivariate logistic regressions of obesity including as independent variables: age (in three categories), the two geographical cofactors and the overall SES composite index. Stepwise multivariate logistic regressions were performed. In the final multivariate logistic model, the overall SES index was retained if it was significant at the 10 % level.
‡ Index derived from correspondence analysis including the following indices of ‘wealth’: ‘having gone on holiday for more than 4 days within the last 12 months’ (yes/no), ‘the number of cars in the household’, ‘the number of domestic electrical appliances,’ ‘how the financial situation is perceived’ (positively/negatively), ‘financial access to desired food products’ (yes/no), ‘whether the idea of lacking food would be a concern’ (yes/no), ‘giving up health care for financial reasons’ (yes/no), and ‘the housing occupation status’ (first-time buyer/owner/tenant/tenant in social housing and others).
§ Overall SES index derived from correspondence analysis including the occupational status, the educational level and the eight indices of wealth.
F. Fillol et al. Downloaded from https://www.cambridge.org/core . IP address: 78.202.154.114 , on 26 May 2021 at 12:10:26
, subject to the Cambridge Core terms of use, available at
https://www.cambridge.org/core/terms
.
prevalence of OB, but only in women. The fact that occu-pation was not retained in the stepwise multivariate analysis was the result of high collinearity between this variable and both education and household wealth status. In addition, occupational status is more likely to change over time than the other SES factors, leading to less consistent associations
with OB(17). By contrast, the level of education has been
suggested to influence long-term literacy, knowledge on nutri-tion, and health behaviours, which in turn are involved in
weight gain, particularly in women(18). A higher wealth
status may also facilitate access to healthy foods and physical
activity behaviours(19,20). The present results also showed that
the educational level and the household wealth status, although positively correlated, are not strict proxies for each other, because both variables were maintained in the stepwise regression model. The wealth status is likely to vary at similar
levels of education(1), with additional effects regarding weight
status. Consequently, both variables are worth considering with regards to OB in France, not only for epidemiological research but also for targeting the most vulnerable groups and organising health interventions.
Consistent with our findings, the inverse SES – OB relation-ship has more frequently been observed in women than in men(6,7,21). We might have lacked statistical power to show a significant relationship in men, due to rather small numbers. The higher social pressure and stigmatisation regarding weight status exerted amongst women may also partly explain this result. In fact, the cross-sectional design of the INCA 2 study is a limitation regarding causal inferences: it is likely that part of the relationships observed in women was due to
the effect of OB on socio-economic achievements(7). At similar
levels of education, it is also possible that men are less sensi-tive and thus compliant to health and nutritional guidelines. In addition, the lack of significant observation in men may be explained by the definition used for weight status. BMI does not allow distinguishing fat from lean mass, an issue
particularly sensitive in men(6). Low-status occupations are
more likely to involve strainful physical activity in men than
in women(22).
As the strength of the association between OB and SES depends on the dimension of SES considered, an overall syn-thetic index is certainly worth deriving when SES is included as a confounder of relationships between a given determinant and OB in multivariate epidemiological models. In fact, based on the observation that different dimensions of SES are neither interchangeable nor completely independent, a unique factor is certainly not enough to account for all the complexity (and thus variability) of SES. On the other hand, ‘controlling for SES’ while including several measures of SES in multivari-ate models may lead to collinearity, and thus over-adjustment and statistical instability. Stepwise analyses may help to avoid collinearity between these SES factors. A complementary and comprehensive approach may also be to derive an overall composite index while including the SES variables available in a given study (using correspondence analysis, for instance). The resulting index, which is data driven, cannot be compared easily with other data. However, it is an interesting internal tool for adjustment on SES; in addition, it is all the more
relevant since the variance accounted for by the composite dimension selected is relatively high, which was the case in our data.
PreOB and OB rates estimated from the INCA 2 study are consistent with those of the French Obepi survey conducted
in 2006(4). Although body weight and height were not
measured by investigators in the Obepi surveys (which have been performed every three years since 1997), subjects were asked to measure themselves with the aid of another house-hold member before reporting the anthropometric data. Con-sequently, underestimation of BMI should be limited. The French Nutrition and Health Survey (ENNS) is another national survey carried out in 2006 – 07, which included adults aged
18 – 74 years(6). Body weight and height were measured by
trained physicians, nurses or dietitians either at home or in health examination centres of the French National Health Insurance System. Estimated rates for preOB were similar between the INCA 2 and the ENNS surveys. However, esti-mated rates of OB were higher in the ENNS survey, i.e. 16·9 (95 % CI 14·8, 18·9) %. As stated by the authors, 2204 amongst the 5217 eligible subjects (i.e. 42 %) accepted to be involved in the ENNS health examination protocol (which included anthropometrics amongst other measurements). Therefore, a participation bias cannot be excluded. In the INCA 2 survey, as mentioned previously, 255 adults refused to be measured. Although the latter did not differ according to age and occu-pational status, we cannot exclude that the proportion of obese individuals in this subsample was higher than in the overall sample. It is therefore likely that the ‘true’ prevalence of adult OB in France is somewhere between the similar rates estimated in the INCA 2 and Obepi studies and the prevalence estimated in the ENNS study.
Rates of adult OB in France and other Western European countries are lower than those of the UK or Eastern European
countries(23). However, basing their analyses on the Obepi
data, Charles et al.(4) have highlighted that prevalence has
increased sharply in France since the 1990s, particularly in women and the lower SES groups. Their study showed that rates of OB in 2006 were three times as high in individuals earning less than 900 euros/month than in their counterparts living with more than 3600 euros monthly. These increasing disparities according to SES level in France have also been indicated by another French study, in which anthropometric
measurements were repeated over time(24). Similar trends
have been reported in other European countries(25), but not
in the USA(26).
In conclusion, our findings confirmed that different socio-economic variables are not necessarily proxies of each other,
and thus interchangeable(1). The different components of
SES not only represent different population groups but also point to different pathways, such as different behaviours, or
different critical periods of the life course(1,7). On the other
hand, when ‘controlling for SES’ in multivariate models, caution should be made regarding potential collinearity – and thus over-adjustment – if several SES factors are included simultaneously in the analyses. A more integrative approach could be to derive a synthetic SES index. Finally, understand-ing how OB is related to the different dimensions of SES Socio-economic status and obesity 1607
British
Journal
of
Nutrition
https://www.cambridge.org/core . IP address: 78.202.154.114 , on 26 May 2021 at 12:10:26, subject to the Cambridge Core terms of use, available at
https://www.cambridge.org/core/terms
.
should help to target the more vulnerable groups and increase the effectiveness of prevention.
Acknowledgements
The present study was supported by the French Food Safety Agency (Afssa).
The authors thank Pierre Traissac, from Institut de recherche pour le de´veloppement (IRD), for his expertise in correspon-dence analysis. The authors are also grateful to Catriona Holmes who provided editorial assistance.
F. F. and S. L. designed the study, analysed and interpreted the data and wrote the manuscript. L. L. and J.-L. V. designed, coordinated and supervised the survey. S. L., C. D., A. D., M. B. and M. T. contributed to the design of the survey and the data collection, and together with B. M. helped to write the paper.
None of the authors had a conflict of interest.
References
1. Braveman PA, Cubbin C, Egerter S, et al. (2005) Socio-economic status in health research: one size does not fit all. JAMA 294, 2879 – 2888.
2. Ball K, Mishra G & Crawford D (2002) Which aspects of socioeconomic status are related to obesity among men and women? Int J Obes 26, 559 – 565.
3. Sobal J & Stunkard AJ (1989) Socioeconomic status and obesity: a review of the literature. Psych Bull 105, 260 – 275. 4. Charles MA, Eschwege E & Basdevant A (2008) Moni-toring the obesity epidemic in France: The Obepi surveys 1997 – 2006. Obesity (Silver Spring) 16, 2182 – 2186.
5. de Saint Pol T (2009) Evolution of obesity by social status in France, 1981 – 2003. Econ Hum Biol 7, 398 – 404.
6. Vernay M, Malon A, Oleko A, et al. (2009) Association of socioeconomic status with overall overweight and central obesity in men and women: the French Nutrition and Health Survey 2006. BMC Public Health 9, 215.
7. Roskam AJ & Kunst AE (2008) The predictive value of different socio-economic indicators for overweight in nine European countries. Public Health Nutr 11, 1256 – 1266. 8. Wardle J, Waller J & Jarvis MJ (2002) Sex differences in the
association of socioeconomic status with obesity. Am J Public Health 92, 1299 – 1304.
9. Lioret S, Dubuisson C, Dufour A, et al. (2010) Trends in food intake in French children from 1999 to 2007: results from the INCA (e´tude Individuelle Nationale des Consommations Alimentaires) dietary surveys. Br J Nutr 103, 585 – 601. 10. Dubuisson C, Lioret S, Touvier M, et al. (2010) Trends in
food and nutritional intakes of French adults from 1999 to 2007: results from the INCA surveys. Br J Nutr 103, 1035 – 1048.
11. Dufour A, Lafay L & Volatier JL (2008) La mesure des consommations alimentaires par l’e´tude INCA2 (The measurement of food consumption by the INCA2 study). In Me´thodes de sondage (Sampling Methods), pp. 132 – 137 [P Guilbert, D Haziza, A Ruiz-Gazen and Y Tille´, editors]. Paris: Dunod.
12. World Health Organization (1997) Obesity: Preventing and Managing the Global Epidemic. Report on a WHO Consul-tation. WHO Technical Report Series no. 894. Geneva: WHO. 13. French National Institute of Statistics and of Economic Studies (INSEE) (2005) Enqueˆte emploi 2005 en continu (2005 Employment survey, continuous). http://www.insee. fr/fr/themes/detail.asp?ref_id¼fd-eec05
14. Sautory O (1993) La macro CALMAR – Redressement d’un e´chantillon par calage sur marges (SAS CALMARmacro – Adjustment of a sample using calibration on margins). Paris: INSEE. http://www.insee.fr/fr/methodes/outils/calmar/ doccalmar.pdf (accessed January 2011).
15. Turrell G, Hewitt B, Patterson C, et al. (2003) Measuring socio-economic position in dietary research: is choice of socio-economic indicator important? Public Health Nutr 6, 191 – 200.
16. Spittaels H, Foster C, Oppert JM, et al. (2009) Assessment of environmental correlates of physical activity: development of a European questionnaire. Int J Behav Nutr Phys Act 6, 39. 17. Liberatos P, Link BG & Kelsey JL (1988) The measurement of
social class in epidemiology. Epidemiol Rev 10, 87 – 121. 18. Sobal J (1991) Obesity and socioeconomic status: a
frame-work for examining relationships between physical and social variables. Med Anthropol 13, 231 – 247.
19. Darmon N & Drewnowski A (2008) Does social class predict diet quality? Am J Clin Nutr 87, 1107 – 1117.
20. Ball K & Crawford D (2005) Socioeconomic status and weight change in adults: a review. Soc Sci Med 60, 1987 – 2010.
21. McLaren L (2007) Socioeconomic status and obesity. Epidemiol Rev 29, 29 – 48.
22. Wardle J, Waller J & Jarvis MJ (2002) Sex differences in the association of socioeconomic status with obesity. Am J Public Health 92, 1299 – 1304.
23. Gallus S, Colombo P, Scarpino V, et al. (2006) Overweight and obesity in Italian adults 2004, and an overview of trends since 1983. Eur J Clin Nutr 60, 1174 – 1179.
24. De Saint Pol T (2008) Obesite et milieu sociaux en France: les inegalites augmentent (Social environment and obesity in France: the equalities are increasing). Bull Epidemiol Hebdo 20, 175 – 179.
25. Molarius A, Seidell JC, Sans S, et al. (2000) Educational level, relative body weight, and changes in their association over 10 years: an international perspective from the WHO MONICA Project. Am J Public Health 90, 1260 – 1268. 26. Zhang Q & Wang Y (2004) Trends in the association between
obesity and socioeconomic status in U.S. adults: 1971 to 2000. Obes Res 12, 1622 – 1632.
British
Journal
of
Nutrition
https://www.cambridge.org/core . IP address: 78.202.154.114 , on 26 May 2021 at 12:10:26, subject to the Cambridge Core terms of use, available at
https://www.cambridge.org/core/terms
.