Advanced Water and Wastewater Treatment: Implications and Prospects for the Construction Industry
by
Lindsay Ann Haugland S.B., Civil Engineering
Massachusetts Institute of Technology
Submitted to the Technology and Policy Program and the Department of Civil and Environmental Engineering
in Partial Fulfillment of the Requirements for the Degrees of
Master of Science in Technology and Policy and
Master of Science in Civil and Environmental Engineering
at the
Massachusetts Institute of Technology February 1994
) Massachusetts Institute of Technology All rights reserved
Signature of Author ... l... . .... ... ... ..
Certified by ...
Certified by ...
Ar,..ntA hv
awr
J.--e--e-7
Richard de NeufvilleChairman, Technology and Policy Program ' Thesis Supervisor
- -* ... **-*.
*-.*.-.*-.-. rred Moavenzadeh Professor of Civil ananvironmental Engineering -, J Thesis Supervisor
- ...
,"8~F~
... ...-
.
Joseph M. Sussman-- hian, Committee on Graduate Students
DRAWN SSACISEU$c:UE Ia ' L'I' ,RARIES _ - - --- - --- --- ---- ~e oe- , .--- r- ... ...
Advanced Water and Wastewater Treatment: Implications and Prospects for the Construction Industry
by
Lindsay Ann Haugland
Submitted to the Technology and Policy Program and the Department of Civil and Environmental Engineering in partial fulfillment of the requirements for the Degrees of
Master of Science in Technology and Policy and Master of Science in Civil and Environmental Engineering
ABSTRACT
Water pollution control is largely driven by two pieces of federal legislation: the Clean Water Act and the Safe Drinking Water Act. Compliance with these two acts and their subsequent amendments has resulted in tens of billions of dollars being spent by industry, municipalities, states and the federal government. The construction industry, however, has largely benefited from this outpouring of money.
This thesis examines the use of certain water pollution control technologies from the point of view of the construction industry. This is accomplished by looking at, for each
technology or technology group, the individual technologies; the market characteristics; the regulatory, legal and social environment; the market attractiveness to the construction industry; and the investment requirements. Lastly, within each technology group, a case study illustrates an example of the implementation and use of a given technology.
In particular, the issue of wastewater recycle and reclamation, and certain technologies associated with providing advanced levels of treatment, is examined. Second, ion exchange-used to remove nitrates, radionucleotides, and heavy metals from drinking water and municipal and industrial wastewater-is analyzed. Lastly, emerging chemical oxidation technologies are examined.
Thesis Supervisor: Fred Moavenzadeh, Ph.D.
Titile: Professor of Civil and Environmental Engineering Thesis Supervisor: Richard de Neufville, Ph.D.
Acknowledgements
I would like to thank the people at the Center for Construction Research and Education for financial assistance and guidance in writing this thesis. In particular, I would like to thank members of the Construction and the Environment Group: Professor Fred Moavenzadeh, Mr. Charles Helliwell, Mr. Kazushi Wakita, Mr. Yoshio Suto, Mr. Kozo Hagiya, and the other graduate students: Jennifer Griffith, Matt Steele, and Hank Taylor. I would also like to thank my Technology and Policy reader, Professor Richard de Neufville.
I'd also like to thank my friends, both here in Boston and elsewhere, for their
encouragement, support and laughter: Sekhar Ramanathan, Mort Webster, Judy Spunt, Kathleen Morgan, Harry Hochheiser, Dave Nowacek, Rachel Williams, Ed Pittman, and especially Bob Givan.
Table of Contents
page Chapter 1 Introduction
1. Introduction ... 15
1.1. Water Pollution and Environmental Legislation ... 18
1.2. Pollution Control and the Construction Industry ... 24
1.3. Thesis Objectives ... 26
Chapter 2 Wastewater and Water Recycle and Reclamation
2.1.
Introduction ...
29
2.1.1. The Relation of Potable Water to Reclaimed Water ...30
2.1.2. Zero Discharge and Sludge Recycling ... 41
2.1.3. Developing Countries vs. the Industrialized World ... 47
2.1.4. Public Health and Ecological Risks...48
2.1.5. Water Rights ... ... 52
2.1.6. Environmental Concerns... 55
2.1.7. Demand Side Management... ... ... 56
2.1.8. Uses for Reclaimed Wastewater...57
2.1.9. General Considerations ... 58
2.1.10. Public Resistance ... ... 59
2.2. Technology Descriptions ... 59
2.2.1. Aquifer Storage Recovery (ASR) . ... 59
2.2.1.1. General Background . ... 59
2.2.1.2. ASR for Subsurface Water Storage . ... 60
2.2.1.3. Requirements for an ASR System ... ... 60
2.2.1.4. Objectives for an ASR System ... 61
2.2.1.5. Aquifer Recharge ... ... 61 2.2.1.6. Environmental Issues . ... ... 62 2.2.1.7. Permitting... 62
2.2.1.8. Economics...
... 62
2.2.2. Natural Systems ... 63 2.2.2.1. Constructed Wetlands ... 65 2.2.2.2. Aquaculture Facilities ... 67 2.2.2.3. Greenhouse-Type Facilities ... 682.2.3. Membrane Separation Technologies ... 70
2.2.3.1. Electrodialysis Reversal (EDR) ... 75
2.2.3.2. Reverse Osmosis (RO) ... 78
2.2.3.3. Ultrafiltration (UF) ... 84
2.2.3.4. Microfiltration (MF) ... 86
2.2.3.5. Nanofiltration (NF) ... .. 86
2.3. Regulatory and Social Acceptability ... 88
2.3.1. Regulatory Acceptability . ... 88
2.3.2. Social Acceptability... 89
2.4. Market Characteristics ... 93
2.5. Market Attractiveness to the Construction Industry ... 97
2.5.1. Strategic Attractiveness ... 97
2.5.2. Cost Effectiveness for the Customer ... 99
2.5.3. Suitability ... 99
2.6. Investment Requirements ... 102
2.7.1. Aquifer Storage Recovery Case Study ... 103
2.7.2. Natural System Case Study ... 105
2.7.3. Membrane Separation Process Case Study ... 106
2.7.4. Wastewater Recycle Case Study ... ... 108
2.8. Conclusions ... 109
Chapter 3 Chemical Oxidation
3.1.
Introduction ...
117
3.2.
Technology Descriptions .
...
... 119
3.2.1. Supercritical Water Oxidation (SCWO)... 121
3.2.2. Wet Oxidation (WO) ... 129
3.2.3. Advanced Oxidation Processes ... 134
3.2.3.1. Ozone/Ultraviolet Systems ... 135
3.2.3.2. Hydrogen Peroxide/Ultraviolet Systems ... 136
3.2.3.3. High-Energy Electron Beam Systems . ... 137
3.2.3.4. Ultrasound Systems ... 138
3.2.3.5. Photocatalytic Oxidation Systems ... 139
3.2.3.6. Remaining Systems ... 141
3.3. Regulatory and Social Acceptability. ... 141
3.3.1. Legal and Regulatory Acceptability ... 142
3.3.2. Associated Liability ... 142
3.3.3. Public Opinion ... 143
3.3.4. Political Acceptability ... 144
3.3.5. Related Public Health and Environmental Issues ... 145
3.4. 3.4. Market Characteristics ...Market Characteristics.146 146 3.4.1. General Market Characteristics ... 146
3.4.2. Development of SCWO and WO . ... 148
3.4.3. Development of Other AOPs ... 151
3.5. Market Attractiveness to the Construction Industry ... 151
3.5.1. Strategic Attractiveness ... 152
3.5.2. Cost Effectiveness for the Customer ... 152
3.5.3. Suitability for the Construction Industry ... 153
3.6. Investment Requirements... 153
3.7. Case Study... 154
3.7.1. Electron Beam Treatment System: Miami, Florida ... 154
3.8.
Conclusions...
Chapter 4 Ion Exchange4.1.
Introduction ...
163
4.2. Technology Descriptions .164 4.2.1. General Descriptions ... 164
4.2.2. General Ion Exchange Chemistry . ... 166
4.2.3. Characteristics of Ion Exchangers ... 170
4.2.4. Ion Exchange Systems... 175
4.2.5. Specific Ion Exchange Systems ... 177
4.2.5.1. Water Softening ... 177
4.2.5.2. Nitrate Removal ... 177
4.2.5.3. Ammonium Ion Reduction ... 179
4.2.5.4. Removal of Radionucleotides ... 181
4.2.5.5. Activated Alumina ... ... 182
4.2.5.6. Metal Removal ... ...189
4.2.5.8. Small-Scale Drinking Water Facilities ... 189
4.3. Regulatory and Social Acceptability ... 190
4.3.1. Legal and Regulatory Acceptability ... ... 190
4.3.2. Associated Liability ... 191
4.3.3. Public Opinion ... 191
4.3.4.
Political Acceptability .
...
191
4.3.5. Related Public Health and Environmental Issues ... 191
4.4. Market Characteristics ... 192
4.4.1. General Market Characteristics . ... ... 193
4.4.2. Manufacturers of Resins and Systems...193
4.4.3. Patents and Patentability ... 197
4.5. Market Attractiveness to the Construction Industry ... 198
4.5.1. Strategic Attractiveness ... 198
4.5.2. Cost Effectiveness for the Customer ... ... .. 1991...
4.5.3.
Suitability.
... 200
4.6. Investment Requirements ... 201
4.7. Case Studies ... 201
4.7.1. Nitrate Removal: McFarland, California ... 202
4.7.2. Uranium Removal: Coal Creek, Colorado ... ... 207
4.8.
Conclusions ...
212
Chapter 5 Conclusion
5.1.
Conclusion ...
217
List of Tables
page
1.1. Water Treatment Processes Considered for Best Available Technology ...23
2.1. Water Use in the United States, 1955-1985 ... 34
2.2. Possible Contaminants and Options for Treatment ... 39
2.3. Aquifer Storage Recovery Facilities in the United States ... 60
2.4. Typical Objectives of Aquifer Storage Recovery ... 61
2.5. ASR Economics ... 63
2.6. Average Construction Costs for Two Types of Wetlands Designed to Treat
Wastewater
...
...
...
67
2.7 Average Performance Data, January 1988 to March 1989 ... 70
2.8. A Comparison of Membrane Separation Technologies ... 72
2.9. Costs for a 90% Recovery Electrodialysis System for Metals ... 78
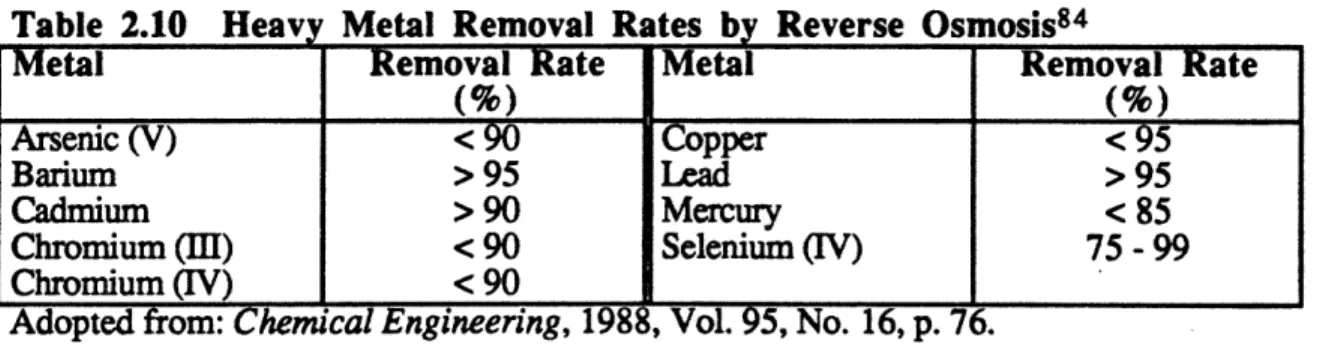
2.10. Heavy Metals Removal Rates by Reverse Osmosis ... 79
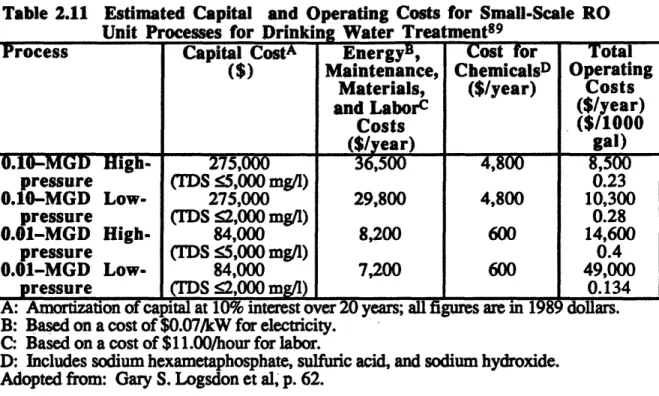
2.11. Estimated Capital and Operating Costs for Small-Scale RO Unit Processes for Drinking Water Treatment ... 82
2.12. Costs for a 95% Recovery Reverse Osmosis System for Metals ... 83
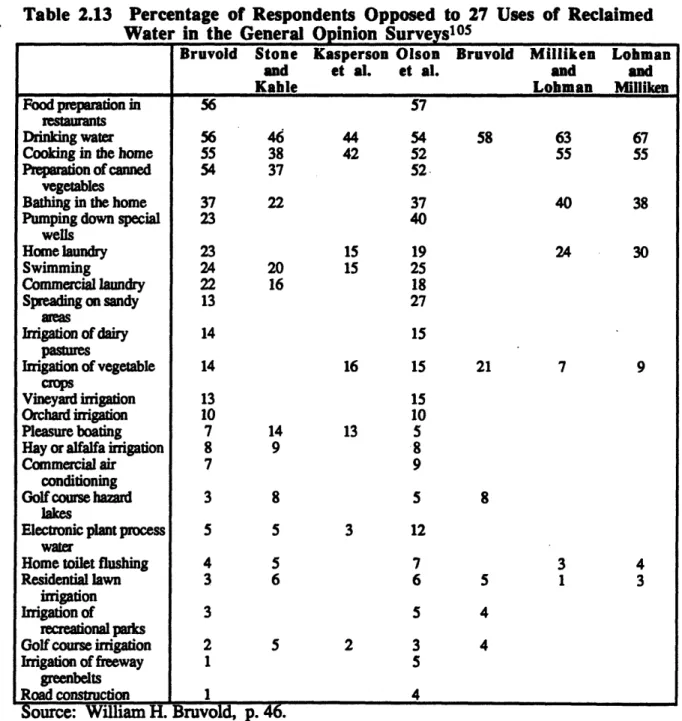
2.13. Percentage of Respondents Opposed to 27 Uses of Reclaimed Water in the General Opinion Surveys ... 91
2.14. Needs for Publicly Owned Wastewater Treatment Facilities ... 95
2.15. Treatment Facilities by Level of Treatment ... 95
2.16. Construction Costs of Reclaimed Water Improvements in Florida ... 101
2.17. Treatment Costs for Title 22 Water ... ... ... 101
2.18. Distribution/User Costs ...
...
... 102
3.1.. Wastewater Characteristics by Industry... ... 118
3.2. Reactivity of Various Oxidants with Common Pollutants ... 120
3.3. Operating Parameters of SCWO and Incineration ... 123
3.4. SCWO Destruction Efficiency: Organic Compounds ... 125
3.5. SCWO Destruction Efficiency: Wastewaters and Sludges ... 126
3.6. Capital Costs of Air- and Oxygen- Based Wet Oxidation Systems With and Without Steam Generation ... 132
3.7. Operating and Total Costs of Air- and Oxygen- Based Wet Oxidation Systems With and Without Steam Generation ... 133
3.8. Typical AOP Systems ... 135
3.9. Photocatalytic Dissociation of Organic Mixture by TiO2-Pt. ... 140
3.10. Capital and Operating Costs for E-Beam Iadiation of TCE-Contaminated
Water ...
156
3.11. Removal Efficiencies for Electron Beam Iradiation of Various Water Contaminants... 159
4.1. Selected Naturally Occurring Zeolites ... 165
4.2. Properties of Regenerants . ... 167
4.3. Qualitative Affinity of Common Ions for Various Resin Types ... 169
4.4. Ion Exchangers Containing Specific Groups Selective for Particular Ions ... 174
4.5. Maximum Concentration Allowed for Discharge of Selected Metals ... 184
4.6 Removal Efficiencies Achievable for Selected Metals by Ion Exchange ... 185
4.7. Metal-Bearing RCRA Wastewaters Amenable to Ion Exchange ... 186
4.8. RCRA Metal-Bearing Sludge Leachates Amenable to Ion Exchange ... 187
4.9. Estimated Capital and Operating Costs for Small-Scale Ion Exchangers for Water Treatment ... 190
4.10. Anion Exchange Resins (Equivalents) ... ... 194
4.11. Cation Exchange Resins (Equivalents) ... 195
4.12. Mixed Bed Resins (Equivalents) ... 195
4.13. Nuclear Grade Resins (Equivalents) ... 196
4.14. Construction Costs for McFarland, CA Ion Exchange Plant ... 206
4.15. Operation and Maintenance Costs for McFarland, CA Ion Exchange Plant .. 206
4.16. Design Criteria for Uranium Removal System ... 209
4.17. Results of Specific Uranium Analyses ... 210
4.18. Fate of Regeneration Wastewater at Wastewater Treatment Plant ... 211
List of Figures
page
3.1. Phase Diagram for a Pure Substance ... 122
3.2. SCWO System from Eco-Waste Technologies, Inc ... 127
3.3. SCWO System from MODAR, Inc . ... 127
3.4. Air-Based Wet Oxidation System with Steam Generation ... 130
3.5. Air-Based Wet Oxidation System without Steam Generation ... 130
4.1. Various Structures of Ion Exchangers ... 172
Chapter 1 Introduction
The planet earth is blessed with the gift of water and from this water life.
Somewhere in the great seas of the past, the inorganic was transformed to the organic, the first premonition of life on this planet. Over four billion years ago, the seas were home to the simplest of all living things; as time passed, slowly transformations occurred and life expanded to include single-celled organisms and much later multi-celled organisms. Some of these in turn progressed into plants and then into animals. Seeking something else,
some of these animals eventually left the ocean. From that moment when those first animals dragged themselves out of the sea and onto the beaches, there has been a quest for fresh water: Eons later, man would share this quest with others of the animal kingdom. Man's earliest ancestors roamed, hunted and finally settled near sources of water. The development of water resources technology-canals, aqueducts, levees, dikes and
reservoirs-fostered civilizations and allowed for empires. Babylon, Egypt, China, Rome and Hitti were all dependent on such technologiesl. While these civilizations rose and fell, the technology advanced, surviving the passage of time and the lives and deaths of
individual engineers, kings and peasants. Some early innovations, like the large-scale irrigation project in Sichuan Province in China, are still in use after 1800 years; many other irrigation schemes failed to drain properly and were doomed by salt buildup in the soil. Other types of projects had their individual successes and failures, like the construction of lead drinking water pipes in the ancient city of Rome2. For better or worse, water resource technology helped transform the landscape and history alike; people were able to
congregate in large numbers and live in close confines. Rivers, lakes and oceans-giant trash receptacles for centuries-were considered ideal for washing away wastes.
1 Vujica Yevjevich, "Water and Civilization", Waternternational, Vol. 17, 1992, p. 164. 2 Vujica Yevjevich, Ibid., p. 165.
Somewhere along the way, these large bodies of water were no longer able to withstand the pressures put on them by humans and became polluted by disease-bearing microorganisms, metals, radioactive waste, and recalcitrant organics.
Approximately 9 million cubic miles or one percent of all the water on this planet is freshwater. This must be shared amongst the five and a half billion people living on this planet3, allowing for over 240 million cubic feet per person. Were it ever that simple!
Sixty-five percent of the fresh water is tied up in the Antarctic Icecap4, still leaving 84 million cubic feet per person. However, in the last hundred years, the technological era has taken its toll on the world supply of fresh water. All over the world, chemicals and
petroleum products are synthesized and produced zealously. The per capita use of water has increased. As the population grows, the demands on water as a natural resource only rise. People depend on more and more water to accommodate a modem lifestyle; to irrigate rice fields in the middle of deserts; to turn their cities from a lifeless brown to a bright chipper green; to flush household sewage out of the home, out of sight, and out of the mind. Fresh, clean water becomes a distributional issue; it must transported from a natural source, treated and finally conveyed to the user. The City of Los Angeles is only able to exist because rivers have been diverted and their water transported across the desert, a monumental achievement of civil engineering, illustrating what any thirsty person knows:
high quality water is only useful if it can reach the user. The 84 million cubic feet of
freshwater that exists for each person on this planet is as elusive to the average person as
the small drink of water from the desalination plant.
Estimates on the US average per capita use of water vary according to the method of accounting. Personal water use amounts to about 60 gallons per day, with a range of
3 1992 Information Please Almanac, Houghton Mifflin Company, Boston, 1992, p. 137. 4 1992 Information Please Almanac, Ibid., p. 137.
40-1305, while municipal water produced per capita is 160 gallons per day, second worldwide only to Australia. However, in terms of total use- including industrial, agricultural and municipal use-1400-1600 gallons per day per person is the norm6, and the US is the world leader7. In stark comparison, the country of Malta only has a per capita total usage of 43 gallons per days. If every person on the planet consumed as much as a typical American, 330 billion gallons or 0.3 cubic miles would be required for personal use. Finally, if the world industrialized to the current level of the United States and
mimicked the US in terms of water usage, 7.5 cubic miles would be used every day.
In the United States, the primary sources of water are fresh surface water (65%), fresh groundwater (18%) and saline surface water (15%), although saline groundwater (0.2%) and reclaimed wastewater (0.2%) do supply a small fraction of the total. Of the 400 billion gallons used daily in the US, less than 10% is used for municipal water supply, and an additional 2% used for rural water supply. The remainder is used to provide
cooling water for thermoelectric power (48%), irrigation (35%) and industrial usage.
When settlers first came to this country, water was a precious resource, difficult to come by and sparingly used. In the first few centuries, any sewage produced was
disposed of directly into a nearby river. As the country industrialized, people left the farms in ever-increasing numbers and headed to the cities, taking jobs in shops and factories. Water was needed to run the homes and industries. Using a technology that was first
5 George Tchobanoglous and Franklin L. Burton, Wastewater Engineering: Treatment. Disosl. and
Reuse. Third Edition, Metcalf & Eddy: New York, 1991, p.17.
6 W.B. Solley, C.F. Merk and R.R. Pierce, Estimated Water Use in the United States in 1985, U.S. Geological Survey Circular 1004, 1988 in Fritz van der Leeden, Fred L. Troise, and David Keith Todd (eds.), The Water Encyclonedia 2nd Edition, Lewis Publishers, Chelsea, Michigan, 1990, p. 302-305. 7 Organization for Economic Cooperation and Development, Environmental Data Compendium 1987, in
Fritz van der Leeden, Fred L. Troise, and David Keith Todd (eds.), The Water Encycl edia 2nd Edition, Lewis Publishers, Chelsea, Michigan, 1990, p. 311.
8 Water Resources Institute, World Resources, 1986 in Fritz van der Leeden, Fred L. Troise, and David Keith Todd (eds.), The Water Encycloedia, 2nd Edition, Lewis Publishers, Chelsea, Michigan, 1990, p. 311.
implemented by the Ancient Romans and later updated in 17th century London9, water was piped into the major American cities. In 1802, Philadelphia was the first city to build a waterworks; and within the next six decades, the sixteen largest cities in the United States had constructed systems of waterworksl°. With a ready supply at hand, the per capita use of water began to increase steadily. The water closet, the precursor to the modern-day toilet, was first patented in 183311, and was by the mid- to late- nineteenth century a
common feature in affluent homes12. This only helped to further increase the pollutant load as more and more raw sewage from individual households and factories was dumped into the nearest body of water. Continuing through the early 1900s, most sewage and
wastewater from individual households and factories was discharged directly to the
environment via the storm sewer systemsl3. This, however, was not without its problems: the accumulation of sludge in the sewers, severe odor problems and danger to public health. Separate sewers and wastewater treatment facilities were constructed in response to these problems. Later, these systems were updated to reflect increases in knowledge and technology.
1.1. Water Pollution and Environmental Legislation
Originally, pollution and industry were thought to go hand and hand: where there was one, there was the other. If this wasn't liked by everyone, it was at least generally accepted. Over the last twenty-five years, the mindset of the American populace has changed. From pliantly accepting industrial and municipal pollution, the average American has become more informed about the environment, more cynical about the wonders of
9 Joel A. Tarr, "Water and Wastes: A Retrospective Assessment of Wastewater Technology in the United States, 1800-1932", Societyfor the History of Technology, 1984, p. 226-263.
13 Joel A. Tarr, Ibid., p. 226-263. 11 Joel A. Tarr, Ibid., p. 226-263. 12 Joel A. Tarr, Ibid., p. 226-263.
industry, and more vocal in her or his demands of a clean, green place to live and breathe14. Collectively, public pressure was placed on Washington.
This resulted in a piecemeal series of legislation, each designed to protect a small part of the whole. Lacking a holistic approach, each media-the air, the water, the land-was protected under a different, often conflicting piece of legislation, each with a name longer and more grandiose than the next. This was the era of acronyms: CERCLA and RCRA, CAA and FWPCA, FIFRA and SDWA, TSCA and OSHA15. Of all these pieces of federal legislation, two in particular, and their subsequent amendments, have shaped the water pollution control industry. These are the Federal Water Pollution Control Act of
1972 and the Safe Drinking Water Act of 1974.
The Federal Water Pollution Control Act of 1972 was designed to protect the nation's surface waters: the lakes and rivers that crisscross the United States. Colloquially known as the Clean Water Act and officially as Public Law 92-500, this piece of legislation had a stated "national goal that the discharge of pollutants into the navigable waters be eliminated by 1985" 16, and sought to legislate the burgeoning environmental concerns of the American public about the waterways of this country. Principally, it sought to reduce the pollutant load on the nation's waterways by employing two main strategies. First, the act required that all wastewater, municipal and industrial, be treated prior to discharge. The US EPA then established municipal and industrial effluent limitations, which defined the amount and concentration of specific pollutants that could be discharged by municipalities and industries. Each facility then had to be permitted by the state under the National
14 Thomas Kvan, "Environmental Market Is Growing Here and Abroad", American Consulting Engineer, p. 17.
15 These are, respectively, Comprehensive Environmental Response, Compensation and Liability Act; Resource Conservation and Recovery Act; Clean Air Act; Federal Water Pollution Control Act; Federal Insecticide, Fungicide, and Rodenticide Act; Safe Drinking Water Act; Toxic Substances Control Act; Occupational Safety and Health Act.
Pollutant Discharge Elimination System (NPDES), with all discharges falling within the effluent limitation levels. Second, in order to help communities finance the construction of new or upgraded sewage treatment facilities, a large federal grant program was
established17. These grants were to help cities of all sizes come into compliance without undo financial burden.
Twenty years and three revisions of the Clean Water Act later, this goal of zero discharge has yet to be achieved. However, the noose, once slack and forgiving, is tightening around point-source dischargers. As of January 1, 1988, 89 percent of all municipal wastewater was receiving at least secondary treatment before discharge8s. Secondary treatment standards are defined as an 85% reduction in Biological Oxygen Demand (BOD) and Total Suspended Solids (TSS), with effluent concentrations no higher than 30 mg/L for both BOD and TSS. Fifty-one industrial Best Available Technologies
(BAT) standards have been established on an industry-by-industry basis to control
discharges of 126 toxic pollutants. These standards mandate effluent concentrations based on the Best Available Technologies commercially available for a given industry.
Furthermore, under NDPES, all permits for discharging wastewater and industrial discharges have become increasingly technical and quite costly, requiring very stringent monitoring and record keeping on the part of the discharger. As the costs of effluent discharges increase, there is a direct economic incentive to reduce both the volume and toxicity. This can be achieved by building on-site a system to pretreat the waste, entirely redesigning the various processes to minimize inputs of the most virulent chemicals, or incorporating elements of reuse and recycle of water.
17 Steve Daniels, EESC Issue Paper on the Clean Water Act, 1993 Briefing Book on Environmental and Enery Legislation, The Environmental and Energy Study Institute, Washington DC, 1993, p. 13. 18 Steve Daniels, Ibid., p. 13.
One definite limitation of the Federal Water Pollution Control Act as it currently stands is its focus on point-source discharges. Most non-point source discharges-industrial, urban and agricultural runoff--are not permitted under NDPES and are, according to the EPA, currently the source for more than half the nation's water quality problems19. It stands to reason then that by only looking at point sources, the United States Environmental Protection Agency might be missing the point. The non-point sources eventually will have to be dealt with, which, indirectly, the American public is already dealing with. Due to contamination of surface and ground water sources, water bills are higher, reflecting more advanced levels of treatment required to make the water potable. Furthermore, environmental contamination leads to rivers and lakes that are not
swimmable, fishable or both, decreasing the enjoyment and use the public has of these natural resources. The great aquifers of this country could become as a recalcitrant a
supplier of water as the ocean is today, but for very different reasons. Currently, aquifers supply slightly over fifty percent of the water used each day in the United States; in some areas, this increases to nearly one hundred percent. Due to residence times orders of magnitude longer, aquifers aren't as tolerant of abuse as rivers and streams. For instance, in both industrial and rural locations, organics such as solvents and pesticides have
percolated through the soil and into local groundwater supplies. Overdrawing aquifers near the ocean has lead to saltwater intrusion; while in inland areas this has caused the
permanent collapse of certain aquifers. Aquifers under dense agricultural centers have become contaminated with nitrates. Whereas natural processes-light, biological activity, flow-can help disperse, eliminate or degrade contaminants in other fresh water systems, these are usually insignificant processes in aquifers. Without the natural self-cleaning processes, the aquifer remains quite contaminated and the water requires treatment before it is potable. The United States Environmental Protection Agency estimates that 57 percent of
rural wells and 52 percent of wells for wells used for drawing community water are contaminated to some extent by nitrates, almost entirely from non-point sources. An estimated 4.5 million Americans--including 600,000 infants, or those most likely to be injured by elevated nitrate levels-get their drinking water from wells with nitrate concentrations at levels considered unsafe2.
The other main piece of federal legislation driving the water pollution control industry is the Safe Drinking Water Act (SDWA). This act, Public Law 93-523, was signed into law by President Gerald Ford in 1974 and mandates the maximum
concentrations of various organic, inorganic and microbial contaminants allowable in the drinking water supply. Originally designed to protect the public from the outbreak of infectious diseases from waterborne bacteria, viruses and other microorganisms, the 1986 amendments incorporated concerns about other contaminants such as metals and organics. The 1986 amendments, Public Law 99-339, required EPA to promulgate standards for 89 contaminants by 1989 and for an additional 25 contaminants a year beginning in 1991. These are two-tiered standards, non-enforceable Maximum Contaminant Level Goals (MCLGs), set at a level to protect against health effects over an entire lifetime of exposure, and an enforceable Maximum Contaminant Levels (MCLs), which incorporate cost and technology into the standard. Conventional and advanced processes considered for Best Available Technology for water treatment under SDWA are given in Table 1.1.
20 Steve Cook, EESC Issue Paper on the Clean Water Act, 1993 Briefine Book on Environmental and
Table 1.1 Water Treatment Processes Considered for Best Available
Technolog21
Conventional Processes Advanced Processes
Coagulation, sedimentation, filtration Activated alumina
Direct filtration Adsorption
Diatomaceous earth filtration Granular Activated Carbon (GAC)
Slow sand filtration Powdered Activated Carbon (PAC)
Lime softening Resins
Ion exchange Aeration
Oxidation-disinfection Packed column
Chlorination Diffused air
Chlorine dioxide Spray
Chloramines Slat tray
Ozone Mechanical
Bromine Cartridge filtration
Others Electrodialysis
Reverse osmosis
Ultrafiltration
Ultraviolet light
UV with other oxidants
Source: J.E. Dyksen, DJ. Hiltebrand, and R.F. Raczko, "SDWA Amendments: Effects on the Water Industry", Journal AWWA, Vol. 80, No. 1, 1988.
All water systems with more than 15 connections or 25 customers are required to test their water regularly for these contaminants and inform their customers when the SDWA standards are exceeded. Furthermore, while the US EPA has primary
responsibility, states may assume primacy and adopt their own standards may be written to reflect local conditions and public concerns, as long as they are at least as stringent as the federal code. In order to provide large numbers of people with safe drinking water, a local water utility must consider a plethora of technologic, economic and regulatory issues. Enough water must be produced, or purchased, to meet the demand of residential, industrial and agricultural users; and the water must meet federal, state and local drinking water standards. Moreover, the cost must be such that the community can afford to pay for its water.
21 J.E. Dyksen, DJ. Hiltebrand, and R.F. Raczko, "SDWA Amendments: Effects on the Water Industry",
Journal AWWA, Vol. 80, No. 1, 1988, in The Water Enccloedia, 2nd Edition, Lewis Publishers, Chelsea, Michigan, 1990, p. 489.
1.2. ollution Control and the Construction Industry
While the blossoming of pieces of environmental legislation may worry the heads of affected industries and municipalities, to those in the construction, consulting and environmental services industry this means more contracts up for the coming. In 1992, the federal government allocated more one billion dollars for environmental restoration
programs, or approximately 1.5% of the Gross Domestic Product (GDP)22. State and local contributions push this value even higher. This money will likely be spent in both the traditional specters of environmental remediation-the design and construction of
wastewater, drinking water, and solid waste facilities and facility upgrades and air emission control devices-and in the emerging areas of site investigation and remediation,
environmental audits and preventative services23. An October, 1992 EPA estimate of the cost of upgrading all of the nation's wastewater treatment facilities put the amount at $80.4 billion, or equal to the design year estimate for such treatment made a year earlier.
According to a December, 1992 National Water Education Council report, the cost of repairing and replacing the sewer and water infrastructure over the next twenty years will reach $400 to $500 billion, or approximately $20 to $25 billion per year24. Whichever of these proves more accurate, there can be no dispute that water pollution control is an enormous market.
Part of the reason for such a continued need for money is simply to come into compliance with the Clean Water Act and the Safe Drinking Water Act. Furthermore, in certain areas of the country it is necessary to further treat the effluent in order to reduce
22 Thomas Kvan, Ibid., p. 17.
23 Thomas Kvan, Ibid., p. 17 - 18.
24 Allen Hammond (ed.), 1994 Information Please Environmental Almanac, World Resources Institute, Houghton Mifflin Company, Boston, MA, 1993, p. 38.
concentrations of nutrients that are causing eutrophication, such as in the Chesapeake Bay and Great Lakes areas. Finally, in arid regions of the country, water planners are
beginning to view wastewater effluent as an increasingly important part of the overall water budget, instead of as a nuisance that has to be permitted and disposed of. In these areas, wastewater effluent is being used for everything from irrigation of crops and recreational facilities to snow making to aquifer replenishment. Due to state and federal standards, though, it is necessary to treat wastewater quite extensively before it is reclaimed, or used
for any purpose besides simple discharge into a nearby body of water. As the need for water in a given region becomes even greater, new allowances for treatment center upgrades are being included in local and state budgets.
As may be expected, pollution control and the construction industry are
complementary. Controlling pollution can be achieved in two ways: altering behavior or adding a device to remove the pollutant. Whereas in the long run it might make more sense to alter practices to reduce the amount of pollutant being produced, it has long been the practice to design processes to remove the contaminant either at the source or down the stream. This is especially true in the case of water pollution, where most end-of-the-pipe solutions to water pollution ar corrected by water treatment facilities, at either the industrial or the municipal level; and the technology exists to decontaminate completely even the most heavily contaminated water. These treatment facility construction and upgrades are large-scale public-works construction projects, involving millions of dollars. During the initial stages of the implementation of the Clean Water Act, Congress allocated billions of dollars in federal grant funds for the design and construction of wastewater treatment facilities were available to construct or upgrade existing facilities. Such money is no longer available, but the needs of communities are far from met. In many areas of the South, Southwest, and West, water needs are not being adequately met with the existing
infrastructure. In agricultural areas, nitrates contaminate water supplies, putting the health of infants at extreme risk. In other locales, uranium and heavy metals are a concern. The
removal of long-stream organic micropollutants-those not broken down by conventional biological treatment methods-is a concern to water treatment facilities, wastewater treatment facilities, groundwater treatment projects, and industrial facilities.
1.3. Thesis Obiectives
This thesis will analyze three segments of the American water and wastewater treatment market in terms of the construction industry. The three areas are water and wastewater reuse and recycle; the use of ion exchange for nitrate, ion and heavy metal removal from wastewater and water streams; and advanced oxidation systems for the removal of organic micropollutants. Water and wastewater reuse and recycle is further subdivided into aquifer storage recovery (ASR), natural treatment methods and membrane separation devices. These subcategories illustrate the various ways of thinking about and solving the problem of meeting water demands with wastewater. ASR is a method to balance out temporal fluctuations in the supply and demand of water, natural treatment
mimics nature; and membrane separation technologies represent the high-tech solution.
Advanced oxidation systems are similarly subdivided in order to adequately represent the range of technologies available or being developed.
These areas were selected from a larger pool of potential problems and technologies by a method of weighing certain attributes in terms of their potential attractiveness to the construction industry. These attributes included initial assessments of the appropriateness of the technology for addressing a given problem, immediacy of the problem, current and potential market size, appropriateness for the construction industry, status of development,
investment requirements and potential liabilities.
This thesis expands on these themes, and by doing so, analyzes these three areas in terms of the construction industry. In particular, assessments of the technologies are given as well as examples of use in the water and wastewater industry. The regulatory
environment is examined; legal, political, social and regulatory acceptability are looked at, along with any related public health and environmental issues associated with the
technologies. The current and future market in general is analyzed. Furthermore, the market attractiveness to the construction industry is examined, by looking at the strategic attractiveness of each technology, the suitability to the construction industry and the cost effectiveness of the technology to the customer. Investment requirements, including status of development, are noted. Case studies for each technology or problem illustrate
examples of the technology in use. Lastly, a policy analysis of water reuse and recycle is included in the water reuse chapter.
References - Chapter 1
1992 Information Please Almanac, Houghton Mifflin Company, Boston, 1992.
1993 Briefing Book on Environmental and Energy Legislation, The Environmental and Energy Study Institute, Washington DC, 1993.
Hammond, Allen (ed.), 1994 Information Please Environmental Almanac, World Resources Institute, Houghton Mifflin Company, Boston, MA, 1993.
Kvan, Thomas, "Environmental Market Is Growing Here and Abroad", American
Consulting Engineer, p. 17-20.
Tarr, Joel A., James McCurley
mI,
Francis C. McMichael, and Terry Yosie, 'Water and Wastes: A Retrospective Assessment of Wastewater Technology in the United States, 1800-1932", Society for the History of Technology, 1984, p. 226-263.Tchobanoglous, George and Franklin L. Burton, Wastewater Engineering: Treatment. Disposal. and Reuse. Third Edition, Metcalf & Eddy, New York, New York, 1991. Van der Leeden, Fritz, Fred L. Troise, and David Keith Todd (eds.), The Water
Encycloedia, 2nd Edition, Lewis Publishers, Chelsea, Michigan, 1990.
Yevjevich, Vujica, "Water and Civilization", Water International, Vol. 17, 1992, p.
Chapter 2 Wastewater and Water Recycle and Reclamation
2.1. Introduction
Broadly defined, wastewater recycle and reclamation is the process encompassing the treatment and use of wastewater as a natural resource. Recycling can be accomplished on any scale from the very small, as on board a ship or spacecraft; to the small, such as in commercial buildings; to the large and very large, as in the case of on-site industrial water recycling and at Publicly Owned Treatment Works (POTWs). In this status, the
wastewater is not disposed of as a mere byproduct of the treatment process. Instead it is used for select purposes as a substitute for potable water. Recycling and reclaiming water can have substantial implications at any of these levels toward the meeting of water budgets and the production of potable water, preservation of the environment and reduction in disposal and discharge fees.
Policy issues central to the concept and practice of using and reclaiming wastewater will be addressed in the introduction, while the remainder outlines the technical, regulatory, and social issues related to reclaiming and reusing wastewater. While the focus of the report will be the reuse and reclamation of municipal wastewater from traditional wastewater treatment centers, issues concerning industrial wastewater reuse and water treatment will also be addressed. Descriptions of technologies key to this field include aquifer storage recovery (ASR), natural systems, and membrane separation technologies. The next section concerns itself with the regulatory and social acceptance of reusing and reclaiming wastewater. The following three sections will then address the market itself, the
applicability to the construction industry, and investment requirements. Four case studies highlight actual examples of reclaiming and recycling wastewater. Lastly, the conclusion wraps everything together.
2.1.1. The Relation of Potable Water to Reclaimed Wastewater
Each organism and ecosystem alike require a certain amount of water to survive, to function effectively, and to grow and thrive. In a similar fashion, each community, region and country needs a certain amount of water. This volume of water must satisfactorily meet the needs of the entirety of the municipal, agricultural, industrial, and electrical users. In order for the community to go about its daily business, the water supply must be of reliable quantity and quality, available around the clock, three hundred and sixty five days a year. When the water is not there, various aspects of the community-industries, utilities, social services-begin to fray at the edges and slowly dissolve or come to a halt; the social fabric unwinds.
First and foremost, without large quantities of water, food cannot be produced. This effect trickles down from the production of food to the production of goods and services to the production of electricity and other heavy industries. Chemical and
pharmaceutical industries, refineries, pulp and paper manufacturers, nearly every industry relies heavily on water in order to manufacture products. Without adequate water supplies, needed directly for production and indirectly for cooling water and the production of steam, these are forced to shut down. Electrical utilities, also requiring high quality water for cooling water, are forced to curtail their production of electricity or shut down. Sanitation systems fail and with them the threat of disease skyrockets. If high quality sources of water are not available, people turn to dubious or even downright dangerous sources of water: rivers that receive raw sewage directly, groundwater wells contaminated by organic pollutants or heavy metals. However, when both money and foresight coincide,
technology can take over. Whereas in the past, the technological options for acquiring safe and reliable sources of water included damming and diverting rivers, digging new wells
and building small- and large-scale irrigation systems, the technology is now available that can take the dirtiest, nastiest, most dangerous water and make it clean.
Overall in the United States, water is plentiful. However, the absolute volume of water that exists is only as important as its location. Water as a natural resource is a distributional issue; the water must be where the people and the demand are. In the arid
and semi-arid heavily populated South and Southwest, the demand for fresh water far exceeds the supply. Taking over where nature left off, in the 1930s and '40s civil
engineers and water planners stepped in. Large dams and canals were designed, financed and constructed to cart the water in to satisfy the demands of a growing region, and have kept the vegetables and rice growing in the middle of the desert ever since. And when there were problems as a result, new technologies came along to solve them. For instance, to meet the needs of the agricultural sector of Arizona and California, the pristine wilds of most of the Colorado River were forfeited. This 1400-mile river winds from the Rocky Mountains down to the Sea of Cortez and has experienced nearly a century of being dammed and diverted, transported, and used extensively for irrigation in two countries. This pattern of use has not left the river unharmed, nor has it left its users without
additional problems. In particular, Mexican farmers, who use water from the Colorado to cultivate crops in the Mexicali Valley, received the brunt of the problems. Due to the combination of a wide variety of irrigation projects up and down the river and the natural landscape, the salinity in the lower portions of the river began to rise in the early 1960s, and within two decades it had doubled1. Irrigated with this water, wide swathes of the Mexicali valley were began to suffer from salt poisoning. Crops were unable to grow on about one eighth of the land by the early eighties and predictions suggested that should conditions continue to deteriorate unabated, by the year 2000 the entire valley would be
unsuitabe for agriculture2. More large-scale civil engineering projects were then needed to deal with the effects of the first round of projects. Due to the underlying bedrock in the vicinity of Yuma, Arizona, the irrigation return water--water that drains from irrigated fields-from several large-scale irrigation projects in the area became extremely saline. Coming from already elevated river concentrations of 600-800 mg/l (in comparison, the mean salinity for North American rivers is 148 mgA13), the salinity of the irrigation return water was between 3000 and 3400 mg/l4. A 100 MGD desalination plant in Yuma, Arizona was designed and constructed to treat the irrigation return water before 72 MGD was returned to the Colorado River at a salinity of 100-400 mg/l, thus allowing the farmers in the Mexicali valley to be able to utilize the river water without further damaging their land. Finally, a canal was built to transport the remaining 28 MGD of water with a salinity ranging from 10,000-12,000 mg/l to the Sea of Cortez5. The same membrane-based technology that allowed 100 MGD of water to be desalinated is also used to reclaim
wastewater. In a similar fashion to the irrigated river water becoming an integral part of the system for providing farmers downstream with water for irrigation, wastewater treatment plants can be designed and operated such that they are contributing to the solution of local and regional water needs, rather than being part of the problem.
A water supply can originate from three sources: surface water, groundwater and reclaimed wastewater. Surface water in turn can be either fresh, saline or brackish, and either domestic or imported; water transported from other locales is considered imported, and water from a source within the community domestic. Groundwater as well can be either fresh, brackish, or saline; and while it can be imported from other locations, it tends
2 Robin Clarke, Ibid., p. 99-100.
3 Robert G. Wetzel, Limnolog, Saunders College Publishing, Philadelphia, 1983, p. 180. 4 Anton C.F. Ammerlaan, John C. Franklin, and Charles D. Moody, "Yuma Desalting Plant.
Membrane Degradation during Test Operations", Desalination, Vol. 88, 1992, p. 33-34. S Anton C.F. Ammerlaan, John C. Franklin, and Charles D. Moody, Ibid., p. 33-34.
to be primarily domestic. Reclaimed wastewater is the intentional or unintentional reuse of either municipal or industrial wastewater for direct or indirect consumption or
environmental purposes.
Two hundred years ago, the average American utilized a couple of gallons a day; this has increased to about 60 gallons per day, with a range of 40-1306. Typical municipal water use totals around 165 gallons per day per person, or 36.4 % for domestic supply, 42.4% for industrial use, 6.0% for public service and 15.2% unaccounted for in leakage
and system losses7. However, the total amount of fresh water, not supplied directly by rainfall, used each day in the United States is much higher than these numbers suggest. If
all industrial, electrical, public and agricultural usages are included, the amount of water utilized per capita skyrockets to 1400-1650 gallons per day, 10% of which is accounted for by the public water supply, 11% for industrial use, 38% for electric cooling and 41% for agriculture and irrigations. This water does not miraculously appear where it is needed; sources are taxed. Increases in the total amount utilized have progressed steadily, as Table 2.1 shows, with sources of saline and fresh groundwater and surface water, and reclaimed sewage.
6 George Tchobanoglous and Franklin L. Burton, Waswater Enineering: Treaent Dissa and Reuse, Third Edition, Metcalf & Eddy, New York, 1991, p. 17.
7 George Tchobanoglous and Franklin L. Burton, Ibid., p. 17.
8 Fritz van der Leden, Fred L. Troise, and David K Todd, The Water Encclopedi Second Edition, Lewis Publishers, USA, 1990, p. 311.
Water Use in the United
Gallons per Day9
States, 1955-1985, in Billions of
Year
19551 19652 19753 19853
Population (in millions) 164.0 193.8 216.4 242.4
Source of water Ground: Fresh 47 60 82 73 Saline 0.6 0.5 1 0.7 Surface: Fresh 180 210 260 260 Saline 18 43 69 60
TOTAL4
250
310
410
400
Water usage: Public supply 17 24 29 37Rural, domestic & livestock 3.6 4.0 4.9 7.8
Irrigation 110 120 140 140
Industrial:
Thermoelectric power 72 130 200 190
Other industrial usages 39 46 45 31
TOTAL4
240
310
420
400
Reclaimed Sewage 0.2 0.6 0.5 0.7
1 48 States and the District of Columbia. 2 50 States and the District of Columbia.
3 50 States, the District of Columbia, Puerto Rico, and the Virgin Islands. 4 Data is rounded to two significant digits which may lead to some discrepancies.
Source: W.B. Solley, C.F Merk, and R.R. Pierce, Estimated Water Use in the United States in 1985, United States Geological Survey Circular 1004, 1988.
The resulting mixture of sources a community utilizes is a function of the water available; the total demand for water, the available infrastructure within the community and the surrounding region; the economic, environmental, and social cost and benefit of each option; and public opinion. Changing the mixture of sources can, in some cases, alleviate stress to parts of the system that are fragile, unstable or unreliable. These stresses arise from both natural and manmade causes and include overtaxing a delicate ecosystem, relying too heavily on rainfall, competing with neighboring communities for limited resources,
9 W.B. Solley, C.F. Merk and R.R. Pierce, Estimated Water Use in the United States in 1985, U.S. Geological Survey Circular 1004, 1988 in Fritz van der Leeden, Fred L. Troise, and David Keith Todd (eds.), The Water Encvclopedia, 2nd Edition, Lewis Publishers, Chelsea, Michigan, 1990, p. 302.
overpopulation, over development, deforestation, overdrawing aquifers, or any other number of situations which leave the environment damaged or overtaxed.
The potential benefits of using reclaimed wastewater rather than a more traditional source of water fall into two categories: environmental and consumptive. Consumptive benefits are those in which the benefit is in having more water available with which to meet the water budget. Environmental benefits come from relieving pressure on the
environment. Examples of this include preventing or curtailing salt water intrusion into a fresh water aquifer, equilibrating groundwater withdrawal and recharge, and restoring a damaged ecosystem by reducing the nutrient load onto a stream or estuary. However, if care is not taken, it is possible to damage an ecosystem by using reclaimed wastewater. For instance, the vadose zone above an aquifer can be changed due to a flourishing of microbial and algal activity if the nutrient level of the wastewater is too high. Alternately, if the concentration of total dissolved solids (TDS) is too high, the soil will become too saline to support certain types of crops, a problem common to poorly designed irrigation systems. Furthermore, unless federal or state effluent disposal fees surge, there are certain water-rich areas of the country, like in the Great Lakes region, where reclaiming wastewater will never be cost effective. This does not mean, however, that there will not be any benefits from the using reclaimed wastewater, just that the benefits will be entirely environmental rather that consumptive. In other more arid regions, both consumptive and environmental benefits are possible.
The choice of sources can be altered due to various legal, regulatory, and economic incentives and barriers. Well-designed, consistent incentives from the relevant agencies, offices and branches of the government [e.g. the US Environmental Protection Agency (EPA) and the Internal Revenue Service (IRS)] can encourage or discourage the use or development of any of these sources, including reclaimed wastewater. For example, too
stringent environmental regulations will make reclaimed wastewater too costly to be a feasible option, whereas too if they are too lax, they will not adequately protect human health and the environment. Furthernnre, each level of government, from local to state to federal, can alter the choice due to a particular agenda. This might be cleaning up a certain lake, reducing overall water consumption, increasing overall volume of water available. Similarly, regulations can be written to exploit or curtail the use of certain sources, in
accrdance with public policy. For instance, the State of Arizona is trying to prevent the overdraw of the aquifer from which 64% of its water is drawn. Once an aquifer is extremely overdrawn, the possibility exists that it will collapse, permanently reducing the total amount of water it can store. To achieve this goal, regulations were written on the state level to encourage aquifer recharge with the use of reclaimed wastewater, in order to bring aquifer withdrawal and recharge into balance by the year 2010.
Variable pricing, cost sharing and mandatory use are three other means to control water usage. Pricing strategies for reclaimed versus potable water vary from place to place and are designed to meet the goals and needs of a community, state or region. In water tight regions, effective pricing schemes combined with cost sharing between the user and the utility for changes in infrastructure necessary to accommodate the use of reclaimed wastewater can help increase the use of wastewater to the mutual advantage of the users, the water utilities, and the environment. The State of Florida, for example, has undergone a high rate of population and economic growth in the last two decades. Traditionally relying on groundwater for almost 90% of its potable water supplies10, Florida is looking
toward the use of reclaimed wastewater to meet total demand. In parts of Florida, the use of reclaimed wastewater for certain purposes, such as watering lawns, is mandatory in various locations. This is combined with a variable pricing scheme whereas the price of
reclaimed wastewater varies from user to user. Large-volume agricultural users, such as citrus groves, receive the water free of charge, in return for agreeing to take a certain amount of water on a predetermined schedule. The largest of these projects-and the largest worldwide-is the Water Conserv H in Orlando, FL which supplies 4040 ha
(10,000 ac) of citrus groves with 17 MGD reclaimed wastewater free of charge under a 20-year contract. The remaining 8 MGD produced by the project is used for groundwater recharge via rapid inflitration basinsl. In other projects across the state, low-volume users, such as home owners, typically pay 40% the price of potable water for reclaimed wastewater12. The difference between the prices reflects the fact that high-volume users provide the utility with a guaranteed place for disposal of the water. Without this, the water would have to be disposed of by the treatment facilities in a more traditional way, requiring a National Pollutant Discharge Elimination System (NPDES) permit, at substantial cost to the utility and ultimately to the consumer. By providing the utility with a guaranteed place of disposal, these permits are no longer necessary and the utility and the consumer both save money overall. Because of this, the water is variably priced, at what is hoped is a win-win situation for all, although questions of equity do exist.
Industrial use of water can be curtailed through complete process redesign, incorporation of water recycling technology and concepts and, in some cases, simple modifications of existing processes. With more stringent mandatory industrial
pretreatment required before discharge to POTWs coming on line due to recent amendments to the Federal Water Pollution Control Act, as well as increasing discharge fees through NDPES, the economic incentive towards process redesign and water recycling within a plant is becoming reality. With economic encouragement, water use can drop
11 John L. Jackson, Jr., "Citrus Trees Blossom with Reclaimed Water", Water Environment and
Technology, February 1993, p. 27-28.
12 Donald F. Newnham, "Dual Distribution Systems", Water Environment and Technology, February 1993, p. 60.
tremendously. For instance, in 1975, 2000 gallons of water were used to refine a barrel of oil; that amount has dropped precipitously to 90-100 gallon water/bbl oi113. Within other industries, similar strides have been made.
Reuse and reclamation of industrial wastewater can benefit the plant or company, the Publicly Owned Treatment Works (POTW), and the environment. Potential benefits to the company include forced process redesign, which may in fact do more than reduce the quantity and toxicity of the effluent. In the best case scenario, plant modernization can allow the company to compete more successfully, bring the company up to the
technological leading edge of the industry, reduce the amount of water the company needs to purchase, and reduce the overall cost of production. In other factories, forced reuse and reclamation of industrial wastewater will result in more sophisticated, technologically driven, and more expensive water pollution control devises being installed at the tail-end of the processes. The same technologies that a POTW uses to remove contaminants from its feed stream are available for commercial use by industry (see Table 2.2).
13 Karen S. Elbe and Jennifer Feathers, "Characterization of Streams First Step in Reuse Scheme', Oil
.. . . . . _ J _ * 1 A
lable .Z rossiDle ontaminants and u
itons
or reatment1'
Contaminant Treatment Options Notes
Aldehydes A K
Aluminum B C G I J B--requires pH adjustment
Amines K
Ammonia
FKI
Arsenic B C F H J B-requires pH adjustment
Barium E GIJ I-possible membrane fouling
BOD ABDFHI prefilter
Calcium E G
Chlorides H I J
Chlorine-residual feed sulfite
OOD AFHI
Conductivity G + H I J
Copper B C E I J B--requires pH adjustment
Cyanide A K
Fluoride E H I J some adsorption on CuP04, MgOH
Total Hydrocarbons B D F I K
Iron A B E G I J I--possible membrane fouling
Lead A B E I J B--requires pH adjustment
Magnesium E G I J
Manganese A B E G I J I-possible membrane fouling
Nickel A B G I J B-requires pH adjustment
Silica-reactive E H I E--hot
Sulfates H I J Some adsorption with lime
Sulfides AEFH
Suspended Solids B C
TOC AFHI
Zinc B C E G I J Brequires pH adjustment
A = Chemical oxidation G = Cation E
B = Filtration H = Anion E
C = Clarification I = Reverse ( D = Physical Separation (API, DAF/IAF) J = Electrodi E = Lime or soda ash softening K = Biologic F = Air/Steam stripping
Source: Karen S. Elbe and Jennifer Feathers, p. 83-85.
Ixchange
xchange
Osmosis
alysis Reversal al/secondary treatment
Once treated, the plant can either choose to reuse the water on-site, reducing the volume of water it needs to purchase, discharge directly to surface water in accordance with its NPDES permit, or discharge to a POTW. In such cases, reuse requirements will usually not result in overall process redesign or plant modernization, but will simply raise
14 Karen S. Elbe and Jennifer Feathers, "Water Reuse Optimization Requires Knowledge of Cleanup Methods", Oil and Gas Journal, Vol. 90, No. 40, Oct. 5, 1992, p. 83-85.
the cost of production, unless the cost savings of the recycled materials compensates for the cost of installing the pollution control device. Moreover, if the capital is not available for the upgrades, then it is possible the plant will be forced to close or relocate to a place without such stringent environmental regulations. Other plants in the industry, located outside the United States, may be able to produce the same good at a lower cost, due to lax environmental standards. However, consistent incentives (e.g. tariffs to equilibrate the environmental cost with the added economic cost) can prevent the movement of business across borders due to environmental regulations.
By requiring pretreatment at the source, EPA is helping to close a longstanding loophole in wastewater treatment practice and to minimize the level of treatment required for the POTWs to remain in compliance with federal effluent limitations. Because industrial wastewater is usually more concentrated and more toxic than domestic wastewater, it
typically requires more treatment per volume. With industrial pretreatment reducing the
amount of treatment required at the POTW, the POTW will benefit from improvements in the water quality of the influent. For example, if only one plant in an area is discharging a certain heavy metal to a POTW, it is usually less costly overall to remove it at the plant than to transfer the problem from the factory to the POTW. At the POTW volume of the feed stream is much larger, while the overall quantity of heavy metal to be removed remains the same. With the larger feed stream, much more extensive ion exchangers are required, than if the heavy metals had been removed at the factory. Furthermore, the energy requirements for pumping additional volumes of water through the ion exchangers are increased.
However, if the POTW treats waste from many small industrial sites, economies of scale might suggest placing one large pretreatment facility on the site of the POTW for the industrial wastewater rather than at each of the small facilities.
2.1.2. Zero Discharge and Sludge Recvcling
Congress, in 1972, enacting the Clean Water Act, had in mind a lofty ideal as to how to produce clean water. With its oft quoted "national goal that the discharge of
pollutants into the navigable waters be eliminated (CWA 101[a])", the Clean Water Act and subsequent amendments never quite lived up to this premise. However, in the last two decades, water pollution control technologies have been developed and perfected to such an extent that "zero discharge" in some industries is now possible. In some cases, there is an industry-wide mandate15by the US EPA to head towards "zero discharge". Other times, local conditions-such as deteriorating ground or surface water quality-induce local environmental agencies or departments to mandate a facility become "zero discharge". The water from advanced wastewater treatment centers, if not absent of pollutants, is much closer to the ideal of zero pollutants than traditional primary and secondary treatment facilities.
The concept of "zero discharge" is a difficult to define. What exactly is "zero"? This can be interpreted in a number of ways. It can mean volume, toxicity, or pollutants. For instance, zero in terms of volume simply means that no effluent at all is being
discharged from a plant. Zero in terms of toxicity means that the water being discharged is harmless, according to a predetermined notion of what harmless is, in terms of water quality indicators and concentrations of various ions, compounds and atoms. Finally, zero in terms of pollutants means that the water leaving the plant has no detectable pollutants. However, this last definition has an obvious problem: '"If one puts a finger in waters of a pristine lake, contamination is introduced already (grease, bacterium, epidermis).
Therefore, we are not talking about pollution 'elimination', but about lowering the levels of
15 David Bowlin and Rodi Ludlwn, "Case Studies: Zero Liquid Discharge Systems at Three Gas-Fired Power Plants", 1992 ASME Cogen Turbo Power Congress, Houston, Sept. 1992, p. 1.
discharged byproducts of human activities to values comparable to existing background levels comparable to existing background levels"16. The most advanced of the wastewater reuse facilities produces water that is comparable to nearby raw water sources, narrowing in on this goal. But overall, for most POTWs and industrial facilities, is this a feasible
goal? Congress in 1972 thought it was.
The feasibility of zero discharge requires that the technology exists and that the costs are reasonable. The technology now exists such that the dirtiest, most contaminated water can be made pure. Many of these technologies, however, are extremely energy dependent and require enormous inputs of electricity. Other technologies require additional
chemicals to solve contamination problems. Combining the direct economic costs with the environmental costs of producing both the electricity and the chemicals might in some cases
put the original goal of zero discharge in question. Benefits come from a possible decrease in cost, from both the money saved on inputs (e.g. metal recycling, reduced water bills)
and reduced discharge and sludge disposal fees; and a decrease in potential liability that
results from restitutive and punitive fines being accrued by violating wastewater discharge
permits17.
Depending on the processes used, there will be the issue of sludge. If the
contaminant is merely transferred from the water to the sludge, this is little improvement
over the current situation. If, however, the sludge can be reused for beneficial purposes, or optimally sold as an input for other processes or as a product people need, then the
treatment plant or industrial facility comes closer to being closed-cycle, where little is
discarded and nearly everything is reused.
16 Mikhail Schiller and Matthew E. Hackman, "Water Reuse Systems for Zero Discharge",
Environmental Protection, September 1993, p. 72.
Sludge, euphemistically known as biosolids, is the non-water end product of the municipal and industrial wastewater treatment process. The inherent composition and quantity of the sludge, both of which vary over time, are a function of the inputs to the treatment facility and the treatment processes utilized. While popularly conceived of as a
solid, the sludge produced at publicly owned treatment works (POTWs) is initially in a liquid or semiliquid form, with a solids content ranging from 0.25 to 12 percent by weight18. From this state, the sludge is often treated before disposal. Treatment options include physical, chemical and biological processes and are usually designed to deal with the unique problems associated with sludge: high organic content, easily degradable, offensive smelling, pathogenic, and high water content. Due to these same characteristics, sludge is, however, inherently recyclable. Because of its high organic content and nutrient level it is easily compostable, easily applied to damaged land, and is good for daily cover at landfills. It is more from the odor and appearance of sludge rather than from a bona fide public health risk that make the general public wary of using the 8.5 million dry tons of municipal sludge19produced every year in the US for personal and municipal purposes. Industrial sludge can be more toxic, and depending on the concentrations of various components, like municipal sludge, can be classified as hazardous waste and regulated under the Resource Conservation and Recovery Act (RCRA). In cases where it is hazardous waste, the options for beneficial reuse are close to nil.
Federally, the United States Environmental Protection Agency published the Part 503 Standards for the Use and Disposal of Sludge in the Federal Record (58FR9248) on February 19, 19932°, which was codified in 40 CFR Section 503. The deadline for compliance was set at one year later, or February 19, 1994. This followed more than a
18 George Tchobanoglous and Franklin L. Burton, Ibid., p. 765.
19 Ann Hasbach, "Putting Sludge to Work", Pollution Engineering, December 1991, p. 63.