Design and field evaluation of a ground robot for
high-throughput phenotyping of energy sorghum
The MIT Faculty has made this article openly available.
Please share
how this access benefits you. Your story matters.
Citation
Young, Sierra N., Erkan Kayacan, and Joshua M. Peschel. “Design
and Field Evaluation of a Ground Robot for High-Throughput
Phenotyping of Energy Sorghum.” Precision Agriculture (September
15, 2018).
As Published
https://doi.org/10.1007/s11119-018-9601-6
Publisher
Springer US
Version
Final published version
Citable link
http://hdl.handle.net/1721.1/118124
Terms of Use
Creative Commons Attribution
Design and field evaluation of a ground robot
for high‑throughput phenotyping of energy sorghum
Sierra N. Young1 · Erkan Kayacan2 · Joshua M. Peschel3© The Author(s) 2018
Abstract
This article describes the design and field evaluation of a low-cost, high-throughput pheno-typing robot for energy sorghum for use in biofuel production. High-throughput phenotyp-ing approaches have been used in isolated growth chambers or greenhouses, but there is a growing need for field-based, precision agriculture techniques to measure large quantities of plants at high spatial and temporal resolutions throughout a growing season. A low-cost, tracked mobile robot was developed to collect phenotypic data for individual plants and tested on two separate energy sorghum fields in Central Illinois during summer 2016. Stereo imaging techniques determined plant height, and a depth sensor measured stem width near the base of the plant. A data capture rate of 0.4 ha, bi-weekly, was demonstrated for platform robustness consistent with various environmental conditions and crop yield modeling needs, and formative human–robot interaction observations were made during the field trials to address usability. This work is of interest to researchers and practitioners advancing the field of plant breeding because it demonstrates a new phenotyping platform that can measure individual plant architecture traits accurately (absolute measurement error at 15% for plant height and 13% for stem width) over large areas at a sub-daily frequency; furthermore, the design of this platform can be extended for phenotyping applications in maize or other agricultural row crops.
Keywords Agricultural robotics · Field-based phenotyping · Plant imaging · Sorghum
Introduction
This paper presents the design and field investigation of a mobile high-throughput phenotyping robot “TERRA-MEPP” (Transportation Energy Resource from Renew-able Agriculture Mobile Energy-crop Phenotyping Platform) for deployment in energy
* Joshua M. Peschel peschel@iastate.edu
1 Department of Civil and Environmental Engineering, University of Illinois at Urbana-Champaign,
Urbana, IL, USA
2 Senseable City Laboratory and Computer Science & Artificial Intelligence Laboratory,
Massachusetts Institute of Technology, Cambridge, MA, USA
sorghum (see Fig. 1). Energy sorghum is a key crop for the Midwestern (USA) biofuels industry (Dweikat et al. 2012), and the success of derived components is dependent on increasing biomass by relating plant genotypes to their phenotypes (Vega-Sánchez and Ronald 2010; Yano and Tuberosa 2009). High-throughput phenotyping technologies have been implemented for isolated growth chambers or greenhouses (Batz et al. 2016); however, there is an emerging need for field-based platforms to measure large quan-tities of plants exposed to natural climates throughout a growing season (Fiorani and Tuberosa 2013; Furbank 2009). A mobile sensory platform for automated phenotyping data collection in the field would increase the throughput for screening energy sorghum compared to traditional approaches, such as manual measurements by technicians (Cor-nelissen et al. 2003).
A major challenge for sustainable biofuel production is increasing the accuracy, preci-sion and timeliness of the phenotypic information that will yield optimal biomass (Cobb et al. 2013; White et al. 2012). Plant breeders are able to use phenotypic data to link plant phenotype with genotype and environmental conditions early in growth to evaluate crop status and accelerate an understanding of breeding processes for large numbers of plants. Developments in automation, imaging and software solutions have enabled high-through-put phenotyping studies in controlled environments, such as greenhouses and laboratories, (Cobb et al. 2013; Cabrera-Bosquet et al. 2012), which utilize stationary measurement devices to either manually or automatically phenotype individual plants. Indoor phenotyp-ing is effective for individual plants produced in a controlled environment, but field-based phenotyping provides an expanded realistic set of phenotypic data from crops grown in actual environmental conditions (Fuglie and Heisey 2007; White et al. 2012). In recent years, experimental and commercial high-throughput field-based technologies that lever-age remote and near sensing allow for the collection of large amounts of plant data without extracting plants from their natural environment (Virlet et al. 2016).
Robot-based technologies have been explored in recent years for field-based pheno-typing and have a range of form factors, including: ground-based systems (tractors, rov-ers and harvestrov-ers), cable-positioned, gantry or crane-based systems and aerial systems including helicopters and UAVs. Each platform can collect different types of phenotypic data depending on the sensors, view of the crop and whether the data collected are at the individual plant or plot level. Depending on the desired crop parameters, all platforms have their own advantages and limitations.
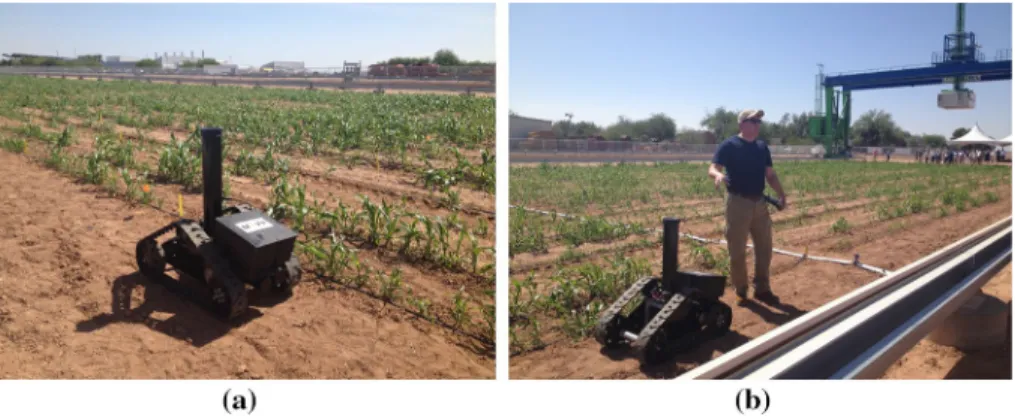
Fig. 1 Photos of the TERRA-MEPP phenotyping platform operating in the field: a with a short mast config-uration used for imaging plants early in the growing season, and b with the first version of a fully extended mast for measuring the height of tall sorghum
Tractor-mounted systems are manned vehicles, although some are modified to be auton-omous, on which mounted sensors offer close spatial proximity to individual plants. Trac-tors are normally available at agricultural field sites and capable of carrying large payloads; however, tractors have limitations when phenotyping is considered including: large size, internal combustion engines, vertical clearance [normally 1.4–2.0 m (Comar et al. 2012; Busemeyer et al. 2013)], limited mobility, inability to operate after irrigation or precipita-tion and the necessity of experienced operators (White et al. 2012). Despite these limita-tions, tractor systems have been used for field-based phenotyping. Salas Fernandez et al. (2017) developed an augmented John Deere tractor system with an automated guidance system, stereo cameras and color cameras to collect plant height and stem diameter meas-urements. Their system automatically extracted plant height from image data with user input required to estimate stem diameter. Andrade-Sanchez et al. (2014) built a system on a sprayer equipped with a multi-spectral sensor, sonar proximity sensor and infrared radiom-eter sensors to measure canopy reflectance, height and temperature. The platform measured four crop rows simultaneously and collected data at the rate of 0.84 ha h−1; measurements obtained by the platform agreed with manual and aerial measurements. Busemeyer et al. (2013) developed a tractor-pulled phenotyping platform for small grain cereals, equipped with a wide range of optical sensors. Comar et al. (2012) built a semi-autonomous tractor system equipped with four spectrometers, a hyperspectral radiometer and two RGB cam-eras which covered 100 microplots per hour. Both of these platforms used internal combus-tion engines (Andrade-Sanchez et al. 2014; Comar et al. 2012) which have the potential to be disruptive.
Rovers are unmanned ground vehicles that can capture individual plant data and elimi-nate the need to have a skilled operator on board the vehicle. The BoniRob crop scout and the BoniRob (V2) rovers are the most similar to TERRA-MEPP to the extent of the author’s knowledge (Bangert et al. 2013; Ruckelshausen et al. 2009). The BoniRob crop scout is a four-wheeled autonomous vehicle with variable chassis clearance and a maxi-mum clearance of 0.8 m. The track width is also variable, ranging from 0.75 to 2 m wide [note that sorghum can be planted in crops rows with widths of 0.5 m (Golzarian et al.
2011; Broadhead and Freeman 1980)]. The BoniRob sensor suite includes 3D time-of-flight cameras, spectral imaging, light curtain and a laser distance sensor. The BoniRob (V2) design improved on the original rover design to increase the power, battery capacity and continuous drive torque (Bangert et al. 2013). The BoniRob models have many prom-ising features; however, their wide tracks and limited clearance present a serious limitation for sorghum phenotyping. The Vinobot is another phenotyping rover implemented on a Husky A-200 from Clearpath Robotics (2017) (Kitchener, Ontario, Canada), capable of measuring individual plants and utilizes stereo cameras and multiple environmental sen-sors (Shafiekhani et al. 2017).
Aerial phenotyping systems include manned helicopters and UAVs. These platforms obtain data on a larger spatial scale, characterizing a large number of plots within min-utes (Araus and Cairns 2014), with the trade-off of lower spatial resolution, limiting load constraints, weather restrictions and the impossibility of direct biomass measurement (White et al. 2012). Manned helicopters cannot hover very low but are capable of carrying very large payloads and from a height of 50 m can capture data at a spatial resolution of 100–500 mm (White et al. 2012). French et al. (2007) utilized helicopter-mounted sensors to capture images in the visible, near-infrared and thermal infrared wavelengths with 0.5 m resolution to make evapotranspiration (ET) estimates throughout an entire growing season for wheat during an irrigation experiment. Drawbacks of manned helicopters include avail-ability, non-disturbance altitudes that must be maintained and high operational costs.
UAVs can fly at lower non-disturbance altitudes than manned helicopters (~ 3 m) and are less costly making them more feasible for high-throughput phenotyping. UAVs nor-mally employ an RGB or color-infrared (CIR) cameras (Jørgensen et al. 2015; Rasmus-sen et al. 2016), but multispectral or hyperspectral cameras have also been used (Liebisch et al. 2015; Araus and Cairns 2014). The UAV platform described by Berni et al. (2009) and Zarco-Tejada et al. (2009) was deployed with a 6-band multi-spectra camera, thermal camera and a CMOS sensor. The thermal camera had 400 mm spatial resolution and the multispectral sensor had 200 mm spatial resolution. The unmanned helicopter by Chapman et al. (2014) carried digital and a thermal imaging camera and collected 10–20 mm resolu-tion data at 10–40 m flight altitudes. In addiresolu-tion to imaging sensors, LIDAR sensors are also used to estimate crop height and volume at high voxel resolutions (Christiansen et al.
2017). A comprehensive review of high-resolution aerial phenotyping systems is provided by Sankaran et al. (2015).
Tethered UAVs have also been used for collecting aerial images (White et al. 2012). Longer endurance operations are possible with these vehicles because continuous power is provided through the tether. A quadrotor platform with a tether delivering electrical power could carry a 20 kg payload (Hovermast 100, Israel Aerospace Industries Ltd., Lod, Israel). Tethered balloons are another alternative; however, they are not as mobile, have issues with accurate orientation and positioning (especially in wind) (White et al. 2012) and require Federal Aviation Authority regulation if raised above 45 m (United States Federal Avia-tion AdministraAvia-tion 2017). Jensen et al. (2007) deployed a tethered helium balloon with a multispectral sensor and two digital cameras to measure plant response to nitrogen applica-tion at a resoluapplica-tion of 0.25 m from an altitude of 400 m. In Ritchie et al. (2008), two digital cameras were deployed with a tethered balloon to monitor normalized difference vegeta-tion index (NDVI) in cotton plots during an irrigavegeta-tion study.
Gantry-based systems can measure phenotypic traits at high spatial and temporal reso-lutions; however, this approach typically requires stationary structures which limits their coverage area. High costs are also normally associated with gantry systems as fixed infra-structure must be installed (e.g., foundations, tracks, etc.) The LemnaTec Scanalyzer™ (LemnaTec GmbH, Aachen, Germany) is a commercially available, autonomous gantry system capable of continuous plant imaging and measurement using a wide variety of sen-sors, including visible light, infrared, near infrared, extended VNR, multispectral imagery, height measurements via laser scan, fluorescence, an NDVI sensor to measure nitrogen and sensors for environmental measurements including carbon dioxide, light, precipita-tion, temperature and wind. The field-based system has two layout options: (i) a portal bridge crane on rails for long fields, which can cover several hundred square meters, or (ii) the Field Gantry, which has a mono-rail car on a bridge and can cover many sizes of rectangular fields. Both setups limit operations to fields with a width of 10 m. To over-come constraints of fixed gantry systems, Jiang et al. (2014) developed a portable, 4-wheel independent driving gantry equipped with stereo sensors. Their system was tested in soy-bean plots and more accurately navigated the terrain compared to traditional 2D estimation methods, which could be used to improve area coverage compared to a fixed gantry; how-ever, the 3 m clearance may be a limitation for applications in energy sorghum.
To expand the imaging coverage area even further, one option is to suspend cable robots from towers over fields (similar to cameras used in the entertainment industry and over large sports stadiums). Although this approach covers a larger area, it is difficult to main-tain consistent height over the field, and safety and maintenance are sources of concern (White et al. 2012). A safer option to span long distances is to use a crane-like system. The Agricultural Irrigation Imaging System (AgIIIS) is composed of a rail mounted on a linear
move irrigation machine and can remotely sense canopy level water and nitrogen status indices in a cotton field (Haberland et al. 2010). AgIIS was built on a trolley that can travel a length of 100 m.
There exists a range of field-based phenotyping platforms, and selection depends upon the crop and desired phenotype. Most existing ground-based platforms are limited in their ability to only image the crop from one perspective, and aerial systems can only image the canopy from above. Energy sorghum canopies are dense and aerial platforms are unable to capture the necessary phenotypic traits for estimating biomass (e.g., plant height, stem width) from an above canopy view. Rovers or tractor-based systems attain the closest spa-tial proximity to crops; however, limited clearances inhibit their use if the plants grow in excess of the platform clearance, which is especially limiting for energy sorghum which can grow in excess of 4 m tall. The TERRA-MEPP platform overcomes these limitations by traversing within rather than across rows and imaging the plant from both the side and above. This enables phenotyping throughout the entire growing season while maintaining a close-up view of the crop to collect detailed plant architecture information that is otherwise unattainable.
Methods and materials
Platform design
The TERRA-MEPP robotic platform was designed to semi-autonomously navigate down a single row and view the crop from above, side and below the canopy to provide a compre-hensive phenotypic data set of each plant. An adjustable mast allows for flexible placement of sensors to adapt to changing canopy heights throughout the growing season, and a rigor-ous control scheme ensures centimeter-level precision during navigation. Computer vision imaging techniques, developed by collaborators in Baharav et al. (2017), extracted stem width and plant height from raw image data collected during summer 2016. This high-throughput robotic platform streamlines the phenotyping process and accumulates large quantities of data for energy sorghum, specifically plant architecture data, thereby increas-ing the rate of measurement and identification of high-yieldincreas-ing genotypes and projected crop yield throughout the growing season.
The concept of TERRA-MEPP was inspired by previous models of small, tactical ground robots successfully deployed in terrain mapping (Pellenz et al. 2010), search and rescue (Carlson and Murphy 2005; Liu and Nejat 2013) and military applications (Carlson and Murphy 2005; Liu and Nejat 2013). The configuration of the platform, including the mast, body, tracks and GPS is displayed in Fig. 2. The tracks are 102 mm wide (SuperDroid Robots Inc., Fuquay-Varina, NC, USA) and have an aggressive tread that enable operation in a broad range of environmental conditions, in particular saturated soil and muddy field conditions after heavy precipitation events. Also, wide tracks minimize the physical impact on the soil compared to wheeled robots (Bekker 1956). Two DG-158 A DC motors (Super-Droid Robots Inc.) capable of 200 W power output with 16.95 Nm rated torque drive to the tracks. Two 12 V, 35 Ah lead-acid batteries power the system and enable over 2 h of continuous operation—enough time to survey 0.4 ha. The platform is 480 mm wide and 1020 mm long, allowing the platform to navigate 760 mm wide crop rows without damag-ing the plants and maintaindamag-ing vertical stability. The body of the robot houses the power supply, controls, motors and electronics.
Mounted on the body of the robot is an adjustable mast constructed of four segments connected by surface-mount and pivot hinges. The mast is fully collapsible, and each seg-ment folds onto the segseg-ment directly below. The fully collapsed mast is 1.22 m tall, and each segment adds an additional 1.22 m of height to the total structure (4.88 m at the maxi-mum); the segments can easily be added or removed depending on sorghum height. The stereo camera used to measure plant height is mounted directly to the mast with a bracket system and can be easily adjusted as well. Due to the wide 170° field-of-view (FOV) of the stereo camera, discrete segments of 1.22 m, rather than a continuous structure, was satisfactory for measuring plant heights at all ranges. Discrete segments also provide the advantage of removing weight when a tall mast structure is not required early in the grow-ing season, which increases the operational time of the system.
Phenotyping sensors
Plant height and stem width are sorghum architecture traits that are highly correlated with biomass yields (Wight et al. 2012; Casa et al. 2008; Akdeniz et al. 2006). This system employs an image-based proximal sensing approach to measure plant height and stem width utilizing stereo cameras and time-of-flight (ToF) depth sensors. A DUO MLX (Code
Fig. 2 The TERRA-MEPP platform during navigation testing in the field with one mast segment deployed. The GPS is mounted to the top of the mast, and the motion controller and gyroscopic sensors are housed in a controls box located on the body of the robot. During data collection, imaging sensors are mounted to the top of the mast to measure plant height and to the body of the robot in between the treads to measure stem width
Laboratories, Inc., Henderson, NV, USA) stereo camera with 170° wide angle M8 lenses captured plant height measurements. The camera was mounted vertically at a specific loca-tion on the mast such that the top of the canopy was centered in the camera’s FOV. The DUO captured left and right images, and the disparity image was calculated and recorded simultaneously by running a custom OpenCV script through the DUO SDK. The left, right and disparity images were saved directly to an external hard drive connected via USB to the robot’s on-board computer.
To measure plant width, a CamBoard picos low resolution infrared camera (PMD Technologies AG, Siegen, Germany) was mounted horizontally at the base of the robot. Equipped with the Infineon IRS 1010C single-chip ToF sensor (Infineon Technologies AG, Neubiberg, Germany), the CamBoard Picos collects 176 × 120 pixel depth images at a frame rate of 15 fps using LightVis Studio, a standalone software developed by PMD Tech-nologies, running on the on-board computer. For consistency between manual ground truth and robot-assisted measurements, the stem width was measured at the center of the second internode (section of the stem between the first and second node).
An on-board computer, equipped with 3.1 GHz Intel Core i7-5557U CPU and 16 GB of RAM running a 64-bit version of Windows 7, powered the sensors and ran the sensor software. The sensors recorded data real-time to a 3 TB external hard drive which has a data transfer rate of up to 5 GB/s. These data were removed from the storage device and uploaded manually via a desktop uploader after each field deployment.
Autonomous navigation system
For phenotyping applications, the speed of field robot must be constant; therefore, a space-based trajectory is preferred rather than a time-space-based trajectory. In a space-space-based approach, the field robot is not constrained to be at a specific point on the reference trajectory at a specific time instant. For this application, nonlinear model predictive control (NMPC) is used because it has the capability of predicting the system behavior in a finite horizon. System configuration
The row spacing of sorghum for biofuel production varies from 0.5 m to 1 m (Broadhead and Freeman 1980; Mahmood and Honermeier 2012), with 0.75 m used in this study (see Fig. 3). The stem width of fully mature sorghum can be up to 30 mm, thus the effective row spacing is reduced to 720 mm. The width of the TERRA platform is 480 mm; therefore, there is only 120 mm of space remaining on either side of the robot. Consistent precision and positioning within these bounds is required by the navigation system to avoid crop damage.
A Septentrio Altus APS-NR2 GNSS receiver (Septentrio Satellite Navigation NV, Leuven, Belgium), with a specified accuracy of 0.03 m at 5 Hz measurement rate, was mounted on the top of the mast and obtained positional information. A PmodGYRO with a ST L3G4200D gyroscope (Digilent Inc., Pullman, WA, USA) was mounted on the body of the robot to provide motion sensing data at an output rate of 5-Hz with 1° resolution. E2 optical encoders (US Digital, Vancouver, WA, USA) on the left and right DC motors pro-vided speed information with an accuracy of 0.05 m/s.
The real-time estimation and control framework described in the following sections was implemented in LabVIEW™ (v2015, National Instrument Corporation, Austin, TX, USA) and executed in real time on the on-board computer. The control framework sends signals
to the Kangaroo × 2 motion controller (Dimension Engineering, Hudson, OH, USA) via the MyRIO real-time embedded evaluation board (National Instrument Corporation) at a sam-pling frequency of 5 Hz. A Sabertooth dual 12A motor driver (Dimension Engineering) enables control of DC motor speed; it also adds self-tuning motion control to the Sabertooth motor driver, eliminating the need to manually tune the system.
It is important to note that when the GPS is mounted to the mast on the robot (as opposed to on the robot directly), oscillations occur as the robot navigates over uneven terrain, which can affect the GPS measurements. Therefore, an accelerometer in the myRIO was used to cal-culate roll and pitch angles of the robot from which the tilt was calcal-culated given the length of the mast, and the GPS measurements were then corrected. These corrected x and y data, yaw rate from the gyro, wheel speed from the encoders, and state estimation data (e.g., yaw angle) were recorded during each trial. Additionally, the navigation and image sensor data were timestamped and geotagged with the same GPS measurements to later determine which plot the data came from.
System model
The system model of the field robot is shown in Fig. 4 and can be written as follows:
where 𝜁 ∈ ℝn𝜁 is the state vector, u ∈ ℝnu is the control input, f (⋅, ⋅) ∶ ℝn𝜁+nu→ ℝn𝜁 is
the continuously differentiable state update function and f (0, 0) = 0∀t . The derivative of
𝜁 with respect to t is denoted by ̇𝜁 ∈ ℝn𝜁 . The state and input vectors and f function are
respectively defined as follows:
(1) ̇𝜁 = f (𝜁(t), u(t)) (2) 𝜁 = ⎡ ⎢ ⎢ ⎢ ⎣ x y 𝜃 v ⎤ ⎥ ⎥ ⎥ ⎦ , u = 𝜔, f (𝜁 , u) = ⎡ ⎢ ⎢ ⎢ ⎣ v cos 𝜃 v sin 𝜃 𝜔 0 ⎤ ⎥ ⎥ ⎥ ⎦
Fig. 3 Illustration of the robot configuration in the field, including direction of motion, crop spacing and row spacing. Adapted from Baharav et al. 2017
where x, y, v, 𝜃 and 𝜔 are the position of the field robot in the x and y axes, the velocity, the yaw angle and the yaw rate, respectively.
A non-linear measurement model denoted z(t) is written as: where h ∶ ℝn𝜁+nu
→ ℝnz is the measurement function. The output vector, z , is:
State estimation
In this study, the yaw angle of the field robot cannot be directly measured; in addition, all measurable variables contain noise. Therefore, an extended Kalman filter (EKF) is used for state estimation. The general form of the estimated system model is:
where wk and vk are the process noise and measurement, respectively. They are both assumed to be independent with zero mean multivariate Gaussian noise with covariance matrices Hw and Hv respectively:
where
The estimated yaw angle of the field robot plays a very crucial role in the accuracy of tracking control because it is minimized in the cost function of the NMPC formulation. (3) z(t) = h(𝜁 (t), u(t)) (4) z =[x y v 𝜔]T (5) ̇̂𝜁 = f ( ̂𝜁, u) + w ̂ z = h(𝜁 ,̂ u)+ v (6) w ∼ N(0, Hw) and v ∼ N(0, Hv) (7) Hw= diag(0.01, 0.01, 0.01, 0.01) Hv= diag(0.03, 0.03, 0.5, 0.0175)
Fig. 4 Schematic illustration of the robot, including the motor configuration, the position of the field robot in the x and y axes, the yaw angle and the yaw rate. The GPS is mounted on the mast directly over the center of the robot
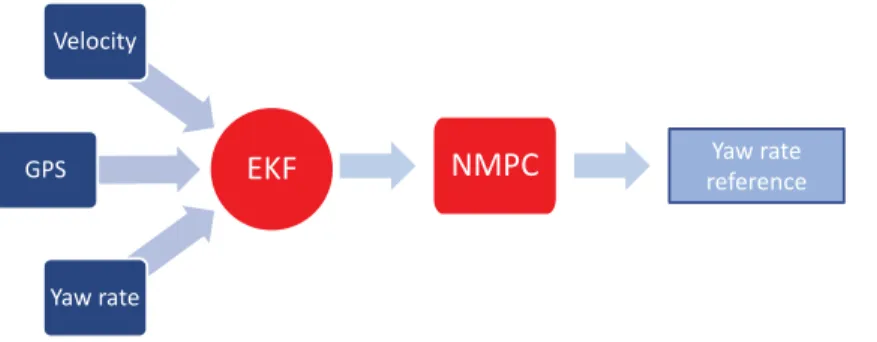
The inputs of the EKF are position, velocity and yaw rate value obtained from the gyro. The outputs of the EKF are the position of the vehicle in the x and y co-ordinate system and the yaw angle. These estimated values are then used in trajectory control; this frame-work is outlined in Fig. 5.
Control algorithm
An objective function consisting of the states and inputs of the system is minimized sub-jected to the constraints on the system’s states and inputs to find proper control actions. The following NMPC formulation is solved at each sampling time t:
where 𝜁r and ur are the state and input references, 𝜁 and u are the states and inputs,
tk is the current time, N is the prediction horizon, ̂𝜁(tk) is the estimated state vector by the EKF, 𝜁min, 𝜁max, umin and umax are respectively the upper and lower constraints on the state and input. The symmetric and positive semi-definite weighting matrices
Qk∈ ℝn𝜁×n𝜁, R ∈ ℝnu×nu and QN∈ ℝn𝜁×n𝜁 are defined as follows:
The weighting matrix R is set larger than the weighting matrix Qk to provide well damped closed-loop system behavior. The weighting matrix QN is also set larger than the weighting matrix Qk because the error at the end of the prediction horizon plays a very critical role for the stability issue (Rawlings and Mayne 2009; Mayne et al. 2000).
The constraint on the input is defined as follows:
The state and input references for the field robot are defined as follows:
(8) min 𝜁(t),u(t) 1 2 {{k+N−1 ∑ i=k+1 ∥ 𝜁r ( ti ) − 𝜁 (ti) ∥ 2 Qk+ ∥ ur ( ti ) − u(ti) ∥ 2 R } + ∥ 𝜁r ( tk+N ) − 𝜁(tk+N ) ∥2Q N } s.t. 𝜁(tk)= ̂𝜁(tk) ̇𝜁(t) = f (𝜁(t), u(t)) 𝜁min≤𝜁(t) ≤ 𝜁max t ∈[tk+1, tk+N]
umin≤u(t) ≤ umax t ∈[tk+1, tk+N−1]
(9)
Qk = diag(1, 1, 1), QN= 10 × Qkand R = 10.
(10) −0.1 ≤ 𝜔(t) ≤ 0.1
Fig. 5 EKF-NMPC framework, illustrating the velocity, GPS information and yaw rate as inputs into the EKF. The outputs of the EKF are then fed into the trajectory control algorithm
where xr and yr are the position references, 𝜔r is the yaw rate reference and the yaw angle reference is calculated from the position references as follows:
where 𝜆 describes the desired direction of the field robot ( 𝜆 = 0 for forward and 𝜆 = 1 for backward). The most recent measured yaw rate is used as the input reference to penalize the input rate in the objective function.
After the aforementioned NMPC formulation is solved, the input sequence
u(t) = [u(tk+1), … , u (
tk+N−1 )
] over prediction horizon N is obtained, and then the first ele-ment of the input sequence u(t) is applied to the field robot:
Manual control system
In addition to autonomous operation, when the field conditions included a significant num-ber of obstacles (e.g., lodged sorghum) or the robot was operated at a field without suf-ficient information to generate a reference trajectory (e.g., precision planting data), the TERRA-MEPP platform was operated manually. The manual control system included the SaberTooth self-tuning controller connected to the motors, and velocity commands for each motor were sent using a Spektrum (Horizon Hobby, Champaign, IL, USA) DX7s 7-ch transmitter and 6-channel receiver. One channel controlled the linear velocity of the sys-tem, and a second controlled the yaw rate.
System architecture and data flow
The system architecture for TERRA-MEPP is illustrated in Fig. 6. All sensors mounted on the robot are shown in the first panel, including the phenotyping sensors (stereo camera, PMD camera and customized GoPro), as well as the sensors used for navigation (gyro, RTK GPS, motor encoders). Trial runs were performed with the customized GoPro Hero 3 (GoPro Inc., San Mateo, CA, USA) sensor with a 1.19 mm hemispherical lens to collect preliminary data for extracting leaf area index (LAI) information, but these data were not fully analyzed, and results are not presented in this study. The GoPro images were stored on a SD card and then directly uploaded to Clowder via a desktop. The stereo and PMD camera are connected to the on-board PC via USB, and the data from these sensors are stored directly on an external hard drive.
After each data collection deployment, raw sensor data are retrieved off of the hard drive and uploaded to Clowder, a web-based data management system (National Center for Supercomputing Applications (NCSA) 2015), via desktop uploader. In Clowder, trait extraction algorithms can be run to obtain plant height and stem width measurements (see Baharav et al. 2017 for details regarding these algorithms). These measurements and their metadata (such as plot number, date, time, etc.) are stored in the Biofuel Ecophysiological Traits and Yields database (BETYdb), an open-access repository that facilitates organi-zation, discovery and exchange of information about plant traits, crop yields and ecosys-tem functions (LeBauer et al. 2018). Knowledge workers responsible for data analyses can
(11) 𝜁r=[xr, yr, 𝜔r ]T and ur= 𝜔r (12) 𝜃r= atan2(ẏr, ̇xr)+ 𝜆𝜋 (13) u(tk+1, 𝜁k+1 ) = u∗(t k+1 )
retrieve desired traits and other relevant data from BETYdb; note that detailed phenotypic data analyses methods are outside the scope of this paper.
As described in the previous section, the gyro, RTK GPS and motor encoders shown in panel two collect real-time information regarding the state of the robot; these meas-urements facilitate the control and navigation of the robot through the crop rows. The MyRIO is used on-board the robot, which sends measurements to the computer running LabVIEW™. These navigation sensors form a sub-system that collect and send data in real-time.
Experimental setup
Exploratory studies
The TERRA-MEPP platform design was iterated upon and field tested nearly 10 times prior to full-scale, 0.4 ha deployments to refine the sensor placements, onboard power and data visualization techniques. During these small-scale deployments in the prototyp-ing phase, the robot was driven manually. Both sensor calibration and ground truth data were collected approximately one time per week during the first few months of the 2016 growing season. Ground truth data were collected manually by field technicians by using a caliper to measure stem width and extended measuring sticks to measure plant height. Each phenotype was measured for 10 plants per plot and the number of plots included in each exploratory study deployment varied between approximately 10 to 20 plots.
After each small-scale deployment the data were analyzed, and sensor positions were refined based on the results from the computer vision processing techniques. The stereo camera initially directed horizontally at the top of the mast when the mast was just as tall as the sorghum; however, due to the variable height of the sorghum plants between
Fig. 6 System architecture and data flow diagram, illustrating how data are transferred from the sensors mounted on the robot to the on-board computing systems. The generalized steps for post-processing and trait extraction of the phenotypic data are also included, which utilize BETYdb and Clowder
varieties and the camera FOV, the mounting height needed to be sufficiently high for all varieties to ensure the top of the plant would remain in the frame, and it was recommended that the mast be raised higher than the plants. The final 2.5D depth sensor placement was 100 mm off the ground to capture the middle of the second internode, where the image pro-cessing techniques measure the stem width (Baharav et al. 2017). Depth sensor frame rates decreased from 45 fps to 15 fps to reduce power and memory consumption while maintain-ing minimum measurement error (< 10%). An onboard video display was used originally to monitor the data in real time, which required a person to walk alongside the robot. This was later upgraded to a wireless connection at the deployment tent.
Additional testing of the platform in extreme heat conditions occurred at the Univer-sity of Arizona, Maricopa Agricultural Center (MAC) associated with the U.S. Arid Land Agricultural Research Center, on June 2–3, 2016, as part of U.S. Department of Energy ARPA-E TERRA Field Day. TERRA-MEPP was manually deployed on the MAC Field Scanalyzer site using early growth corn as a surrogate for sorghum (Fig. 7). Weather condi-tions were clear each day with temperatures during operation of 80 °C and 84 °C, respec-tively. Wind speeds were low (< 10 mph) over both days, resulting in minimal to average particulate matter in the air. The robot was operated for 3 h each afternoon and captured imagery of the crop perimeter since the spacing of the corn was at 460 mm, too narrow for TERRA-MEPP to enter. The robot itself performed without any electrical or mechanical errors under the extreme heat conditions at the MAC; however, thermal shutdown of the iPad devices used for real-time visualization of the video feeds did occur twice, which is consistent with the product specifications. The formative observation associated with this field activity was mobile electronic devices (e.g., laptops and tablets) used for interaction with the robot should be operated under a canopy or tent. Thermal shutdown on the mobile devices was avoided when this practice was employed at the MAC.
Full‑scale deployments
The full-scale field trials occurred at two separate field sites, the Energy Farm (40°03′51.2″N 88°12′23.4″W) and SoyFACE (40°02′36.5″N 88°14′11.4″W) fields, near the University of Illinois at Urbana-Champaign. During the field trials, the phenotyp-ing robot achieved the data capture rate goal of one time per day, two times per week,
Fig. 7 The TERRA-MEPP platform during deployment and evaluation at the MAC during the U.S. Depart-ment of Energy ARPA-E TERRA Field Day, June 2–3, 2016
through 0.4 ha of sorghum without platform failure (i.e., the robot failed to collect usa-ble data). TERRA-MEPP was ausa-ble to traverse 0.4 ha in approximately 2 h. Figure 8
highlights the path of the robot during the experiments at each location. Each plot con-sisted of four rows of sorghum, and each row spanned 24 ranges long (not including two
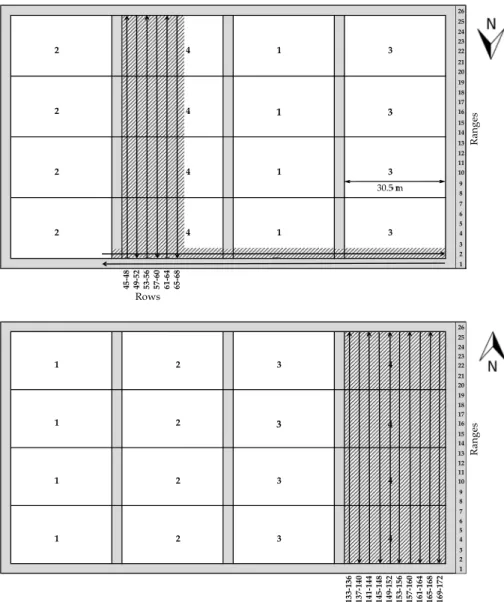
Fig. 8 The robot paths at the Energy Farm (top) and SoyFACE Field (bottom). There are four sets (labeled 1-4) per field and 26 ranges. Each set contains six ranges (along the vertical) and ten plots, with four rows per plot, with each row spaced 762 mm apart. The robot traveled between the second and third rows of each plot in the shaded areas. The black arrows indicate direction of robot travel. Set 4 was measured at each field. The complete set 4 was not measured at the Energy Farm due to significant lodging (it was difficult for a human to manually navigate this portion of the field); therefore, the first range was measured across sets 1, 3 and 4 to test the robot operating for a full 0.4 ha deployment. The full 0.4 ha deployment was measured in set 4 at the SoyFACE Field
edge ranges planted as buffer). Each set was 10 plots wide and contained 240 individual plots. The width of a single plot containing four rows was 3.06 m; therefore, a 10-plot wide set was 30.5 m. The total length of the 24 ranges was 117 m.
Each plot contained a single genetic strain of sorghum. The purpose of this planted configuration was to examine the heritability of height and width through measurements between genetic strains in each plot; therefore, the robot was required to measure one entire row per plot. The resulting data post-image processing were a single histogram of height measurements and a single histogram of width measurements for each plot in the field (Baharav et al. 2017).
Field performance and results
Field performance of the phenotyping platform
In total, the robot measured 240 plots at the SoyFACE field and 212 at the Energy Farm. The lower number of plots measured at the Energy Farm was due to lodging (bending of the stalk or entire plant) in a significant portion of the plots, making it impossible for the robot to navigate through (as well as being difficult for a human to manually navigate through); for this reason, the robot was required to be manually operated around the lodged plots. The sensors collected an average of 56.40 GB and 26.90 GB of data for the height and width sensors, respectively, totaling an average of 206 GB ha−1. This is the equivalent to 41.44 GB/h, or 184.3 MB/plot, on average. These data were stored on-board on a 1 TB external drive and unloaded after each trial. The on-board power supply sufficiently pow-ered the motors, control system, computer and sensors, and TERRA-MEPP continuously captured 0.4 ha of data without recharging.
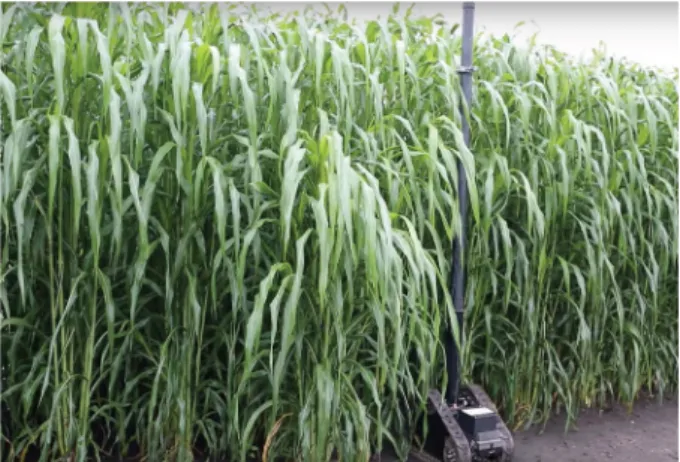
The robot was tested late in the growing season, when the sorghum was on average 3.5 m tall (see Fig. 9). During this period in the growing season (August–September), lodging was prevalent making it difficult to navigate the robot through the plots. The sys-tem did not have autonomous obstacle detection and avoidance capabilities during the experiments, and human assistance and manual navigation were necessary to clear lodged sorghum out of the robot’s path and avoid crop damage. However, the rows are normally
Fig. 9 The TERRA-MEPP plat-form being deployed in mature sorghum during August 2016. The top of the mast was raised above the canopy to its tallest height of 3.6 m above the body of the robot
clear early in the growing season, which is when the phenotyping measurements for detect-ing early changes in plant physiology and early biomass predictions occur (Mahlein et al.
2012; Montes et al. 2011). Phenotypic data
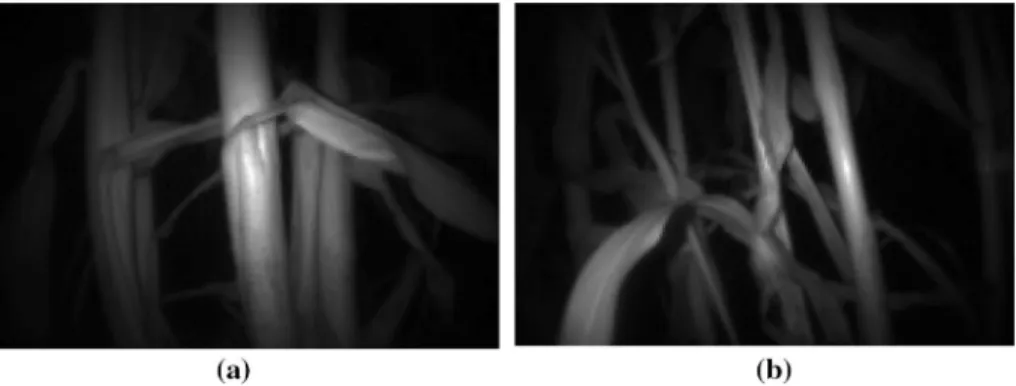
Sample images from the PMD IR depth sensor are shown in Fig. 10. The optimal posi-tion was determined to be 100 mm from the ground, mounted to the base of the robot pointed horizontally at the plants. This orientation captured the second internode of the stalk, which is the point where stem width was measured for consistency between ground truth and sensor data. The placement of this sensor was static and did not change as the sorghum grew.
Sample images from the DUO stereo camera are shown in Figs. 11a and b. This sen-sor was mounted vertically near the top of the mast such that the top of the canopy was visible in its FOV. The placement for this sensor varied each trial as the sorghum grew taller, which is why an adjustable mast was crucial. The stereo camera captured both left and right images, and the DUO SDK computed a disparity image, or depth map, shown in Fig. 11c.
Prior to deploying the phenotyping robot through 0.4 ha of sorghum, data were col-lected to validate the computer vision algorithms for extracting height and width measure-ments. The robot collected data for 10 plots, and ground truth data were collected manually for those plots on the same day using measuring tapes for plant height (measured to the nearest centimeter) and calipers for stem width (measured to the nearest hundredth of a millimeter). In each plot, 10 individual plants were manually measured, for a total of 100 ground truth points used to assess the accuracy of the imaging algorithms. Plant tags were used to match the ground truth measurements for individual plants to the extracted meas-urements from the PMD depth sensor data, as shown in Fig. 12.
Image processing algorithms developed by TERRA-MEPP project collaborators in Baharav et al. (2017) were tested on these validation data. The stem width estimation algo-rithm includes Frangi filter, Hough transform and edge and width processing techniques. The height estimation algorithm includes top contour detection, sky filtration, sun removal and top contour sampling. Both width and height estimation algorithms implement tracking
Fig. 10 Sample frames from the PMD depth sensor. The PMD was used to collect images at 15 fps and was mounted approximately 100 mm off the ground on the base of the robot to capture the second internode of the stalk
Fig. 11 The a left, b right and c disparity images recorded with the DUO camera for measuring plant height. The FOV for this sensor should optimally capture the top of the canopy in the middle of the frame. Notice the contrast between the plant leaves and the sky for conditions when the sky is both sunny and cloudy
Fig. 12 Images of sorghum stalks with identification tags corresponding to plants that have ground truth measurements. The images taken from the PMD camera are shown in a and b; RGB images recorded man-ually using a TG-4 (Olympus Corp., U.S.) from the same perspective are shown in c and d for illustrative purpose. These RGB images were not used in data analyses to calculate stem width but were only used to identify the corresponding plants in the PMD frames
to eliminate double-counting of individual plants. The results indicate that the algorithms achieve 13% average absolute error for stem width estimation and 15% average absolute error for plant height estimation. For more details on the image processing techniques used, please refer to Baharav et al. (2017).
Navigation experimental results
Experiments were conducted to evaluate the robot’s performance when following a prede-fined trajectory using the NMPC approach outlined previously. The reference generation method is as follows: the closest point on the target trajectory is computed, and the desired points in the prediction horizon are determined. Afterwards, these points are used in the cost function of the NMPC as reference values throughout the prediction horizon.
The speed of the robot was set to 0.2 m/s and the prediction horizon was set to 15 throughout the experiments. If the field robot begins off-track, the vehicle reaches the refer-ence trajectory after a short time period and remains on-track, as shown in Fig. 13a. The Euclidean error (i.e., the variance of the trajectory tracking system) was calculated using
(a)Reference and actual
trajectories (b)Euclidean error
(c) Estimated yaw angle (d)Reference and measured yaw
rate 2 4 6 8 10 12 14 16 Y axis (m) 0 5 10 15 20 25 30 X axis (m) Reference trajectory Actual trajectory 0 50 100 150 200 250 Time (s) 0 0.5 1 1.5 2 2.5 3 3.5 4 4.5 Error (m ) 0 50 100 150 200 250 Time (s) - /2 0 /2 3 /2
Yaw angle (rad)
0 50 100 150 200 250 Time (s) -0.2 -0.15 -0.1 -0.05 0 0.05 0.1 0.15 0.2
Yaw rate (rad/s)
Measurement Reference Bounds
Fig. 13 Experimental results for navigation experiments, conducted in a wet, bumpy grass field. The experi-ments tested the control scheme for both straight and curves paths, which represent navigating between rows as well as turning between plots on the perimeter of the field
raw GNSS measurements as ground truth data. Results are shown in Fig. 13b, including a mean value of 52.3 mm. Because the mean value of the path tracking algorithm variance is 52.3 mm, available space of 120 mm beside the ground vehicle is adequate to avoid crop damage in the field. The EKF performance for the yaw angle estimation is shown in Fig. 13c. It is difficult to measure the yaw angle in real-time; however, it plays a very crucial role in the navigation problem. If it is not estimated, then the system model deterio-rates and model-based controllers, e.g., NMPC, cannot be employed. Therefore, the EKF is inevitable because it provides the estimate of the yaw angle, and the framework provides an accurate trajectory tracking performance.
The output of the NMPC, reference yaw rate and the measured yaw rate are shown in Fig. 13d. The output of the NMPC reaches the bounds, but never violates them, which demonstrates the control capability of dealing with input constraints. Moreover, the perfor-mance of the low-level controller for the speed of the DC motors is sufficient.
Findings and discussion
Field deployments of the TERRA-MEPP vehicle resulted in two major findings: i) the TERRA platform, sensors and navigation system performed satisfactorily in the field and collected usable phenotypic data, and ii) based on literature review results, TERRA-MEPP is a novel design and recommendations in this document serve as a reference for field-based phenotyping robot designers and developers. Additionally, two formative observa-tions include: (i) documentation of environmental condiobserva-tions and (ii) workflow automation. Finding 1: This work demonstrated satisfactory field deployments and performance of TERRA‑MEPP, a low‑cost robotic phenotyping platform capable of collecting plant data in the field
A data collection rate of 1 × per day, 2 × per week through 0.4 ha of sorghum was achieved. Computer vision algorithms developed by Baharav et al. (2017) extracted stem width and plant height measurements from raw field data; when evaluated against human-collected ground truth measurements, their algorithms resulted in 13% average absolute error for stem width estimation and 15% average absolute error for plant height estimation. Efficient and accurate repeated measurements of highly dynamic plant phenotypes is a major chal-lenge facing plant breeding, and the TERRA-MEPP vehicle demonstrated capabilities of improving the throughput of phenotypic measurements in the field.
The use of sensors for measuring stem width and plant height information is the core system for estimating biomass and yield potential for biofuel production. Determining bio-mass during early growth states can be accomplished relatively easily because there is little visual obstruction of the plant. However, later in the growing season, measuring the entire plant is a difficult task: the canopy thickens, visual occlusions are present and lodging occurs. The demonstrated performance of the TERRA platform in these strenuous condi-tions late in the growing season is imperative to enable measurement of plant architecture phenotypes throughout the entire plant life.
Compared to existing commercial field-based phenotyping technologies, the TERRA-MEPP platform is relatively inexpensive. The overall cost of the platform, including the robot structure and mast material, is less than $15,000 USD, an affordable price point compared to other field-based robot platforms (for example, a Husky mobile base from
Clearpath Robotics can cost upwards of $30,000 USD). The image sensors used are off-the-shelf components ranging from approximately $250–$700 USD. Additionally, the gyro, motion controller and encoder sensors used for navigation were all less than $100 USD, apart from the motor board, which was just under $200 USD. Current rapid phenotyping models such as BoniRob and the LemnaTec Scanalyzer™ are prohibitively expensive and are only affordable by the largest breeders. The affordability of TERRA-MEPP is of interest to both large and small plant breeders, as well as individual farmers for crop monitoring.
Finding 2: The compact, variable design of TERRA‑MEPP is novel and can be used in different phenotyping applications that require views of the plant from in between the rows
There are many phenotyping robots, including the LemnaTec gantry system, large rov-ers, tractors, harvestrov-ers, cable or crane-based systems and aerial systems. In general, these systems are either large, prohibitively expensive, disruptive or do not capture data below the plant canopy. TERRA-MEPP addresses weaknesses in other designs and fills a niche as a compact, highly mobile, affordable rapid phenotyping system that traverses
between individual rows to obtain a side and bottom-up view of the plant. Additionally,
the adjustable mast enables data collection throughout the entire growing season. This is especially critical for energy sorghum plants, which can grow up to 4 m tall; a height that is impractical for tractor systems to measure.
The TERRA-MEPP rover is also easily transportable, making it more flexible than other platforms in the field and easier to ship long distances. The entire robot and col-lapsed mast fits into a transport case that is 1.2 × 0.8 × 0.6 m, which can be transported to various field sites by freight. Mobility to and from field sites is not an issue for some field-based phenotyping robots, such as UAVs; however, tractor systems and large gan-tries are not transportable and are normally restricted to deployment at specific fields or plots. The ability to transport and ship the TERRA-MEPP platform will allow broader use and testing of this phenotyping technology throughout various locations.
TERRA-MEPP was developed for phenotyping of energy sorghum; however, it could be deployed for phenotyping other row crops, such as maize. Crop yield increases for both maize and sorghum have plateaued in the last two decades, indicating the need for innova-tive phenotyping methods; additionally, the largest sorghum producers in the world (United States, Nigeria and Mexico from 2010 to 2014) do not have the highest yielding sorghum, which was attained by the United Arab Emirates (Food and Agriculture Organization of the United Nations (FAO) 2017). Thus, major sorghum producing countries have considerable potential yield gains to realize.
Formative observations
An analysis of the field study results yielded three formative observations: (i) docu-mentation of environmental conditions to improve the platform design and usability, (ii) redundant visualization for the quality control of data, and (iii) need for workflow auto-mation during data collection to handle the volume and veracity of inforauto-mation. These
observations suggest that appropriate human–robot interaction must be considered for the development of this category of robot.
Observation 1: Documentation of environmental conditions during testing is necessary to inform both the development of hardware and the usability of the robot
Testing was conducted primarily in the Midwestern United States where the environ-mental conditions are not considered extreme when compared to arid or tropical regions of the world (e.g., MAC). Heavy rains and wind did occur during the testing of TERRA-MEPP that caused premature lodging of sorghum plants which increased the time needed for the field experiments and magnified the need for precision navigation. Addi-tionally, ponding due to high antecedent moisture conditions created muddy rows where the tracks performed as desired but were observably less effective at times as control occurred with uncertain slip coefficients; additional time was also needed for these cor-rections. Documenting a comprehensive set of environmental conditions during testing, which was not found to be reported in the literature, informed a faster iterative process for the design, implementation and usage of TERRA-MEPP.
Observation 2: Redundant visualization capabilities are necessary for a human–robot team operating under uncertain and extreme environmental conditions
There was an observed need for a human-on-the-loop presence as part of the human–robot team to monitor sensor status and ensure that each camera was function-ing properly, and that the raw data befunction-ing collected were quality controlled. One example of a structural issue encountered was the occasional occlusion of the cameras by tillers (undesired but natural stem outgrowths of the main sorghum plants) that subtly pro-truded from the main sorghum plant into the row space. Tillers would at random times become entrained in the tracks, briefly disturbing but not stopping the robot, or bump a camera, due to their occasionally orthogonal presence with respect to the row geometry. Having redundant overlap in visualization provided a higher quality data set when these transient perturbations occurred. Finally, due to the thermal shutdown of mobile devices at the MAC, a ground control station (laptop) located under a mobile canopy provided a reliable view of the data for quality control purposes when mobile devices did fail. Observation 3: An automated workflow is required to accommodate
the volume of heterogeneous data streams from real‑time human monitoring through post‑processing
Operation of TERRA-MEPP in smaller area missions resulted in manual data offloading that was manageable, in terms of data stream organization and metadata assignment. When larger field trials were undertaken, this was not the case as the volume of data acquired by TERRA-MEPP was of the order of 247 GB ha−1 of raw image data (for only plant geometry). Automation scripts were necessary to ‘bundle’ each of the data streams per mission. The volume of raw data for phenotyping will grow exponentially with the addition of other sensors (e.g., hyperspectral cameras). It is critical, due to the per plant precision, that the location (plot and/or row) and time are recorded and logged
with each video stream or image captured, for phenotypic parameter localization; this is especially important when a human-on-the-loop is observing for quality control. Know-ing the proper frame of reference for localization will aid in not only the image process-ing but also post-processprocess-ing archivprocess-ing due to the need to fuse several large data streams on a per plant basis.
Future work
This research suggests that future work is needed to streamline and fully automate the data-to-consumer pipeline, lower usability barriers and evaluate additional sensors with the platform. Adding sensors, such as hyperspectral, LAI or thermal imaging, to meas-ure additional phenotypes will improve the value of the TERRA-MEPP system for plant breeders and researchers and enable a more robust prediction of how the genotype dictates phenotype. Figure 14 contains sample images from the customized GoPro camera with a hemispherical lens to capture bottom-up views of the canopy during preliminary field tri-als. Computer vision algorithms may be implemented on these images to characterize LAI (Banan et al. 2018), which is an important characteristic to measure in future versions of the platform because environmental influence varies LAI over the crop’s life. Addition-ally, improving the data pipeline and usability (e.g., rich environmental condition meta-data and redundant visualization) for crop breeders will support meta-data-driven agriculture and decision making. Developing crop monitoring platforms that require minimal training and are highly automated will improve the widespread adoption of robotic applications in agriculture.
Fig. 14 Sample still images from using a 1.19 mm hemispherical lens on a GoPro Hero 3 camera for a bottom-up view of the canopy. These images may be used to compute LAI and will be included in the sen-sor suite as a future part of this work
Conclusion
This work demonstrated the field deployment and performance of a low-cost (< $15 K USD) field-based rapid phenotyping system for energy sorghum. The TERRA-MEPP platform is unique in that it captures plant architecture measurements that are only visible when viewing the crop from between rows. This system was successfully deployed in sor-ghum at two different field sites during summer 2016 to collect 0.4 ha of data per day, two times per week. Data collected during these full deployments were used to measure stem width and plant height. The findings and usability observations from this work aim to con-tribute to a better understanding of best practices in field robotics for agriculture.
The TERRA-MEPP system was deployed successfully in different field conditions to collect usable phenotypic data. The platform and sensors were tested in varying conditions throughout the growing season, including in saturated soil and varying plant heights, and a full-scale deployment was carried out prior to harvest. A control scheme for the robot resulted in centimeter-level path-tracking accuracy. The robustness of this platform in dif-ficult operating conditions, such as extreme heat or muddy fields, combined with a precise navigation system are important for breeders who need to collect data for biomass estima-tion throughout the growing season without damaging the crop.
The unique design of TERRA-MEPP and performance results from this study serve as a reference document for field-based phenotyping robot designers and developers. This rover contains a mast with variable height to adjust sensor location depending on the crop height; additionally, its narrow width enables mobility between rows, rather than above rows, eliminating the clearance restrictions of tractors. Although the TERRA-MEPP sys-tem was developed specifically for sorghum, a similar design can be used in other row crops, such as maize. Additionally, the field deployment package enabled crop visualiza-tion during data collecvisualiza-tion in the field in real-time, which is important for the operator who must maintain data quality and control.
Acknowledgements The information, data, or work presented herein was funded in part by the Advanced Research Projects Agency-Energy (ARPA-E), U.S. Department of Energy, under Award Number DE-AR0000598. The views and opinions of authors expressed herein do not necessarily state or reflect those of the United States Government or any agency thereof. S. Young acknowledges Government sup-port under and awarded by DoD, Air Force Office of Scientific Research, National Defense Science and Engineering Graduate (NDSEG) Fellowship, 32 CFR 168a. The authors thank Dr. Avideh Zakhor and her research team for building the computer vision algorithms and providing results for the collected field data. We would also like to thank the TERRA-MEPP field team and Dr. Carl Bernacchi in particular for his plant biology recommendations and field technician support.
Author contributions J.P. conceived and designed the TERRA-MEPP robot and experiments; S.Y. and E.K. performed the experiments; S.Y. and E.K. analyzed the data; S.Y., E.K. and J.P. wrote the paper.
Compliance with ethical standards
Conflicts of interest The authors declare no conflicts of interest.
Open Access This article is distributed under the terms of the Creative Commons Attribution 4.0 Interna-tional License (http://creat iveco mmons .org/licen ses/by/4.0/), which permits unrestricted use, distribution, and reproduction in any medium, provided you give appropriate credit to the original author(s) and the source, provide a link to the Creative Commons license, and indicate if changes were made.
References
Akdeniz, H., Yilmaz, I., Bozkurt, M., & Keskin, B. (2006). The effect of sewage sludge and nitrogen appli-cations on grain sorghum grown (Sorghum vulgare L.) in Van-Turkey. Polish Journal of Environmental
Studies, 15(1), 19–26.
Andrade-Sanchez, P., Gore, M. A., Heun, J. T., Thorp, K. R., Carmo-Silva, A. E., French, A. N., et al. (2014). Development and evaluation of a field-based highthroughput phenotyping platform. Functional
Plant Biology, 41, 68–79.
Araus, J. L., & Cairns, J. E. (2014). Field high-throughput phenotyping: The new crop breeding frontier.
Trends in Plant Science, 19(1), 52–61.
Baharav, T., Bariya, M., & Zakhor, A. (2017). Computing height and width of in situ sorghum plants using 2.5d infrared images. In IS&T international symposium on electronic imaging computational imaging
XV (pp. 1–14). Springfield, VA, USA: Society for Imaging Science & Technology.
Banan, D., Paul, R. E., Feldman, M., Holmes, M., Schlake, H., Baxter, I., et al. (2018). High-fidelity detec-tion of crop biomass quantitative trait loci from low-cost imaging in the field. Plant Direct, 2(2), 1–8. Bangert, W., Kielhorn, A., Rahe, F., Albert, A., Biber, P., Grzonka, S., et al. (2013). Field-Robot-Based
Agriculture: “RemoteFarming.1″ and “BoniRob-Apps”. In AgEng, Internationale Tagung
Land.Tech-nik (pp. 439–445). Düsseldorf, Germany: VDI-Verlag.
Batz, J., Méndez-Dorado, A. M., & Thomasson, A. J. (2016). Imaging for high-throughput phenotyping in energy sorghum. Journal of Imaging, 2(1), 1–12.
Bekker, M. (1956). Theory of land locomotion. Ann Arbor, MI, USA: University of Michigan Press. Berni, J. A. J., Zarco-Tejada, P. J., Suarez, L., & Fereres, E. (2009). Thermal and narrowband
multispec-tral remote sensing for vegetation monitoring from an unmanned aerial vehicle. IEEE Transactions on
Geoscience and Remote Sensing, 47(3), 722–738. https ://doi.org/10.1109/TGRS.2008.20104 57. Broadhead, D. M., & Freeman, K. C. (1980). Stalk and sugar yield of sweet sorghum as affected by spacing.
Agronomy Journal, 72, 523–524.
Busemeyer, L., Mentrup, D., Möller, K., Wunder, E., Alheit, K., Hahn, V., et al. (2013). BreedVision—A multi-sensor platform for non-destructive field-based phenotyping in plant breeding. Sensors, 13(3), 2830–2847. https ://doi.org/10.3390/s1303 02830 .
Cabrera-Bosquet, L., Crossa, J., von Zitzewitz, J., Serret, M. D., & Luis Araus, J. (2012). High-throughput phenotyping and genomic selection: The frontiers of crop breeding ConvergeF. Journal of Integrative
Plant Biology, 54(5), 312–320. https ://doi.org/10.1111/j.1744-7909.2012.01116 .x.
Carlson, J., & Murphy, R. R. (2005). How UGVs physically fail in the field. IEEE Transactions on Robotics,
21(3), 423–437. https ://doi.org/10.1109/tro.2004.83802 7.
Casa, A. M., Pressoir, G., Brown, P. J., Mitchell, S. E., Rooney, W. L., Tuinstra, M. R., et al. (2008). Com-munity resources and strategies for association mapping in Sorghum. Crop Science, 48, 30–40. https :// doi.org/10.2135/crops ci200 7.02.0080.
Chapman, S. C., Merz, T., Chan, A., Jackway, P., Hrabar, S., Dreccer, M. F., et al. (2014). Pheno-copter: A low-altitude, autonomous remote-sensing robotic helicopter for high-throughput field-based phenotyp-ing. Agronomy, 4(2), 279–301.
Christiansen, M. P., Laursen, M. S., Jørgensen, R. N., Skovsen, S., & Gislum, R. (2017). Designing and test-ing a UAV mapptest-ing system for agricultural field surveytest-ing. Sensors, 17(12), 2703.
Clearpath Robotics Husky Unmanned Ground Vehicle. (2017). Retrieved July, 2017, from https ://www. clear pathr oboti cs.com/husky -unman ned-groun d-vehic le-robot /.
LemnaTec Field Scanalyzer: Automated outdoor phenotyping. Retrieved August, 2017, from http://www. lemna tec.com/produ cts/field -pheno typin g/field -scana lyzer /.
Cobb, J. N., DeClerck, G., Greenberg, A., Clark, R., & McCouch, S. (2013). Next-generation phenotyping: requirements and strategies for enhancing our understanding of genotype–phenotype relationships and its relevance to crop improvement. TAG. Theoretical and Applied Genetics., 126(4), 867–887. https :// doi.org/10.1007/s0012 2-013-2066-0.
Comar, A., Burger, P., de Solan, B., Baret, F., Daumard, F., & Hanocq, J. F. (2012). A semi-automatic sys-tem for high throughput phenotyping wheat cultivars in-field conditions: description and first results.
Functional Plant Biology, 39(11), 914–924.
Cornelissen, J. H. C., Lavorel, S., Garnier, E., Díaz, S., Buchmann, N., Gurvich, D. E., et al. (2003). A hand-book of protocols for standardised and easy measurement of plant functional traits worldwide.
Austral-ian Journal of Botany, 51(4), 335–380.
Dweikat, I., Weil, C., Moose, S., Kochian, L., Mosier, N., Ileleji, K., et al. (2012). Envisioning the transition to a next-generation biofuels industry in the US Midwest. Biofuels, Bioproducts and Biorefining, 6(4), 376–386.
Fiorani, F., & Tuberosa, R. (2013). Future scenarios for plant phenotyping. Annual Review of Plant Biology,
64, 267–291.
Food and Agriculture Organization of the United Nations (FAO). (2017). FAOSTAT. Crops (National Pro-duction). Retrieved March 6, 2017 from http://www.fao.org/faost at/en/#data.
French, A. N., Hunsaker, D. J., Clark, T. R., Fitzgerald, G. J., Luckett, W. E., & Pinter, P. J., Jr. (2007). Energy balance estimation of evapotranspiration for wheat grown under variable management prac-tices in Central Arizona. Transactions of the ASABE, 50(6), 2059–2071.
Fuglie, K. O., & Heisey, P. W. (2007). Economic returns to public agricultural research. Economic Brief (Vol. 10): U.S. Department of Agriculture Economic Research Institute.
Furbank, R. (2009). Plant phenomics: From gene to form and function. Functional Plant Biology, 36, 10–11. Golzarian, M. R., Frick, R. A., Rajendran, K., Berger, B., Roy, S., Tester, M., et al. (2011). Accurate
inference of shoot biomass from high-throughput images of cereal plants. Plant Methods. https :// doi.org/10.1186/1746-4811-7-2.
Haberland, J. A., Colaizzi, P. D., Kostrzewski, M. A., Waller, P. M., Choi, C. Y., Eaton, F. E., et al. (2010). AgIIS, agricultural irrigation imaging system. Applied Engineering in Agriculture, 26(2), 247–253.
Jensen, T., Apan, A., Young, F., & Zeller, L. (2007). Detecting the attributes of a wheat crop using digital imagery acquired from a low-altitude platform. Computers and Electronics in Agriculture,
59(1–2), 66–77.
Jiang, D., Yang, L., Li, D., Gao, F., Tian, L., & Li, L. (2014). Development of a 3D ego-motion estima-tion system for an autonomous agricultural vehicle. Biosystems Engineering, 121, 150.
Jørgensen, R., Norremark, M., Christiansen, P., Brandt, M., Schmidt, T., Laursen, M. et al. (2015). Field trial design using semi-automated conventional machinery and aerial drone imaging for outlier identification. In J. V. Stafford (Ed.), Precision agriculture ‘15—Proceedings of the 10th European
conference on precision agriculture (pp. 151–158). Wageningen, Netherlands: Wageningen
Aca-demic Publishers.
LeBauer, D., Kooper, R., Mulrooney, P., Rohde, S., Wang, D., Long, S. P., et al. (2018). BETYdb: a yield, trait, and ecosystem service database applied to second-generation bioenergy feedstock pro-duction. GCB Bioenergy, 10(1), 61–71. https ://doi.org/10.1111/gcbb.12420 .
Liebisch, F., Kirchgessner, N., Schneider, D., Walter, A., & Hund, A. (2015). Remote, aerial pheno-typing of maize traits with a mobile multi-sensor approach. Plant Methods, 11(1), 9. https ://doi. org/10.1186/s1300 7-015-0048-8.
Liu, Y., & Nejat, G. (2013). Robotic urban search and rescue: A survey from the control perspective.
Jour-nal of Intelligent and Robotic Systems, 72(2), 147–165. https ://doi.org/10.1007/s1084 6-013-9822-x. Mahlein, A.-K., Oerke, E.-C., Steiner, U., & Dehne, H.-W. (2012). Recent advances in sensing plant
dis-eases for precision crop protection. European Journal of Plant Pathology, 133(1), 197–209. https :// doi.org/10.1007/s1065 8-011-9878-z.
Mahmood, A., & Honermeier, B. (2012). Chemical composition and methane yield of sorghum cultivars with contrasting row spacing. Field Crops Research, 128, 27–33.
Mayne, D. Q., Rawlings, J. B., Rao, C. V., & Scokaert, P. O. M. (2000). Constrained model predictive control: Stability and optimality. Automatica, 36(6), 789–814.
Montes, J. M., Technow, F., Dhillon, B. S., Mauch, F., & Melchinger, A. E. (2011). High-throughput non-destructive biomass determination during early plant development in maize under field condi-tions. Field Crops Research, 121(2), 268–273.
National Center for Supercomputing Applications (NCSA). (2015). Clowder. Image and spatial data analysis division (ISDA) University of Illinois at Urbana-Champaign, IL, USA.
Pellenz, J., Lang, D., Neuhaus, F., & Paulus, D. (2010). Real-time 3D mapping of rough terrain: A field report from Disaster City. In 2010 IEEE safety security and rescue robotics (pp. 1–6). Piscataway, NJ, USA: IEEE. https ://doi.org/10.1109/ssrr.2010.59815 67.
Rasmussen, J., Ntakos, G., Nielsen, J., Svensgaard, J., Poulsen, R. N., & Christensen, S. (2016). Are vegetation indices derived from consumer-grade cameras mounted on UAVs sufficiently reliable for assessing experimental plots? European Journal of Agronomy, 74, 75–92.
Rawlings, J. B., & Mayne, D. Q. (2009). Model predictive control: Theory and design. Madison, WI, USA: Nob Hill Publishing.
Ritchie, G., Sullivan, D., Perry, C., Hook, J., & Bednarz, C. (2008). Preparation of a low-cost digital camera system for remote sensing. Applied Engineering in Agriculture, 24(6), 885–896.
Ruckelshausen, A., Biber, P., Dorna, M., Gremmes, H., Klose, R., Linz, A., et al. (2009). BoniRob-an auton-omous field robot platform for individual plant phenotyping. Precision Agriculture, 9, 841–847.