Decoupled cantilever arms for highly versatile and
sensitive temperature and heat flux measurements
The MIT Faculty has made this article openly available. Please share how this access benefits you. Your story matters.
Citation Burg, Brian R., Jonathan K. Tong, Wei-Chun Hsu, and Gang Chen.
“Decoupled Cantilever Arms for Highly Versatile and Sensitive Temperature and Heat Flux Measurements.” Review of Scientific Instruments 83, no. 10 (2012): 104902.
As Published http://dx.doi.org/10.1063/1.4758093
Publisher American Institute of Physics (AIP)
Version Author's final manuscript
Citable link http://hdl.handle.net/1721.1/86894
Terms of Use Creative Commons Attribution-Noncommercial-Share Alike
1
Decoupled cantilever arms for highly versatile and
sensitive temperature and heat flux measurements
Brian R. Burg, Jonathan K. Tong, Wei-Chun Hsu, and Gang Chen
1Department of Mechanical Engineering, Massachusetts Institute of Technology, Cambridge, Massachusetts. 02139, USA
ABSTRACT
Microfabricated cantilever beams have been used in microelectromechanical systems (MEMS) for a variety of sensor and actuator applications. Bimorph cantilevers accurately measure
temperature change and heat flux with resolutions several orders of magnitude higher than those of conventional sensors such as thermocouples, semiconductor diodes, as well as resistance and infrared thermometers. The use of traditional cantilevers, however, entails a series of important measurement limitations, because their interactions with the sample and surroundings often create parasitic deflection forces and the typical metal layer degrades the thermal sensitivity of the cantilever. The paper introduces a design to address these issues by decoupling the sample and detector section of the cantilever, along with a thermomechanical model, the fabrication, system integration, and characterization. The custom-designed bi-arm cantilever is over one order of magnitude more sensitive than current commercial cantilevers due to the significantly
2
reduced thermal conductance of the cantilever sample arm. The rigid and immobile sample section offers measurement versatility ranging from photothermal absorption, near-field thermal radiation down to contact, conduction, and material thermal characterization measurements in nearly identical configurations.
3
I. INTRODUCTION
Mismatch in the thermal expansion coefficient of different materials cause single-clamped suspended structures to deflect. This effect is particularly pronounced in microfabricated cantilever beams due to their reduced beam stiffness resulting from thin material layers. In the simplest case two materials are used in a bimorph cantilever and temperature dependent deflection can be modeled using classical Euler-Bernoulli beam theory.1
The deflection of a bimorph cantilever due to the thermal expansion mismatch can subsequently be used for calorimetric measurements by extracting the heat transfer through the cantilever once its thermomechanical properties are known. Heat flux through a structure is determined by the product of the known thermal conductance and the temperature difference between two points, thus making it a two-point measurement. In a cantilever the base temperature can be assumed to be close to the thermal reservoir temperature, while the tip temperature is proportional to the cantilever deflection. As widely used in atomic force microscopy (AFM), the cantilever
deflection can be measured down to Angstroms by reflecting a laser beam off the cantilever tip and directing it towards a position sensitive detector (PSD), providing virtually lossless
deflection amplification.2
This heat flux measurement approach provides extraordinary high sensitivity by virtue of the small cantilever thermal mass, i.e. low thermal conductance, while at the same time allowing essentially non-invasive tip temperature measurements. The sensor response is directly
4
dependent on the deflection signal and improved sensitivity is achieved by reducing the thermal conductance of the cantilever, thereby increasing the temperature gradient.
Power calibration of the system is necessary for absolute heat flux measurements. Heat generation in chemical reactions and photothermal absorption of different chemical and biological species were amongst the first applications using bimorph cantilever calorimetry.3-8 Additional temperature calibration allows absolute thermal conductance measurements.9 This approach enabled high precision near-field thermal radiation measurements between two closely spaced objects and polymer nanofiber thermal conductivity characterization.10-12 Efforts have also gone into improving the detection sensitivity of microcantilever-based calorimetry.13,14
The use of traditional cantilevers, however, entails a series of important measurement limitations because the probed sample is directly attached to the bimorph cantilever. When the bimorph cantilever simultaneously acts as a sample holder, bending can be influenced by parasitic effects, leading to measurement errors. First, stray light absorption on the bimorph detector during photothermal absorption measurements causes a frequency dependent offset error. Second, the sample deflects during measurements, which alters the sample alignment with respect to a light source during photothermal absorption measurements and causes a variation in incident light intensity which can hardly be corrected for. Third, interactions with the surroundings can affect the cantilever bending, such as in near-field thermal radiation measurements where cantilever deflection is additionally induced by electrostatic and Casimir force interaction between the cantilever and substrate. Fourth, mechanical forces acting on the sample, like in the nanofiber thermal conductivity measurement, can propagate to the cantilever and impact deflection, just as
5
well as sample weight. Fifth, measurements on a fixed sample or in contact with a substrate are not possible due to additional constraints at the point of contact. Sixth, depending on the measurement configuration, laser alignment may be challenging to avoid beam blockage, as experienced in near-field thermal radiation measurements. Lastly, there are inherent thermal conductance limitations in the traditional cantilever design, dependent on the choice of efficient bilayer material combinations, which limit potential sensitivity improvements.
Decoupling the detector- and sample section of the cantilever into two (or more) separate arms and tailoring the respective material compositions and geometries appropriately allows the above impediments to be elegantly resolved. This paper describes the principle, fabrication, and
calibration of such so-called bi-arm cantilevers. Section II introduces the concept and a thermomechanical model of the cantilevers based on Euler-Bernoulli beam theory,
demonstrating how quantitative heat flux measurements with the proposed design are possible. Approaches to optimize the device sensitivity are further discussed. Section III describes the cantilever fabrication and test platform. Calibration and performance results of the customized cantilevers are presented in section IV.
II. CONCEPT AND THEORY
In the bi-arm cantilever, the sample arm is attached to the cantilever chip base and made up of only one low thermal conductivity material layer which will not bend under temperature
influence. The detector arm, which extends from the sample arm and is thus thermally connected to it, is made up of at least two thin films with a mismatch between the respective coefficients of
6
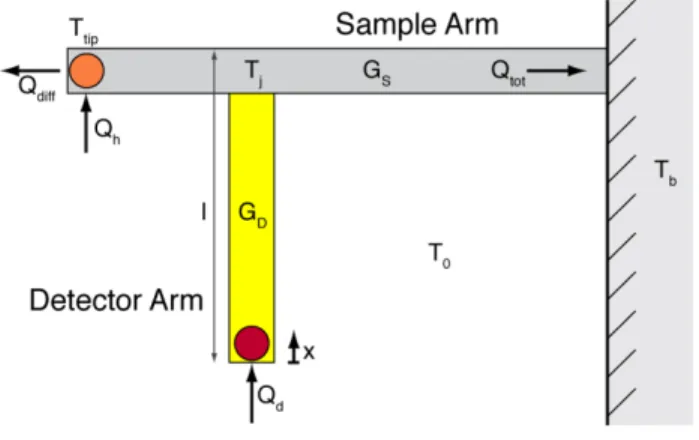
thermal expansion. This bi-arm configuration immobilizes the sample, decouples mechanical- and thermal motion during measurements, while maximizing the temperature gradient between the cantilever tip and base, consequently allowing for higher resolution measurements (Fig. 1).
FIG. 1. Euler-Bernoulli beam theory is used to model the bi-arm cantilever as a one dimensional structure and to predict its thermomechanical behavior.
The deflection of a rectangular beam composed of two materials with different coefficients of thermal expansion is given by the following differential equation, originally derived by Timoshenko from Euler-Bernoulli beam theory:1,4,15,16
(
)
( )
2 1 2 2 1 0 2 2 2 6 t t d z T x T dx γ γ t K + = ⋅ − ⋅ ⎡⎣ − ⎤⎦ , (1)where z is the vertical deflection of the cantilever at a position x along its length l, t is the layer thickness, and γ is the thermal expansion coefficient with the subscripts referring to the two layers of the sandwich structure. [T(x) − T0] is the profile of the temperature difference relative to
the ambient temperature T0 along the length of the cantilever and
1 1 1 1 2 2 3 2 2 2 2 2 1 1 4 6 t 4 t E t E t K t t E t E t ⎛ ⎞ ⎛ ⎞ ⎛ ⎞ ⎛ ⎞ = + ⎜ ⎟+ ⎜ ⎟ + ⎜ ⎟ + ⎜ ⎟ ⎝ ⎠ ⎝ ⎠ ⎝ ⎠ ⎝ ⎠, (2)
7
where E is the Young’s modulus. In this model, the temperature is constant throughout the cross section and width of the cantilever, since the cantilever is very thin and narrow compared to its length, making it a one dimensional model structure.
The temperature profile in the bimorph cantilever arm is given by the general steady-state heat conduction equation. Since a laser is used to measure the slope of the cantilever tip, the boundary condition for this system can be approximated by assuming that the laser heat is only absorbed at the tip of the cantilever. The following temperature profile in a vacuum environment neglecting convection and radiation heat losses is obtained:4,9
(
)
( ) d d 1 j D D D Q Q x T x T l x k A G l ⎛ ⎞ − = − = ⎜⎝ − ⎟⎠, (3)where Tj is the temperature at the base of the bimorph detector arm making the junction to the
single-layer sample arm (Fig. 1), Qd is the heat input by the detector laser power at the tip of the
detector arm, kD is the thermal conductivity of the detector arm, AD is the cross-sectional area of
the detector arm, and GD is the thermal conductance of the detector arm. The finite beam spot
size will not have a significant effect on the temperature profile along the cantilever.12
The cantilever junction temperature Tj in terms of the chip base temperature Tb equals
tot j b S Q T T G = + , (4)
where Qtot is the total heat flux through the lower section of the sample arm and GS is the
corresponding thermal conductance. By adding the ambient temperature T0 to both sides and
substituting, the temperature profile in the bimorph detector arm attached to the sample arm in terms of the reference temperature equals
8 0 0 ( ) ( ) d 1 tot b D S Q x Q T x T T T G l G ⎛ ⎞ − = − + ⎜ − ⎟+ ⎝ ⎠ . (5)
Integration of the beam deflection equation while modeling the detector arm as a clamped beam yields
(
0)
6(
0)
2 d tot b D S Q Q dz x H l T T dx G G ⎛ ⎞ = = − ⋅ ⋅ ⋅⎜ − + + ⎟ ⎝ ⎠, (6) with 1 2 2 1 2 2 ( ) t t H t K γ γ + = − ⋅ . (7)In the small angle limit, the slope of the bimorph cantilever arm at its tip is approximately
( 0) 0.5 dz d x dx s Δ = ≈ ⋅ , (8)
where Δd is the displacement of the reflected laser beam on the PSD and s the distance between the PSD and the cantilever.17
The measured output in terms of PSD displacement is consequently
(
0)
12 2 d tot b D S Q Q d s H l T T G G ⎛ ⎞ Δ = ⋅ ⋅ ⋅ ⋅⎜ − + + ⎟ ⎝ ⎠. (9)9
Differentiating the output displacement with respect to a uniform base temperature Tb yields the
cantilever temperature sensitivity ST:
( )
12 T b d S s H l T ∂ ∂ Δ = = ⋅ ⋅ ⋅ . (10)The calibration is accomplished by varying the temperature Tb of the cantilever support chip
through an attached heater and recording the resulting PSD signal.
When an additional heating laser Qh is added at the tip of the sample arm, the total heat flux
through the lower section of the sample arm Qtot adds up to
tot d h
Q =Q +Q . (11)
Differentiating the output displacement with respect to the heating laser power Qh yields the
cantilever heating laser sensitivity Sh:
( )
1 12 h h S T S d S S s H l Q G G ∂ ∂ Δ = = ⋅ ⋅ ⋅ ⋅ = . (12)The calibration is accomplished by varying the power output of the heating laser through operating voltage adjustments and recording the resulting PSD signal.
Subsequently the thermal conductance of the lower section of the sample cantilever arm can be extracted: GS = ST/Sh. In order to determine the sample arm tip temperature, the thermal
conductance of the entire sample arm must be known. When the sample arm consists of one all-encompassing structure and its dimensions are known, its thermal conductance can be
10
Differentiating the output displacement with respect to the detector laser power Qd yields the
cantilever detector laser sensitivity Sd:
( )
1 1 12 2 2 T d d D S D h d S S s H l S Q G G G ∂ ∂ Δ ⎛ ⎞ ⎛ ⎞ = = ⋅ ⋅ ⋅ ⎜ + ⎟ ⎜= + ⎟ ⎝ ⎠ ⎝ ⎠ . (13)The calibration is accomplished by varying the power output of the detector laser through operating voltage adjustments and recording the resulting PSD signal.
Subsequently the thermal conductance of the detector cantilever arm can be extracted: GD =
ST/[2(Sd−Sh)].
With the cantilever thermally characterized, general heat transfer measurements are able to be carried out to determine a change in the heat absorption or loss Qdiff at the tip of the sample
cantilever, such as those necessary for photothermal absorption, near-field thermal radiation and material thermal conductivity characterization. Substituting all variables and assuming that the chip temperature Tb equals the ambient temperature T0 results in the following relationship:
(
) (
)
1 diff d d h d h h Q d Q S S Q Q S ⎡ ⎤ = ⎣−Δ + − ⎦+ + , (14)where the right hand side of the equation exclusively contains known variables, consequently allowing quantitative heat flux measurements on a very small scale. Note that the temperature sensitivity ST must be known if the cantilever tip temperature is required for thermal conductance
11
In order to maximize the sensor sensitivity, the deflection signal must be as large as possible to achieve the highest possible signal-to-noise ratio (SNR). The sensitivity of the displacement signal on the PSD with respect to the measured heat flux equals
( )
12 Q diff S d s H l S Q G ∂ ∂ Δ ⋅ ⋅ ⋅ = = . (15)Therefore, to maximize the sensor SNR, the distance s between the cantilever and the PSD must be as large as possible, while the diverging laser beam does not exceed the PSD detector size and the system still fits into a reasonable setup. The thermomechanical material properties of the bimorph cantilever must also be optimally matched, represented by the parameter H, whereas material choices are rather limted.13 The bimorph cantilever length l plays an important role, while fabrication feasibility and intrinsic stress must be considered. The final approach to improve sensitivity is to reduce the thermal conductance GS of the lower section of the sample
arm.
Since the bi-arm cantilever allows separate materials to be used for the detector- and sample arm of the cantilever, an additional design parameter thus emerges in the introduced system. By independently choosing a low thermal conductivity material and small cross-sectional area for the sample arm, a dramatic improvement in the sensitivity of bimorph cantilever-based
calorimeters can be achieved.
III. EXPERIMENT
12
The proposed cantilever design is not commercially available and must be self-fabricated in a standard clean-room environment. By taking different material and process constraints into account, bi-arm cantilevers based on silicon nitride (SiNx) and gold (Au) were fabricated on a silicon (Si) substrate. The sample arm is made up of nitride while the detector arm consists of a nitride/gold bilayer.
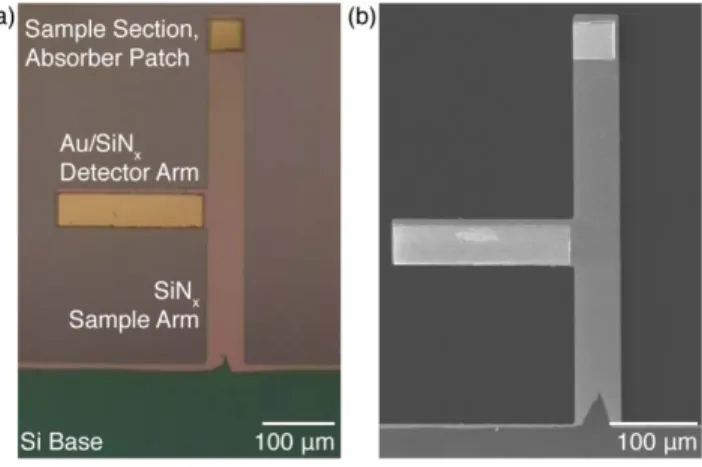
An additional metal absorber patch is added to the tip of the sample arm to allow for laser absorption during heating laser calibration, since silicon nitride is mostly transparent in the wavelength regions used. Also, the reflected laser can be tracked with a PSD in order to detect sample torsion. A cantilever width of 50 μm is chosen to focus the lasers beams onto the respective cantilever arms. The detector arm has a length of 200 μm, attached 200 μm from the base to the sample arm, while the sample arm extends an additional 250 μm (Fig. 2).
FIG. 2. The bi-arm cantilever design prevents parasitic and non-thermal bending effects by separating the detector- and sample section of the cantilever into two separate arms, while enhancing measurement versatility and sensitivity at the same time. The rigid sample arm is made up of a single-layer low conductivity material to minimize thermal conductance. The
13
detector arm is attached to the sample arm and made up of a bimorph layer to enable temperature dependent deflection and allow for optical detection. (a) Optical microscopy image. (b) Scanning electron micrograph.
Fabrication was based on 300 μm thick double side polished (DSP) 4” silicon (Si) substrates, on which 400 nm of low-stress silicon rich silicon nitride (SiNx) was grown by low pressure
chemical vapor deposition (LPCVD). A 100 nm gold (Au) layer with a 10 nm titanium (Ti) adhesion layer was structured by sputtering, photolithography and wet etching. Sputtering was chosen rather than evaporation due to lower metal deposition temperatures which induce less intrinsic stress and subsequently less initial bending in the bimorph layer. The metal to insulator thickness ratio was chosen to maximize the thermal bending response behavior.13 A second mask alignment was carried out to pattern the bi-arm cantilever structures by photolithography and reactive ion etching (RIE). Backside alignment is necessary for the final cantilever release where the bulk of the sacrificial Si substrate was etched by deep reactive ion etching (DRIE) before a final cantilever release in potassium hydroxide (KOH). After rinsing in isopropyl alcohol (IPA) and gentle nitrogen (N2) drying, a fishnet design allowed the cantilevers with a 1.5×4 mm support chip to be broken out of the substrate wafer.
B. Test Platform
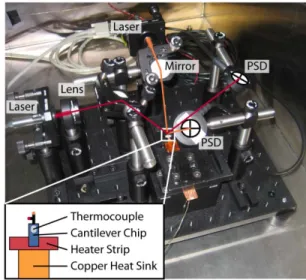
The bi-arm cantilever support chip is attached to a resistive heater strip, which itself is attached to a copper plate heat sink using a standard silver epoxy (Epoxy Technology, H20E) (Fig. 3). This configuration allows active temperature control of the cantilever base. A K type
14
thermocouple is fixed with the same silver epoxy to the support chip to monitor the induced temperature. The quick thermalization of the Si support chip makes the temperature reading independent of the thermocouple position on the chip. The cantilever support structure is then mounted to a 12”×12” optical breadboard for laser alignment (Fig. 3).
Two laser diode modules with 1 mW power output at 635 nm (Lasermate Group, LTC6351AH) are focused and aligned with a mirror onto the respective cantilever arm tips (optical components from Thorlabs). Two PSDs (Newport Corporation, OBP-U-9L) record the reflected laser beams from the cantilever arms and monitor the respective displacements and reflected power
intensities. Rubber damping feet (Thorlabs, AV1) on the breadboard are used for vibration isolation.
FIG. 3. Bi-arm cantilever experiments are carried out in a vacuum chamber on a self-contained platform mounted on an optical breadboard consisting of two focused laser diode modules, two PSDs, a cantilever base heater strip and thermocouple for temperature control.
15
The self-contained experimental setup is placed into a vacuum chamber (Kurt J. Lesker
Company, BX2424S) to eliminate convection losses from the tip heated cantilever arms. Typical pressures achieved after pump down are 1.5·10-5 torr. Customized software (National
Instruments, LabVIEW) is used to vary the output power of the laser diode modules by controlling the operating voltage from a voltage source (Keithley Sourcemeter, 2030). The program also records the various displacement and power signals from both PSDs, the support chip temperature from the thermocouple, as well as the ambient temperature from a resistance temperature detector (RTD) attached to the vacuum chamber wall, which simultaneously acts as a cold-junction compensation temperature for the thermocouple (Keithley Multimeter, 2010). Automated calibration and measurements scripts can be prepared in the software environment.
C. Heat Input
The laser diode modules in the setup serve two purposes. First, they are necessary to record cantilever deflections. Second, the absorbed portion of the incoming light on the cantilever arms serves as external heat input at the cantilever ends. By changing the intensity of the laser light, power calibration of the cantilever can be carried out to determine the thermal properties.
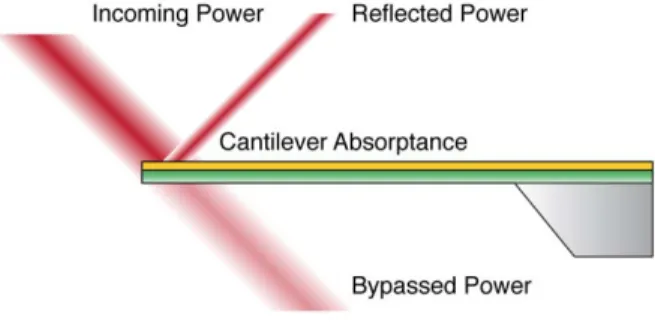
The accuracy of the absorbed power measurement is crucial to the cantilever calibration process. First, the incident power on the cantilever must be known. Since the focused laser beam diameter (~70 μm) is larger than the cantilever width (50 μm), the incoming power onto the cantilever and the bypassed power below the cantilever must be measured (Fig. 4). Their difference then equals the incident power on the cantilever tip. Second, the absorptance of the cantilever film must be
16
known. By preparing a sufficiently large sample area during the fabrication process on the substrate wafer, a spectrometer can be used to determine the optical properties of the cantilever thin film. The absorbed power by the cantilever arm then equals the product of the cantilever film absorptance and the incident power of the laser.
FIG. 4. Determining the absorbed power by the cantilever is crucial for accurate power calibration, necessary for absolute heat flux and temperature measurements.
During vacuum pump down the cantilever position changes because the loss of convective heat transfer causes a general rise in the cantilever temperature. Therefore, the incoming and
bypassed power measurements must be carried out under vacuum to avoid any systematic error related to cantilever deflection. After the laser beam is focused through a lens, it is additionally attenuated by a neutral density (ND) filter and reflected off a mirror. Incoming power
measurements are carried out at this point. The same PSDs used to measure the laser displacements are used to measure the respective laser powers (table I). The quoted power accuracy by the manufacturer is ±5%.
17
The metal film on the silicon nitride can be considered optically thick, so the Si substrate does not influence the optical characterization. Absorptance is determined by measuring the sample reflectivity after an appropriate reference measurement in a spectrometer (Perkin-Elmer LAMBDA 950 UV/Vis/NIR Spectrophotometer).
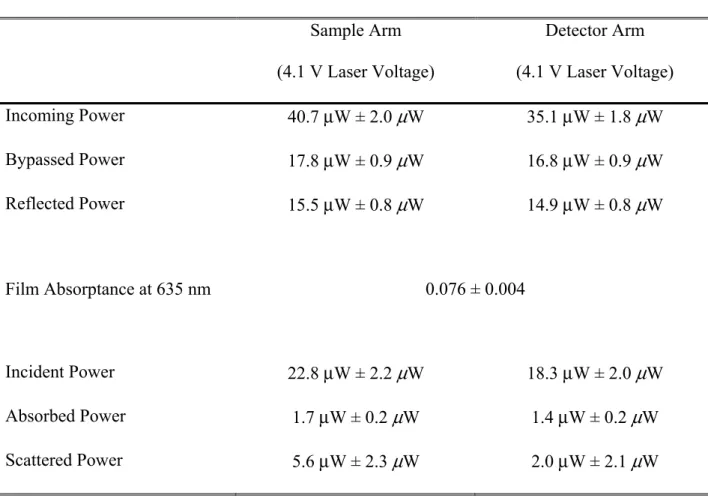
TABLE I. The measurements to determine the absorbed power by the respective cantilever arms are carried out under vacuum. The errors in the power measurements are prescribed by the probing PSD. The metal film can be considered to be optically thick. Scattered power is substantial. Sample Arm (4.1 V Laser Voltage) Detector Arm (4.1 V Laser Voltage) Incoming Power 40.7 μW ± 2.0 μW 35.1 μW ± 1.8 μW Bypassed Power 17.8 μW ± 0.9 μW 16.8 μW ± 0.9 μW Reflected Power 15.5 μW ± 0.8 μW 14.9 μW ± 0.8 μW Film Absorptance at 635 nm 0.076 ± 0.004 Incident Power 22.8 μW ± 2.2 μW 18.3 μW ± 2.0 μW Absorbed Power 1.7 μW ± 0.2 μW 1.4 μW ± 0.2 μW Scattered Power 5.6 μW ± 2.3 μW 2.0 μW ± 2.1 μW
18
The specularly reflected laser beam from the metallic surface on the cantilever arms is recorded with the PSD under vacuum during the actual laser beam displacement measurements. The diffusely scattered power off the cantilever is then evaluated by taking the difference of the incident, reflected and absorbed power. From the data in table I, it is apparent that a large fraction of the laser light is scattered off the cantilever arms and not included in the specularly reflected power. The cantilever edges are responsible for this effect. Error propagation causes the comparatively large error in the extracted scattered power signal.
IV. RESULTS
A. Thermal Characterization
For quantitative thermal measurements, the system requires three calibrations: temperature calibration, heating laser calibration, and detector laser calibration.
Temperature calibration is carried out by using the heater strip to heat the bi-arm cantilever chip base and recording the resulting laser beam displacement from the detector arm on the PSD. The base temperature is monitored by the attached thermocouple. Unidirectional temperature ramps of 1.5 K over 200 s are executed in regular increments and data is recorded at a sampling rate of 4 Hz without value averaging.
19
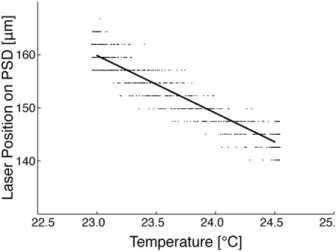
FIG. 5. The bimorph cantilever arm displays a very linear response in the relevant temperature range, validating the linear assumption of Euler-Bernoulli beam theory. The cantilever
temperature sensitivity corresponds to the slope of the linear fit.
The temperature calibration ramps evidence the linear behavior of the bimorph cantilever in the prescribed temperature range, thus validating the linear assumption of Euler-Bernoulli beam theory (Fig. 5). The extracted temperature sensitivities, which are the slopes of the
corresponding linear fits, are very consistent over 6 individual measurements and depend on both, the material properties and laser spot position (table II). Typical bimorph cantilever deflections during calibration are in the range of 500 nm, while the distance s between the cantilever and the PSD is around 10 cm.
Heating and detector laser calibrations are carried out by adjusting the operating voltage of the respective lasers, relating these settings to the incident laser power and extracting the absorbed laser power on the cantilever, while recording the resulting laser beam displacement from the detector arm on the PSD. Each power setting is held for 20 s and an average of 25 measurement points are taken while considering the uncertainty of the PSD used for power measurements.
20
FIG. 6. Heating (shown) and detector power calibrations are necessary to extract the thermal conductances of the different sections of the bi-arm cantilever. They must be carried out in the same deflection region as the temperature calibration.
The power calibration ramps again evidence the linear behavior of the bimorph cantilever in the prescribed power range (Fig. 6). The averaged displacement values show very high position confidence, while the uncertainty in the absorbed power is attributed to the quoted instrument accuracy and can only be reduced by improved instrumentation. The error bars represent a 95% confidence interval. The extracted power sensitivities, which are the slopes of the corresponding linear fits, are consistent over 6 individual measurements and depend on both, the material thermal conductivity and laser spot position (table II).
TABLE II. Temperature and power calibration must provide consistent values in separate runs to provide reliable cantilever thermal characterization. The uncertainty represents a 95% confidence interval and includes instrumentation accuracies.
21 Temperature Sensitivity ST Heating Power Sensitivity Sh Detector Power Sensitivity Sd Average over 6 measurements 378.8 μm/K ± 1.6 μm/K 1198.5μm/μW ± 145.6 μm/μW 1245.1 μm/μW ± 161.4μm/μW
The thermal conductances of the different bi-arm cantilever sections are extracted based on the sensitivities determined in the calibration measurements. The dependence on the laser spot position cancels out and only the material properties dependence remains.
The thermal conductance of the lower section sample cantilever arm with the appropriate error propagation equals GS = 0.32 μW/K ± 0.04 μW/K. By relating this thermal conductance to the
cantilever geometry, the low-stress silicon rich silicon nitride thermal conductivity is determined as kSiNx = 3.2 W/(m·K). This value is consistent with previous results.18
Since the sample arm consists of one all-encompassing structure, more specifically the same straight silicon nitride film, its full thermal conductance can be extrapolated. Design symmetry of the presented bi-arm cantilever structure implies that the thermal conductance of the upper and lower sections of the sample cantilever arm must equal each other when neglecting the area of the metal absorber patch, which only marginally influences the thermal properties due to its much higher conductance. The overall thermal conductance of the sample arm then yields GC =
22
The thermal conductance of the detector cantilever arm with the appropriate error propagation equals GD = 4.06 μW/K ± 9.48 μW/K. The high uncertainty in the value arises from the inverse
of the detector and heating laser sensitivity difference, causing a large error propagation. Although a negative thermal conductance makes no physical sense, the quoted uncertainty simply results from consequent error propagation, illustrating the difficulty in extracting an accurate value for the thermal conductance of the bimorph cantilever arm in the presented configuration. Nonetheless, the result is consistent with measurements on commercial bimorph cantilevers.9,19
The above thermal calibration allows the cantilever tip temperature to be extracted because the base temperature, as well as all heat inputs and thermal conductances are known. This complete characterization enables the system to be used as a self-contained calorimeter to thermally characterize samples and measure heat fluxes (Eq. 14).
B. Sensor Characterization
TABLE III. Relevant bi-arm cantilever material properties.
Property Silicon Nitride13,20,21 Gold13,22,23
Density ρ 3.2 g/cm3 19.3 g/cm3
Elastic Modulus E 220 GPa 55 GPa
Poisson Ratio ν 0.28 0.42
Thermal Conductivity k 3.2 W/(m·K) 245 W/(m·K) Thermal Expansion Coefficient α 0.8·10-6 K-1 14.2·10-6 K-1
23
Heat Capacity Cp 691 J/(kg·K) 129 J/(kg·K)
The cantilever frequency response sheds light on the signal noise spectrum and mechanical properties of the bi-arm cantilever. By taking the Fourier transform of the PSD displacement signal sampled at 40 kHz the dominant noise and resonance frequencies become identifiable (Fig. 7). The data further allows predictions to be made on improvements of the sensor performance when frequency modulation is used for synchronous detection.
FIG. 7. Mechanical and electrical noise dominate the sensor response below 1000 Hz. The resonance frequencies of the sample arm (1679 Hz) and bimorph detector arm (3669 Hz) are confirmed by FEM simulations.
Noise is mostly predominant at frequencies below 1000 Hz with strong mechanical contributions from the turbo- and roughing pumps, as well as electrical components. Hardly any Flicker (1/f) noise is detected while white noise is considerable.
24
Cantilever resonances for both arms are identified at 1679 Hz and 3669 Hz. Finite element modeling (FEM) confirms these findings for appropriate material properties (table III). The longer sample arm has a lower resonance frequency than the shorter and stiffer bimorph arm.
The thermal response of the cantilever is characterized by the time constant, which among other applications is used to infer the frequency modulation effectiveness. The value for a single-clamped cantilever beam with a uniform cross-sectional temperature is modeled from the Fourier number:4,24 2 2 p l C k ρ τ = , (16)
where ρ is the density and Cp the heat capacity of the material (table III). The factor of 2 is
introduced to account for the temperature variation along the length of the cantilever with an equivalent average temperature when the cantilever is heated at the tip.4 Considering the entire length of the sample arm (l = 400 μm) and the extracted thermal conductivity of silicon nitride, a bi-arm cantilever thermal time constant of τ = 55 ms is expected.
25
FIG. 8. The cantilever deflection signal is recorded after the heating laser is switched off. The signal change with respect to time is then fitted to an exponential decay (inset). The thermal time constant characterizes the response time of the cantilever sample arm.
Switching off the heating laser and recording the resulting deflection laser displacement allows the thermal time constant to be measured by fitting the signal change to an exponential decay of the form A(1-e-t/τ)+B (Fig. 8). The result yields a thermal time constant of τ = 75 ms. In essence, following an impulse, 63% of the signal is recovered during the thermal time constant. The deviation from the predicted theoretical value is due to the fact that the model only crudely accounts for a temperature variation along the length of the cantilever.4
The second PSD in the system monitors the torsion of the sample arm. It is placed at
approximately the same distance from the cantilever as the other PSD and therefore both results of laser beam displacement on the PSD can be compared.
FIG. 9. Torsion in the sample arm is existent, albeit at a small scale. The discrete position steps are caused by the PSD resolution.
26
Although the tip of the sample arm is not completely immobile, its displacement is roughly 30× smaller than for the detector arm (Fig. 9). The bimorph cantilever induces rotation on the sample arm through its torque.
The dynamic range is another important metric of interest for sensors and describes the range in which the system behaves as predicted during calibration. Since cantilever-based calorimetry relies upon Euler-Bernoulli beam theory, the linear cantilever deflection range corresponds to the sensor dynamic range. In the presented setup, when the base temperature is increased by 10 K, the bimorph cantilever deflection becomes so strong that the deflected laser beam, which is diverging, starts to move off the PSD detector. The observed dynamic range is consequently a system limitation owing to the PSD detector size and ultimately not due to non-linear cantilever bending.
V. DISCUSSION AND CONCLUSION
It is important to realize that once the thermal characterization of the bi-arm cantilever has been completed, and in particular the thermal conductance of the sample arm determined, there is no more need for heating the tip of the sample arm. The heating laser is solely necessary for calibration purposes.
Two important consequences arise. First, stray light absorption during photothermal absorption measurements and geometric alignment constraints during near-field radiation measurements are
27
avoided. Second, in the absence of heat loss from the cantilever tip, the temperature at the tip of the sample arm equals the temperature at the junction between the detector and sample arm. In the event of heat exchange at the cantilever tip, the tip temperature is deduced using the extrapolated upper sample arm thermal conductance, an indispensable parameter to determine the thermal conductance of attached samples or between gaps. The comparatively small
temperature differences justify the omission of thermal radiation losses in the thermomechanical analysis.
Table IV gives an overview of the most relevant key characteristics of the introduced bi-arm cantilever. Power and temperature values are representative.
TABLE IV. Summary of typical bi-arm cantilever sensor characteristics. Key Characteristics
Lower Sample Arm Conductance GS 0.32 μW/K ± 0.04 μW/K
Detector Arm Conductance GD 4.06 μW/K ± 9.48 μW/K
SiNx Thermal Conductivity kSiNx 3.2 W/(m·K)
Heat Input Qd 1.5 μW
Base Temperature Tb 23°C
Tip Temperature Ttip 28°C
Detector Arm Deflection Range w 500 nm
28
Steady-State 5 nW
Modulated (< 2 Hz) 25 pW
Temperature Resolution Tmin 16 mK
Thermal Time Constant τ 75 ms
Dynamic Range R 10 K
In comparison to commercially available standard bimorph cantilevers, the sensor sensitivity of the calorimeter using the bi-arm design is increased by roughly a factor of 15 when it is directly related to the thermal conductance of the cantilever.9,19 Compared to alternate state-of-the-art microfabricated calorimeter designs, the thermal conductance of the system is reduced by a factor of 2, thus potentially doubling the sensor sensitivity.25 Naturally other factors, in particular the bimorph material matching, system arrangement and noise also play a role (Eq. 15).
The full potential of the system is explored for quasi steady-state measurements which are particularly relevant for temperature measurements and more involved calorimetry
configurations, such as near-field radiation measurements and material thermal conductivity characterization, where the influence of external transients must be avoided. Specifically, the minimum detectable power and temperature resolution are of relevance. These limits are determined by evaluating SNR>1. For an average of 25 laser displacement position
29
the presented setup and components. Adopting this value as signal noise and relating it to the respective power and temperature sensitivities (table II), a confirmed temperature resolution of Tmin = 16 mK and minimum detectable power of Pmin = 5 nW is achieved (table IV). These
values are unprecedented for steady-state cantilever-based calorimetry.4,9,13,25
The absolute detection limit of cantilever-based calorimeters is given by the thermomechanical noise level, corresponding to the thermal vibrations of the sensor.4,13 Modulating the heat input while using synchronous detection reduces the noise equivalent bandwidth and enables
approaching this fundamental limit. However, the square wave modulation must allow the cantilever sufficient response time. The thermal response of the cantilever follows the behavior of a first-order system and the cut-off frequency f0 is usually considered to be f0 = 1/(2πτ) ≈ 2
Hz, where the deflection amplitude reduces by a factor of .26 Such low modulation
frequencies are possible and significantly suppress noise levels, although only for photothermal absorption measurement applications.4,13,25,26 The measured noise amplitude on the PSD for these frequencies is in the range of 30 nm, obtained by taking the Fourier transform of the PSD
response signal, to yield an expected minimum detectable power of Pmin = 25 pW for
synchronous detection (table IV). This value is higher than for comparable studies due to much higher parasitic noise in the present setup. 4,13,25,26 One potential noise origin is the diverging low-power laser beam incident on the PSD. Continuing studies on improving the noise level must be pursued to enhance the sensor performance.
General cantilever sample arm stiffness can be enhanced with a triangular design. Adjustments in the thermomechanical model to account for two support arms of the cantilever are, however,
30
necessary. Alternate designs with, for example, angled or even curved arms for more targeted experiments, depending on the respective requirements, are also possible. The only requirement is a thermal connection between the isolated sample and detector arms. An optimized design for higher sensor sensitivity uses aluminum (Al) as metal layer.13 Since KOH, however, strongly etches Al, xenon difluoride (XeF2) is required in this case for the final cantilever release.
In conclusion, by decoupling the detector- and sample section of the cantilever into two separate arms, three major improvements in cantilever-based calorimetry have been achieved. First, parasitically induced cantilever bending is avoided. Second, measurement versatility is enhanced by virtue of the geometric design. And third, the sensor sensitivity is significantly enhanced due to the low conductance of the independent single-layer sample arm. The design opens up
prospects in particular for considerably more precise and accurate photothermal absorption, near-field thermal radiation down to contact and material thermal characterization measurements on very small scales.
31
ACKNOWLEDGEMENTS
The authors thank Poetro Sambegoro, Anastassios Mavrokefalos, Kenneth McEnaney, and Kimberlee Collins for helpful discussions, Daniel Kraemer for access to the vacuum chamber, Lee Weinstein for support with finite element simulations, as well as Joseph Sullivan from the Photovoltaic Research Laboratory at MIT for assistance with the spectrometer measurements. This work was carried out in part through the use of MIT’s Microsystems Technology
Laboratories. Electron microscope imaging was carried out at Boston College’s Integrated Sciences Cleanroom and Nanofabrication Facility. The research is supported by the U. S.
Department of Energy, Office of Science, Office of Basic Energy Sciences, Division of Materials Science and Engineering (DE-FG02-02ER45977, B.R.B, J.K.T and G.C.), the U. S. Department of Defense, Air Force Office of Scientific Research, Multidisciplinary University Research Initiative (UIUC FA9550-08-1-0407, W.-C.H.) and the National Research Fund, Luxembourg, cofunded under Marie Curie Actions of the European Commission (FP7-COFUND 893874, B.R.B).
32
REFERENCES
1. S. Timoshenko. J. Soc. Opt. Am. 11, 233 (1925).
2. G. Meyer and N. M. Amer. Appl. Phys. Lett. 53, 1045 (1988).
3. J. K. Gimzewski, C. Gerber, E. Meyer, and R. R. Schlittler. Chem. Phys. Lett. 217, 589 (1994).
4. J. R. Barnes, R. J. Stephenson, C. N. Woodburn, S. J. O’Shea, M. E. Welland, T. Rayment, J. K. Gimzewski, and C. Gerber. Rev. Sci. Instrum. 65, 3793 (1994).
5. J. R. Barnes, R. J. Stephenson, M. E. Welland, C. Gerber, and J. K. Gimzewski. Nature
372, 79 (1994).
6. P. G. Datskos, S. Rajic, M. J. Sepaniak, N. Lavrik, C. A. Tipple, L. R. Senesac, and I. Datskou. J. Vac. Sci. Technol. B 19, 1173 (2001).
7. E. T. Arakawa, N. V. Lavrik, S. Rajic, and P. G. Datskos. Ultramicroscopy 97, 459 (2003).
8. A. R. Krause, C. Van Neste, L. Senesac, T. Thundat, and E. Finot. J. Appl. Phys. 103, 094906 (2008).
9. S. Shen, A. Narayanaswamy, S. Goh, and G. Chen. App. Phys. Lett. 92, 063509 (2008). 10. S. Shen, A. Narayanaswamy and G. Chen. Nano Lett. 9, 2909 (2009).
11. E. Rousseau, A. Siria, G. Jourdan, S. Volz, F. Comin, J. Chevrier, and J.-J. Greffet. Nat. Photon. 3, 514 (2009).
12. S. Shen, A. Henry, J. Tong, R. Zheng, and G. Chen. Nat. Nanotechnol. 5, 251 (2010). 13. J. Lai, T. Perazzo, Z. Shi, and A. Majumdar. Sensor Actuat. A-Phys. 58, 113 (1997).
33
14. B. Kwon, C. Wang, K. Park, R. Bhargava, and W. P. King. Nanoscale Microscale Thermophys. Eng. 15, 16 (2011).
15. W.-H. Chu, M. Mehregany and R. L. Mullen. J. Micromech. Microeng. 3, 4 (1993). 16. W. C. Young and R. G. Budynas, Roark’s Formulas for Stress and Strain, 7th ed.
(McGraw-Hill, New York, 2001).
17. A. M. Moulin, R. J. Stephenson and M. E. Welland. J. Vac. Sci. Technol. B 15, 590 (1997).
18. D. Song, Ph. D. thesis, University of California, Los Angeles, 2003. 19. A. Narayanaswamy and N. Gu. J. Heat Transfer 133, 042401 (2011). 20. J. J. Vlassak and W. D. Nix. J. Mater. Res. 7, 3242 (1992).
21. M. J. Madou, Fundamentals of Microfabrication: The Science of Miniaturization, 2nd ed. (CRC Press, Boca Raton, 2002).
22. H. D. Espinosa and B. C. Prorok. J. Mater. Sci. 38, 4125 (2003).
23. A. J. Schmidt, R. Cheaito and M. Chiesa. J. Appl. Phys. 107, 024908 (2010).
24. F. P. Incropera, D. P. DeWitt, T. L. Bergman, and A. S. Lavine, Introduction to Heat Transfer, 5th ed. (John Wiley & Sons, Hoboken, 2006).
25. S. Sadat, Y. J. Chua, W. Lee, Y. Ganjeh, K. Kurabayashi, E. Meyhofer, and P. Reddy. App. Phys. Lett. 99, 043106 (2011).