• Aucun résultat trouvé

Spatial distribution of local patch extinctions drives recovery dynamics in metacommunities

N/A
N/A
Protected

Academic year: 2021

Partager "Spatial distribution of local patch extinctions drives recovery dynamics in metacommunities"

Copied!
46
0
0

Texte intégral

(1)

HAL Id: hal-03066561

https://hal.umontpellier.fr/hal-03066561

Preprint submitted on 15 Dec 2020

HAL is a multi-disciplinary open access

archive for the deposit and dissemination of

sci-entific research documents, whether they are

pub-lished or not. The documents may come from

teaching and research institutions in France or

abroad, or from public or private research centers.

L’archive ouverte pluridisciplinaire HAL, est

destinée au dépôt et à la diffusion de documents

scientifiques de niveau recherche, publiés ou non,

émanant des établissements d’enseignement et de

recherche français ou étrangers, des laboratoires

publics ou privés.

Emanuel A Fronhofer

To cite this version:

Camille Saade, Sonia Kéfi, Claire Gougat-Barbera, Benjamin Rosenbaum, Emanuel A Fronhofer.

Spatial distribution of local patch extinctions drives recovery dynamics in metacommunities. 2020.

�hal-03066561�

(2)

Spatial distribution of local patch extinctions drives

recovery dynamics in metacommunities

Camille Saade

∗1

, Sonia K´efi

1,2

, Claire Gougat-Barbera

1

, Benjamin

Rosenbaum

3,4

, and Emanuel A. Fronhofer

∗1

1

ISEM, CNRS, Univ. Montpellier, IRD, EPHE, Montpellier, France

2

Santa Fe Institute, 1399 Hyde Park Road, Santa Fe, NM 87501, USA

3

German Centre for Integrative Biodiversity Research (iDiv), Halle-Jena-Leipzig

4

Institute of Biodiversity, Friedrich Schiller University Jena, Jena, Germany

Corresponding authors: camille.saade@umontpellier.fr; emanuel.fronhofer@umontpellier.fr

(3)

Abstract

1

Human activities lead more and more to the disturbance of plant and animal communities with

2

local extinctions as a consequence. While these negative effects are clearly visible at a local scale,

3

it is less clear how such local patch extinctions affect regional processes, such as metacommunity

4

dynamics and the distribution of diversity in space. Since local extinctions may not be isolated

5

events in space but rather clump together, it is crucial to investigate their effects in a spatially

6

explicit framework.

7

Here, we use experimental microcosms and numerical simulations to understand the relation-

8

ship between local patch extinctions and metacommunity dynamics. More specifically, we in-

9

vestigate the effects of rate and spatial clumping of extinctions in a full factorial design. Exper-

10

imentally, we found that local patch extinctions increased inter-patch (β -) diversity by creating

11

differences between extinct and non-extinct patches and at the same time increased local (α-) di-

12

versity by allowing inferior competitors to persist. Most importantly, recolonization dynamics

13

depended more strongly on the spatial distribution of patch extinctions than on the extinction rate

14

per se. Clumped local patch extinctions reduced mixing between extinct and non-extinct patches

15

which led to slower recovery, lower α-diversity in non-extinct patches and higher β -diversity. Re-

16

sults from a metacommunity model matched the experimental observations best when the model

17

included a competition-colonization trade-off, giving a hint at the underlying mechanisms.

18

Our results highlight that local patch extinctions can increase the diversity within and between

19

communities, that the strength of these effects depends on the spatial distribution of extinctions

20

and that the effects of local patch extinctions can spread regionally, throughout a landscape. These

21

findings are highly relevant for conservation and management of spatially structured communities

22

(4)

Introduction

24

Understanding the causes and consequences of local extinctions and how they affect biological

25

systems at larger spatial scales lies at the heart of spatial ecology. Natural metapopulations and

26

metacommunities – sets of local populations and communities linked by dispersal (Levins, 1969)

27

– naturally experience local extinctions (Hanski and Kuussaari, 1995; Altermatt and Ebert, 2010;

28

Fronhofer et al., 2012), for instance, due to demographic stochasticity, natural disasters or disease

29

outbreaks. In addition, global changes – including climate change, habitat loss and fragmenta-

30

tion due to land-use changes, deforestation and urbanization – put increasing stress on ecological

31

communities (Millennium Ecosystem Assessment, 2005; IPBES, 2019) which contributes to local

32

patch extinctions.

33

Local patch extinctions, which we here define as the disappearance of all biomass from a

34

patch, can have various consequences. In trophic systems, sustained local patch extinctions can

35

induce regional species extinctions (Liao et al., 2017; Ryser et al., 2019) and thus reduce regional

36

diversity. Top predators are more likely to go extinct than intermediate species, some of which

37

can even benefit from local patch extinctions due to the release from predation pressure. However,

38

microcosms experiments on a competitive community with a competition-colonization trade-off

39

show that occasional local patch extinctions can prevent regional extinctions and increase regional

40

diversity by allowing less competitive species to persist (Cadotte, 2007).

41

One important factor mitigating the effect of local patch extinctions is the fact that metacom-

42

munities are spatially structured. The coupling of spatially distinct communities can reduce the

43

effect of local extinctions if individual local communities face them at different times: patches

44

left empty by a local extinction event can be recolonized through dispersal of individuals from

45

patches that are occupied. Finally, a spatially structured habitat can increase overall species diver-

46

sity by allowing competitors to coexist at the scale of the landscape (Brown and Kodric-Brown,

47

1977; Hanski, 1983; Harrison, 1991). However, dispersal between local communities can also have

48

detrimental effects by synchronizing populations and thereby decreasing spatial insurance effects

49

(Abbott, 2011). Under strong dispersal, the effects of local extinctions can even spread throughout

50

(5)

a metacommunity (Gilarranz et al., 2017; Zelnik et al., 2019) such that local events have a regional

51

effect.

52

One likely important factor that modulates the effects discussed above is the spatial distribution

53

of local patch extinctions, for instance, whether they are clumped in space or not. An increase in the

54

spatial clumping of local extinction events could have a destabilizing effect at the metacommunity

55

scale by coupling local dynamics and thus increasing global extinction risk (Ruokolainen, 2013;

56

Kahilainen et al., 2018). Indeed, climate models have predicted an increase in the spatial and

57

temporal autocorrelation of temperature (Di Cecco and Gouhier, 2018), implying an increase in

58

the environmental similarity between communities in space and time. This is expected to result in

59

more climate extremes, such as heatwaves, droughts or frosts, affecting increasingly larger areas

60

and for a longer time. Such climatic extremes can lead to local extinctions of populations of

61

organisms sensitive to temperature changes, as seen in episodes of coral bleaching (Carpenter

62

et al., 2008) or forest die-offs (Allen et al., 2010).

63

Despite this trend of climate data and predictions showing an increase in spatial and temporal

64

correlation of temperature (Di Cecco and Gouhier, 2018) that could result in a greater number of

65

climate-induced local extinctions and a stronger spatial clumping of these events, few studies have

66

considered the spatial structure and extent of local extinctions, leaving a gap in our understanding

67

of how spatially clumped extinctions may affect the dynamics of ecological systems.

68

Here, we investigate how the rate and spatial distribution of local patch extinctions affect recol-

69

onization dynamics in metacommunities. We were particularly interested in determining whether

70

the effects of local patch extinctions can spread in space and have regional effects on metacommu-

71

nities. Using a full factorial design crossing three levels of extinction rates and two levels of spatial

72

clumping, we forced local patch extinctions in experimental and simulated metacommunities and

73

followed community dynamics in each patch during the recolonization process. We were able to

74

show that the effects of local patch extinctions on the metacommunity depend more on the spatial

75

distribution of those extinctions than on their rate, and that local patch extinctions can increase

76

(6)

Material and methods

78

We used a combination of laboratory experiments with metacommunities of three freshwater cil-

79

iates (Tetrahymena thermophila, Colpidium sp. and Blepharisma sp.) in microcosm landscapes

80

and mathematical modelling of metacommunities to address our main research question. To do

81

so, we forced local patch extinctions (not sustained in time, i.e., ‘pulse’ perturbations; see (Bender

82

et al., 1984)) in experimental microcosm landscapes (Altermatt et al., 2015) and followed meta-

83

community recovery in terms of species diversity and biomass as a function of the intensity (rate

84

of extinctions) and spatial distribution (clumped vs. dispersed) of the extinctions. Experiments

85

and simulations followed the dynamics of metacommunities in landscapes made of 16 patches

86

arranged in a square lattice and connected by active dispersal.

87

Experiments

88

We used experimental landscapes made of 16 vials connected to their 4 nearest neighbours, al-

89

lowing individuals to disperse from one patch to another. Local patch extinctions consisted in

90

removing all individuals of all species in a given patch. Each patch was initially inoculated with

91

one of the three species at half its carrying capacity. Extinctions were implemented once, two

92

weeks after inoculation to allow for community assembly to have taken place. Subsequently, we

93

then observed the recovery of the landscapes for two weeks. In order to explore the effects of the

94

rate of local patch extinctions and their spatial clumping on the dynamics of metacommunities, we

95

used a full factorial design crossing three levels of local patch extinctions (0, 4 or 8 simultaneous

96

extinctions out of 16 patches) with two levels of spatial clumping (clumped: Fig. S1 landscapes

97

7-9 and 13-15; dispersed: Fig. S1 landscapes 4-6 and 10-12). This design yielded a total of 5

98

treatments (no extinction, 4 clumped extinctions, 4 dispersed extinctions, 8 clumped extinctions,

99

8 dispersed extinctions) that were each replicated in 3 landscapes, for a total of 15 landscapes and

100

240 patches. We followed the metacommunity dynamics through time by measuring the density

101

(7)

Species

103

We used three freshwater ciliate species commonly used in microcosms experiments (Diehl and

104

Feissel, 2001; Cadotte, 2006; Worsfold et al., 2009): Tetrahymena thermophila (Tet) is a small

105

(50 µm, Fig. S2) bacterivore, Colpidium sp. (Col) is a medium-sized (120 µm, Fig. S2) bacterivore

106

and Blepharisma sp. (Ble) is a big (200 µm, Fig. S2) omnivore feeding on bacteria and a smaller

107

ciliates. In this experimental system, all three species feed on the bacteria Serratia marcescens as a

108

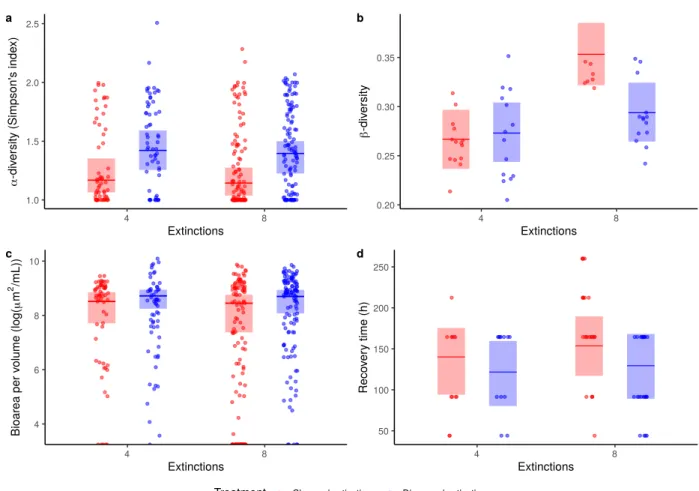
common resource and thus constitute a competition network. In addition, the biggest Blepharisma

109

sp. individuals could also feed on T. thermophila. We determined the species demographic traits in

110

preliminary single patch experiments: the species show differences in population growth rate (Tet

111

> Col > Ble), carrying capacity (Tet > Col > Ble) (Fig. S3) and interspecific competitive ability

112

(Tet < Col < Ble) (Fig. S4). Based on their population growth rates and competitive abilities,

113

these species can be described as an ecological succession: T. thermophila density peaks after

114

approximately two days, Colpidium sp. density peaks after approx. five days and Bleparisma sp.

115

grows slowly and dominates the community after around 16 days (Fig. S4) in our experimental

116

setting.

117

We did not quantify dispersal in isolation, but used movement speed observed in situ as a

118

proxy of dispersal ability, as these two traits are usually well correlated (Fronhofer and Altermatt,

119

2015; Pennekamp et al., 2019). Generally, Colpidium sp. is faster than both T. thermophila and

120

Blepharisma

sp. – which move at roughly the same speed (Fig. S5).

121

Culture conditions

122

The species were kept in 20 mL of a standardized medium made of water (Volvic), dehydrated

123

organic salad (1 g of salad for 1.6 L of water) and bacteria (Serratia marcescens) at 10% of their

124

maximum density (obtained by a tenfold dilution of a one week old culture) as a common resource.

125

The cultures were refreshed three times a week by replacing 2 mL of each culture with 2 mL of

126

fresh, bacterized medium. The cultures were kept in a room with controlled temperature (20

C).

127

In order to exclude any potential confounding effects due to landscape positioning, the position

128

(8)

and orientation of landscapes was randomized and changed three times per week.

129

Landscape design

130

We used landscapes made of 16 vials (20 mL Sarstedt tubes) arranged in a square lattice and con-

131

nected by silicon tubes (length: 6 cm, inner diameter: 4 mm). The silicon tubes were closed with

132

clamps to control dispersal. The clamps were opened for 4 hours three times per week (after

133

medium replacement) to allow dispersal. Each patch was initially inoculated with one of the three

134

species at half of its carrying capacity at the beginning of the experiment. Initial species distri-

135

butions were drawn at random so that one species initially occupied 6 patches and the two others

136

occupied 5 patches in each landscape. We then followed community assembly for two weeks

137

before forcing extinctions of all individuals of all species in selected patches and following the

138

recolonization of those patches for two more weeks. Along with the landscapes, we also kept 9

139

monocultures (3 replicates per species) in single patches to provide a training data set for auto-

140

mated species identification (Pennekamp et al., 2017).

141

Extinction patterns

142

The extinction patterns (Fig. S1) were chosen to either maximize (clumped extinctions) or mini-

143

mize (dispersed extinctions) the percentage of like adjacencies (pladj). The pladj is calculated as

144

the proportion of connections in a landscape that link two patches of the same kind (i.e., extinct

145

with extinct or non-extinct with non-extinct) and is a measure of the spatial clumping of the extinc-

146

tions (pladj is close to 1 when extinctions are clumped, and close to 0 when they are dispersed).

147

Because the landscapes are relatively small, the connectivity (i.e., the number of connections) of

148

a patch varies depending on their position in the landscape. In order to minimize potential edge

149

effects, we chose to draw the extinct patches only from the sets of patches with a mean connec-

150

tivity of three, which is the mean connectivity of the landscape. This ensured that corners, edges

151

and central patches were equally represented in clumped and dispersed treatments, making them

152

similar in terms of position relative to the edge. The drawing of extinction patterns was done by i)

153

(9)

calculating the mean connectivity of all sets of 4 or 8 patches and keeping only those of connectiv-

154

ity 3, ii) calculating the pladj of the remaining sets and keeping only those with the highest pladj

155

(for clumped extinctions) or lowest pladj (for dispersed extinctions) and iii) drawing an extinc-

156

tion pattern for each landscape among the remaining sets. We performed local patch extinctions

157

by transferring the content of non-extinct patches to an identical new landscape in which extinct

158

patches were not transferred and replaced by fresh bacterized medium instead.

159

Data acquisition

160

The 2 mL of medium taken out of the patches and monocultures during medium replacement were

161

used as samples to estimate the density of each species in each patch. For each patch and mono-

162

culture, 250 µL were put between two microscope slides (height: 500 µm) and filmed — using

163

an optical stereo-microscope (Perfex Pro 10) coupled with a camera (Perfex SC38800) — for 10

164

seconds (150 frames).

165

Species identification

166

The three species differ in size, shape and behavior which allows for automated species identifica-

167

tion (Pennekamp et al., 2017). The videos were analyzed with the Bemovi R-package (version 1.0)

168

(Pennekamp et al., 2015) to track individuals and characterize their shape and trajectories (speed,

169

size). The individuals were then identified from their characteristics (entire output of bemovi anal-

170

ysis) using a random forest algorithm (R-package randomForest version 4.6-14) trained on videos

171

of the monocultures filmed on the same day (Pennekamp et al., 2017). We rejected all the indi-

172

viduals with an identification confidence (proportion of trees leading to that identification) lower

173

than 0.8 as a good compromise between the number of observations discarded and the confidence

174

(10)

Diversity measures

176

α -diversity was measured as the inverse of the Simpson’s index, which represents an effective

177

number of species (Jost, 2006), and takes the relative abundance of different species into account.

178

We used the function beta.div.comp (R-package adespatial version 0.3-8, Ruzicka-based index) to

179

compute the total β -diversity among the patches of a landscape (Legendre and De C´aceres, 2013).

180

Statistical analyses

181

All statistical analyses were conducted in R (version 4.0.2). To test the relative effects of spa-

182

tial clumping and rate of local extinctions on metacommunitiy properties, we studied 4 metrics

183

(biomass, α-diversity, β -diversity and biomass recovery time) using mixed-effects models with

184

measure point and landscape ID (for patch level metrics) as random effects to account for the non-

185

independence of measures taken the same day and measures taken within one landscape. Fixed

186

effects were clumping of the extinctions, extinction rate as well as their interaction. Response vari-

187

ables were normalized using the R-package bestNormalize (version 1.6.1). The biomass in each

188

patch was estimated using the bioarea per volume, a measure of the total surface of organisms

189

visible in a video divided by the volume of medium in the camera field. The biomass recovery

190

from extinction was estimated as the time needed to reach a bioarea per volume higher that the

191

2.5% quantile of pre-extinction bioarea in a given patch. This time span is hereafter referred to as

192

recovery time.

193

For each statistical model, we performed AICc-based model selection on all models from the

194

intercept to the full model. We used the weighted average of the model selection for predictions

195

and quantified the relative importance of each predictor variables to assess their importance on the

196

(11)

Metacommunity model

198

We developed a mathematical model describing the dynamics of a competitive metacommunity of

199

n

species characterized by demographic and interaction parameters in landscapes similar to those

200

used experimentally (i.e., a square lattice of 4 by 4 patches). We used Bayesian inference of de-

201

mographic parameters on times series from the experimental single-patch cultures to parameterize

202

the model (see below for details). We simulated dynamics using the same extinction plans as in

203

the microcosm experiments with 100 replicates of each treatment.

204

Metacommunity dynamics

205

We used a set of ordinary differential equations to describe the dynamics of metacommunities

206

(Eq. 1), where the terms describe the local dynamics ( f ), the emigration (g) and the immigration

207

(h) of species i in patch k, with N

i,k

as the density of species i in patch k.

208

dN

i,k

dt

= f (N

•,k

) − g(N

i,k

) + h(N

i,•

)

(1)

The local dynamics are described by a competitive Lotka-Volterra equation (Eq. 2) were N

i,k

209

grows logistically (r

i

: growth rate, α

i,i

: intraspecific competition) and is down-regulated by inter-

210

specific competition (α

i, j

).

211

f

(N

•,k

) = r

i

N

i,k

n

j=1

α

i, j

N

i,k

N

j,k

(2)

The number of individuals emigrating from a patch k is defined by a constant dispersal rate m

i

212

(Eq. 3).

213

g(N

i,k

) = m

i

N

i,k

(3)

(12)

h(N

i,•

) =

l

m

i

N

i,l

n links

l

(4)

where l are the patches adjacent to k and n links

l

is the number of connections leaving the

215

patch l.

216

Parameterization of the model

217

We used four different sets of parameters (hereafter referred to as “scenarios of species interac-

218

tions”) to investigate which processes may be responsible for the patterns observed experimentally.

219

Two scenarios of species interactions (“empirical interactions” and “competition-colonization trade-

220

off”) used demographic parameters (population growth rates r

i

and competitive abilities α

i, j

) fitted

221

from empirical time series and were expected to most closely reproduce the experimental data.

222

One scenario (“randomized interactions”) used the same competitive abilities but randomly shuf-

223

fled between species in order to investigate whether the results were specific to our experimental

224

community or if they could arise in other competitive communities with a different structure but

225

similar overall interactions strength. The last scenario (“no interspecific interactions”) ignored

226

interspecific interactions altogether and was thought of as a control scenario.

227

Empirical interactions

We parameterized the model using single-patch time series of mono-, bi-

228

(cultures of Blepharisma sp. with T. thermophila) and of Blepharisma sp. with Colpidium sp.) and

229

tri-specific cultures from the experiments (three replicates of each culture). We fitted competitive

230

Lotka-Volterra equations to the data using Bayesian inference (R-package Rstan version 2.19.3)

231

(Rosenbaum et al., 2019; Feng et al., 2020). We fitted a single set of parameters (three r

i

and a

232

3 by 3 matrix of al pha

i, j

) over all replicates of all single-patch cultures (one curve per culture,

233

with different initial conditions N

0

for each culture), using lowly informative priors (Tab. S1)

234

and assuming a negative binomial distribution of the residuals. We fit the model using the No

235

U-Turn Sampler (NUTS) with three chains each of total length 10 000 (of which 2 000 steps

236

were discarded as warm-up). We used default parameters for the sampler, except for the control

237

(13)

parameters ”adapt delta” (set at 0.9) and ”max treedepth” (set at 12). The average fit can be found

238

for visual inspection in Fig. S7.

239

This allowed us to infer values of population growth rates (r

i

) and interaction strengths (α

i, j

) for

240

which the model yields dynamics that are quantitatively similar to the dynamics of the experimental

241

community. We used the same dispersal rates for all three species (m

i

= 1/100).

242

Competition-colonization trade-off

We used the fitted values from the experimental results for

243

the Lotka-Volterra parameters (r

i

, α

i, j

) and used different dispersal rates for each species (m

i

=

244

{1/50, 1/100, 1/500}) with the most (resp. least) competitive species having the lowest (resp.

245

highest) dispersal rate, resulting in a trade-off between competition and colonization.

246

Randomized interactions

We used the same parameters as in the “empirical interactions” sce-

247

nario but we randomized interspecific interactions (i.e., the off-diagonal terms of the competition

248

matrix: α

i, j

, i 6= j). We randomly changed the position of the interaction terms while keeping each

249

α

i, j

associated to the same α

j,i

.

250

No interspecific interactions

We used the same parameters as in the “empirical interactions”

251

scenario but we set the interspecific interaction terms (α

i, j

, i 6= j) to be zero. This results in a

252

community where species do not experience interspecific competition.

253

Results

254

The role of the spatial distribution of extinctions

255

In the experiments, both local and regional effects of local patch extinctions were mainly deter-

256

mined by the clumping of extinctions or by the interaction between clumping and rate of extinc-

257

tions, while the extinction rate alone only had a marginal effect on the outcome of the experiment

258

as indicated by model selection (Fig. 1; Tab. 1 and S2). For the local variables studied (α-diversity,

259

bioarea and bioarea recovery time), the clumping of extinctions was found to be more important

260

(14)

1.0

1.5

2.0

2.5

4

8

Extinctions

α

-div

er

sity (Sim

pson's inde

x)

a

0.20

0.25

0.30

0.35

4

8

Extinctions

β

-div

er

sity

b

4

6

8

10

4

8

Extinctions

Bioar

ea per v

olume (log(

μ

m

2

/m

L))

c

50

100

150

200

250

4

8

Extinctions

R

eco

ver

y time (h)

d

Treatment

Clumped extinctions

Dispersed extinctions

Figure 1: Observed response variables in the experiments (dots) and averaged mixed model

pre-dictions (medians and 95% confidence intervals; Tab. 1 and S2) from the extinction events to

the end of the experiments. (a) α-diversity (measured as Simpson’s index) in extinct patches, (b)

β -diversity in landscapes with extinction, (c) Bioarea in extinct patches and (d) biomass recovery

time in extinct patches.

than the extinction rate (Tab. 1). Both α-diversity in non-extinct patches (Tab. 2 and S3b) and

261

β -diversity (Tab. 1 and Tab. S2b) were mostly explained by the interaction between clumping and

262

extinction rate (statistical models without the interactions had either a null (for β -diversity) or low

263

(for α-diversity) weight).

264

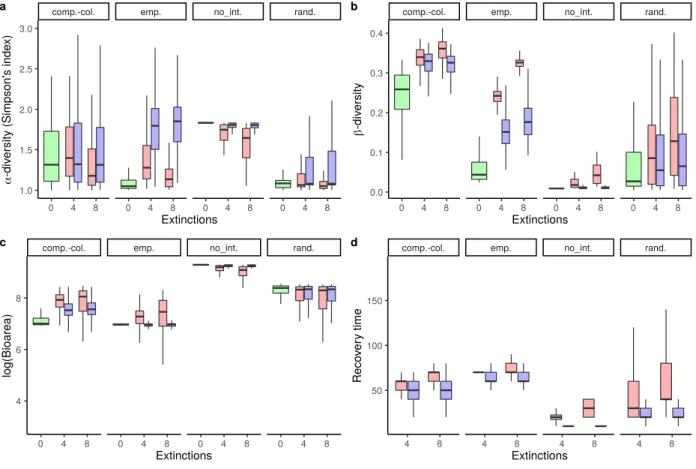
Numerical simulations of our metacommunity model with the same spatial configuration and

265

extinctions patterns reproduced these results for all competition scenarios (Fig. 2 and 4).

266

Direct effects — recolonization dynamics in extinct patches

267

(15)

comp.-col.

emp.

no_int.

rand.

0

4

8

0

4

8

0

4

8

0

4

8

1.0

1.5

2.0

2.5

3.0

Extinctions

α

-div

er

sity (Sim

pson's inde

x)

a

comp.-col.

emp.

no_int.

rand.

0

4

8

0

4

8

0

4

8

0

4

8

0.0

0.1

0.2

0.3

0.4

Extinctions

β

-div

er

sity

b

comp.-col.

emp.

no_int.

rand.

0

4

8

0

4

8

0

4

8

0

4

8

4

6

8

Extinctions

log(Bioar

ea)

c

comp.-col.

emp.

no_int.

rand.

4

8

4

8

4

8

4

8

50

100

150

Extinctions

R

eco

ver

y time

d

Treatment

Clumped extinctions

Dispersed extinctions

No extinction

Figure 2: Observed response variables in numerical simulations of the metacommunity model

dis-playing different metrics after the extinction events. (a) α-diversity (measured as Simpson’s index)

in extinct patches, (b) β -diversity in landscapes with extinction, (c) biomass in extinct patches and

(d) biomass recovery time in extinct patches. The top labels denote the scenarios of species

interac-tions: “emp.” for “empirical interactions”, “comp.-col.” for “competition-colonization trade-off”,

“rand.” for “randomized interactions” and “no int.” for “no interspecific interactions”.

(16)

Biomass

269

The bioarea per volume, as proxi for biomass in a given patch, after local patch extinctions was

270

slightly higher in extinct patches from landscapes with dispersed extinctions than in landscapes

271

with clumped extinctions (Fig. 1c, median predictions : ∼ 6000 µm

2

mL

−1

vs. ∼ 5000 µm

2

mL

−1

).

272

Note that this effect is weak as indicated by model selection which ranks the intercept model

273

second with an AICc weight of 0.27 (Tab. S2). The recovery time needed to reach a bioarea higher

274

than the 2.5% quantile of the pre-extinction bioarea was shorter in case of dispersed extinctions

275

compared to clumped extinctions, and it slightly increased with the number of extinctions (Tab. S2

276

and Fig. 1d; median mixed model predictions: 4 dispersed: 122 h, 8 dispersed: 130 h, 4 clumped:

277

139 h, 8 clumped: 134 h).

278

In simulations of the metacommunity model, recovery times (Fig. 2d) depended greatly on the

279

scenario of species interactions: it was shorter in the absence of interspecific interactions (scenario:

280

“no interspecific interactions”) and with randomized interactions (“randomized interactions”), and

281

longer for fitted interaction terms (“empirical interactions” and “competition-colonization trade-

282

off”). However, the differences between treatments were qualitatively similar between all interac-

283

tion scenarios: the recovery times were shorter for dispersed extinctions than for clumped extinc-

284

tions. In landscapes with dispersed extinctions, the recovery times were not affected by the number

285

of extinctions. By contrast, in landscapes with clumped extinctions, the recovery times increased

286

with the number of extinctions. It is noteworthy that, in general, the recovery times were much

287

shorter (less than 100 time units) than what we found experimentally, probably because dispersal in

288

the experiments happened over discrete time interval (4 h periods, three times per week) resulting

289

in a lag in recolonization dynamics.

290

α -diversity

291

In patches from control landscapes (i.e., landscapes without any patch extinctions), α-diversity

292

increased at first as species dispersed between patches but quickly fell to 1 (the minimal value)

293

as Blepharisma sp. finally excluded the two other species and dominated the community. In

294

(17)

Table 1: Relative importance of explanatory parameters in the mixed models explaining all four

response variables (α-diversity, β -diversity, bioarea per volume and recovery time) in extinct

patches.

α -diversity

β -diversity

Bioarea

Recovery time

Spatial clumping

0.95

1

0.62

0.67

Extinction rate

0.43

1

0.37

0.52

Spatial clumping * Extinction rate

0.11

1

0.1

0.23

extinct patches of the landscapes with extinction treatments, α-diversity was higher during the

295

recolonization process in comparison to the control landscapes since all three species were present

296

in more even densities (Fig. 1a). This effect was stronger for dispersed extinctions than for clumped

297

extinctions (Fig. 1a, Tab. 1).

298

In simulations from the metacommunity model, α-diversity patterns depended on the scenario

299

of species interactions (Fig. 2a). In the absence of interspecific interactions (“no interspecific in-

300

teractions”), the three species could coexist locally and the α-diversity stayed high in patches from

301

control landscapes. In extinct patches, the α-diversity was 1 right after extinction but quickly

302

came back to pre-extinction levels as all species recolonized (Fig. S8). This recovery was faster

303

for dispersed than for clumped extinctions and in landscapes with 4 rather than 8 extinctions. In

304

all three other scenarios (“empirical interactions”, “randomized interactions” and “competition-

305

colonization trade-off”), interspecific interactions resulted in competitive exclusion. As a conse-

306

quence, α-diversity was fairly low in control landscapes (Fig. 2a). In the extinct patches of the

307

landscapes with extinction treatments, α-diversity during the recolonisation process was higher

308

(for all treatments) than in the patches from control landscapes. α-diversity was highly variable

309

in time during the recolonization process (Fig. S8). In all scenarios, α-diversity in patches from

310

dispersed extinction treatments was higher early in the recolonization process but then decreased

311

quickly. Later in the recolonisation process, α-diversity was higher in patches from clumped ex-

312

(18)

Table 2: Relative importance of explanatory parameters in the mixed models explaining bioarea

and α-diversity in non-extinct patches.

Bioarea

α -diversity

Spatial clumping

0.32

1

Extinction rate

0.38

0.86

Spatial clumping * Extinction rate

0.15

0.81

Indirect effects — spread of extinctions effects to non-extinct patches and at

314

the regional scale

315

As local events can spread in space and have regional consequences, we now focus on the indirect

316

effects of local patch extinctions on undisturbed patches (biomass and α-diversity) and on regional

317

effects (β -diversity).

318

Biomass

319

We observed no strong difference in bioarea per volume between treatments (Fig. 3b). Although

320

the bioarea predictions from the mixed model are slightly higher in non-extinct patches than in

321

patches from control landscapes, both empirical data and the statistical models predictions are

322

largely overlapping between treatments.

323

α -diversity

324

Experimentally, α-diversity was higher in non-extinct patches than in patches from control land-

325

scapes, particularly for dispersed extinctions (Fig. 3a). Most of the variation between treatments

326

was explained by the spatial clumping of extinctions rather than extinction rates (Tab. 2 and

327

Tab. S3b). Interestingly, the effect of extinction rates depended on the spatial organization of

328

extinctions: under clumped extinctions, the α-diversity in non-extinct patches decreased with the

329

number of extinctions but it increased under dispersed extinctions (Fig. 3a).

330

The results from the simulations of the metacommunity model depended on the scenarios of

331

species interactions (Fig. 4a): in the absence of interspecific competition (“no interspecific in-

332

teractions”), α-diversity levels were similar in non-extinct patches (across all treatments) and

333

(19)

1.00

1.25

1.50

1.75

2.00

0

4

8

Extinctions

α

-div

er

sity (Sim

pson's inde

x)

a

7

8

9

0

4

8

Extinctions

Bioar

ea per v

olume (log(

μ

m

2

/m

L))

b

Treatment

Clumped extinctions

Dispersed extinctions

No extinctions

Figure 3: Observed response variables in the experiments (dots) and averaged mixed model

pre-dictions (medians and 95% confidence intervals; Tab. 2 and S3) in non-extinct patches adjacent

to at least one extinct patch (blue, red) and in control landscapes (green). (a) α-diversity

(mea-sured as Simpson’s index) in non-extinct patches at the last two measurement points, (b) bioarea

in non-extinct patches (for the two measurement points following the extinctions).

(20)

patches from control landscapes. In every other scenario (“empirical interactions”, “random-

334

ized interactions” and “competition-colonization trade-off”), α-diversity was higher in non-extinct

335

patches than in patches from control landscapes. In line with experimental results, α-diversity was

336

higher for treatments with dispersed extinctions. α-diversity also increased with the number of

337

extinctions. Although these results were qualitatively similar across the scenarios that included

338

interspecific competition (“randomized interactions”, “empirical interactions” and “competition-

339

colonization trade-off”), the effect sizes were highly variable: randomized interactions yielded

340

smaller effects while the “competition-colonization trade-off” scenario yielded stronger effects,

341

more consistent with experimental results.

342

β -diversity

343

In control landscapes, β -diversity was fairly low because the patches ended up being homogeneous

344

(not shown). β -diversity was higher in landscapes with extinctions than in control landscapes be-

345

cause of differences in species composition and density between extinct and non-extinct patches.

346

This effect was stronger for 8 extinctions than for 4 extinctions, particularly for clumped extinc-

347

tions (Fig. 1b).

348

In simulations of the metacommunity model, these results held qualitatively for all competition

349

scenarios (Fig. 2b): β -diversity was higher in landscapes with extinctions than in control land-

350

scapes. Among landscapes with extinctions, β -diversity generally increased with spatial clumping

351

and extinction rate. These effects were strong and on par with experimental effect sizes for realistic

352

interaction matrices (scenarios “empirical interactions” and “competition-colonization trade-off”).

353

They were weaker for randomized interaction matrices (“randomized interactions” scenario) and

354

negligible in the absence of interspecific interactions (“no interspecific interactions” scenario).

355

(21)

comp.-col.

emp.

no_int.

rand.

0

4

8

0

4

8

0

4

8

0

4

8

1.0

1.5

2.0

2.5

3.0

Extinctions

α

-div

er

sity (Sim

pson's inde

x)

a

comp.-col.

emp.

no_int.

rand.

0

4

8

0

4

8

0

4

8

0

4

8

7.0

7.5

8.0

8.5

9.0

Extinctions

log(Bioar

ea)

b

Treatment

Clumped extinctions

Dispersed extinctions

No extinction

Figure 4: Observed response variables in numerical simulations of the metacommunity model

showing Simpson’s index (a) and biomass (b) in non-extinct patches adjacent to at least one

ex-tinct patches (blue, red) and in control landscapes (green) after exex-tinction events. The top labels

denote the scenarios of species interactions: “emp.” for “empirical interactions”, “comp.-col.” for

“competition-colonization trade-off”, “rand.” for “randomized interactions” and “no int.” for “no

interspecific interactions”.

(22)

Discussion

356

The role of the spatial distribution of the extinctions

357

Our work clearly shows that recovery from extinctions depends more on the spatial features of

358

local patch extinctions (such as the connectivity between extinct and non-extinct patches) than on

359

interspecific interactions or on the number of patches affected. More specifically, our experiments

360

clearly showed that the spatial clumping of extinctions had stronger effects than extinction rates per

361

se on all metacommunity metrics measured, including biomass, recovery time, α- and β -diversity

362

(Tab. 1 and S2). These empirical findings were confirmed by our theoretical model, regardless

363

of the specific scenario. The main factor driving these results can be linked to the connectivity of

364

extinct to non-extinct patches: in the dispersed extinction treatments, extinct patches were adjacent

365

to more non-extinct patches (on average 3) than in the clumped extinction treatments (on average 1

366

(4 clumped extinctions) and 0.5 (8 clumped extinctions)), which modulated recovery speed. These

367

results can be inerpreted as differences in recovery regimes across spatial treatments: clumped

368

extinctions, characterized by a weak connectivity between extinct and non-extinct patches, result

369

in what Zelnik et al. (2019) described as a “rescue recovery regime”, while dispersed extinctions,

370

characterized by a strong connectivity between extinct and non-extinct patches, result in a “mixing

371

recovery regime”. Under the “rescue” regime, dispersal between extinct and non-extinct patches is

372

marginal compared to local dynamics. Extinct and non-extinct patches are strongly differentiated,

373

and the recovery dynamics mainly rely on local growth. Under the “mixing” regime, dispersal

374

between extinct and non-extinct patches is on par with local dynamics. Extinct and non-extinct

375

patches are well mixed, and both local growth and dispersal from extinct patches participate sub-

376

(23)

Direct effects of extinctions

378

Biomass recovery

379

Experimental data and simulations support the conclusion that simultaneously increasing the rate

380

and clumping of extinctions increases the time needed for a metacommunity to recover its pre-

381

extinction biomass (Fig. 1d and 2d). Experimentally, increasing only the rate of extinctions or

382

transitioning from dispersed to clumped extinctions had no effect on the recovery time (Fig. 1d).

383

In simulations of the metacommunity model, recovery time always increased with spatial clumping

384

(Fig. 2d). Extinction rate had no effect on recovery time under dispersed extinctions treatments,

385

but it increased the recovery time under clumped extinctions. These results were surprisingly

386

consistent for the different scenarios of species interactions, highlighting that this pattern does

387

not depend on species interactions but rather on the geometry of the patches to be recolonized.

388

A high rate of spatially clumped extinctions increases the recovery time by creating large areas of

389

extinct patches, thus increasing the average distance and reducing the average connectivity between

390

extinct and non extinct patches. As above, this can be discussed from a recovery regime perspective

391

(Zelnik et al., 2019): dispersed extinctions result in a “mixing recovery regime” where extinct and

392

non extinct patches are well mixed and dispersal, in combination with local population growth,

393

qualitatively participates to biomass recovery. Clumped extinctions result in a “rescue recovery

394

regime” where biomass recovery relies mainly on local population growth and is thus slower.

395

Additionally, both experimentally and in model simulations, extinct patches had a slightly

396

higher biomass after recovery than patches from unperturbed landscapes (not shown). This is be-

397

cause unperturbed patches only had the better competitor left (Blepharisma sp.), while all three

398

species persisted in extinct patches. Since poorly competitive species (Colpidium sp. and T.

399

thermophila) reached a higher biomass than Blepharisma sp., unperturbed patches had a lower

400

biomass. This result should hold for communities dominated by highly competitive but slowly

401

reproducing species that do not reach high densities (e.g., if there is a trade-off between population

402

growth rate and competitive ability rather than the often assumed trade-off between population

403

(24)

growth rate and carrying capacity; for a discussion, see Mallet 2012) or when populations are able

404

to overshoot their equilibrium density. This should however not be the case for communities where

405

the dominant species happens to reach higher equilibrium densities, as it is the case in forests, for

406

instance, where transiently recolonising species (e.g., grasses or shrubs) do not accumulate biomass

407

and are slowly replaced by dominant species that do (trees).

408

α -diversity

409

Local patch extinctions generally increased α-diversity: experimentally, unperturbed patches reached

410

a state where Blepharisma sp. was largely dominant, sometimes to the point where T. thermophila

411

and Colpidium sp. were locally excluded. In control landscapes, this resulted in the extinction of

412

T. thermophila

at the landscape scale. As a result, α-diversity was low in control landscapes and

413

in non-extinct patches (Fig. 3a). In extinct patches, all three species persisted during the recolo-

414

nization process, resulting in higher α-diversity (Fig. 1a) compared to non-extinct patches from

415

the same landscapes or from control landscapes (Fig. 3a). This result was also observed in all

416

simulations of the metacommunity model, except in the absence of interspecific competition (“no

417

interspecific interactions” scenario) since no competitive exclusion occurs in that case (Fig. 2a).

418

The persistence of less competitive species in extinct patches during the recolonisation process

419

can be explained both by the decrease in population density and by a competition-colonization

420

trade-off across the three species: the low population density after extinction events decreases

421

the intensity of competition, while the competition-colonization trade-off delays the recoloniza-

422

tion by Blepharisma sp., both processes resulting in the delay of competitive exclusion. Since the

423

increased α-diversity was observed in simulations without a competition-colonization trade-off

424

(i.e., scenarios “randomized interactions” and “empirical interactions”; Fig. 2a), such a trade-off

425

is not necessary for local extinctions to increase α-diversity, even though the trade-off increased

426

α -diversity even more. These results are similar to effect described in the intermediate disturbance

427

hypothesis which predicts that some degree of perturbation should result in a higher local and

428

regional biodiversity by reducing the abundance of competitively dominant species and allowing

429

(25)

the persistence of early succesional species (Wilkinson, 1999; Shea et al., 2004). However, pre-

430

vious experiments on similar systems found that local patch extinctions decreased local diversity

431

(Cadotte, 2007). This can be explained by differences in metacommunity composition: meta-

432

communities skewed towards early-succesional species should exhibit the α-diversity increase ob-

433

served here, while metacommunities skewed towards late-succesional species (as in Cadotte 2007)

434

should see α-diversity decrease with local patch extinctions.

435

Clearly, these effects may be relevant in the context of ecosystem management: while local

436

perturbations (here in their most extreme form, the extinction of all species) decrease biomass,

437

they can also allow the persistence of species that would otherwise be excluded and lead to an

438

increased local diversity.

439

Indirect effects

440

Besides the direct effects discussed above, local patch extinctions may also have indirect effects at

441

the regional scale by altering species densities and composition in non-extinct patches (Gilarranz

442

et al., 2017; Zelnik et al., 2019).

443

Biomass

444

Biomass in non-extinct patches was mainly unaffected by local patch extinctions. Experimentally,

445

the biomass in non-extinct patches was fairly similar to the biomass in patches from control land-

446

scapes (Fig. 3b). This was also the case in simulations: biomass distributions largely overlapped

447

between treatments (Fig. 4b). Despite reduced fluxes from extinct patches, the density in non-

448

extinct patches did not decrease. This can be explained by local dynamics (population growth)

449

being faster than spatial dynamics (dispersal). In this case, the adverse effect of local extinctions

450

(decreased biomass) does not spread to non-extinct patches. However, in metacommunities with

451

strong dispersal, non-extinct patches should also experience reduced biomass. While we did not

452

observe a decrease of biomass in non-extinct patches, probably because local dynamics were too

453

fast for spatial dynamics to have an effect on these patches, previous theoretical work predicts that

454

(26)

a local biomass reduction could spread in space if dispersal rates were high enough (Zelnik et al.,

455

2019).

456

α -diversity

457

Experimentally, non-extinct patches in landscapes with extinctions were not dominated by Ble-

458

pharisma

sp. This is because dispersal of T. thermophila and Colpidium sp. from extinct patches,

459

where they were present in high density during the recolonization process, allowed these species

460

to persist in non-extinct patches. Their persistence increased α-diversity in non-extinct patches

461

compared to patches from control landscapes that were mainly monospecific (Fig. 3a). The in-

462

crease of α-diversity was stronger in non-extinct patches from dispersed extinction treatments, as

463

these patches were connected to more extinct patches and thus received an increased amount of

464

less competitive dispersers than non-extinct patches from clumped extinction treatments.

465

The increase of α-diversity following extinctions did not occur in the metacommunity model in

466

the absence of interspecific competition (Fig. 4a; scenario “no interspecific interactions”), because

467

competitive exclusion did not occur and therefore all three species were present in all patches.

468

However, the patterns observed experimentally were recovered in all simulations that incorporated

469

interspecific competition (Fig. 4a; scenarios “randomized interactions”, “empirical interactions”

470

and “competition-colonization trade-off”), showing that local diversity maintenance by local ex-

471

tinctions is not restricted to our particular experimental community but can occur as long a some

472

species excludes others.

473

β -diversity

474

Both in experiments and theoretically, β -diversity was higher in landscapes that experienced lo-

475

cal patch extinctions in comparison to control landscapes (Fig. 1b and 2b). More precisely, this

476

result holds in theory as long as interspecific competition is included (Fig. 2b, scenarios “ran-

477

domized interactions”, “empirical interactions” and “competition-colonization trade-off”). In the

478

simulations without interspecific competition (Fig. 2b; scenario “no interspecific interactions”),

479

(27)

β -diversity increased only marginally because all three species quickly recolonized the patches in

480

the same proportion as in non-extinct patches. The increase in β -diversity following local patch

481

extinctions (in experiments and in simulations with interspecific competition) can be explained

482

by the fact that extinct patches had a different species composition than non-extinct patches. In

483

non-extinct patches communities were mainly composed of Blepharisma sp., while extinct patches

484

allowed for less competitive species to persist during the recolonization process. While we find a

485

strictly increasing relationship between extinctions rate and β -diversity (Fig. 1b and 2b), Cadotte

486

(2007) found a unimodal relationship between β -diversity and local patch extinction rates. While

487

this seems contradictory, it is also possible that we did not cover enough extinction rate values to

488

uncover a unimodal relationship, as β -diversity could decrease at higher extinction rates.

489

By crossing the extinction rates and spatial clumping treatments, we were able to show that

490

the relationship between β -diversity and local patch extinctions rates is strongly dependant on the

491

spatial distribution of extinctions: the increase in β -diversity was higher when extinctions were

492

clumped than when they were dispersed in space. When extinctions were clumped, the connectivity

493

between extinct and non extinct patches was fairly low, resulting in a strong differentiation between

494

extinct and non-extinct patches. When extinctions were dispersed, extinct and non-extinct patches

495

were well connected, resulting in a stronger mixing of communities between patches and a lower

496

β -diversity.

497

Perspectives

498

Clearly, we have used a number of simplifying assumptions in our metacommunity model as well

499

as in the experimental work that could provide some interesting directions for future research.

500

Firstly, we consider only competitive interactions between species while natural communities con-

501

sist of more diversified interactions, including predation, mutualism and parasitism, for example

502

(K´efi et al., 2012, 2015). These interactions could complicate the response (K´efi et al., 2016)

503

and affect the consequences of extinctions on ecological communities. Moreover, the sensitivity of

504

species to local extinctions could depend on their trophic level, as demonstrated for habitat destruc-

505

(28)

tion (Liao et al., 2017; Ryser et al., 2019): top predators (or parasites) could be more vulnerable

506

as they suffer both from the perturbation and from the reduction of their prey (or host) density.

507

Specialized predators and parasites may also take longer to recolonize since they cannot return to

508

perturbed patches while their prey (or host) is not present at a high enough density. Vice versa,

509

other species could benefit from local extinctions through decreased predator or parasite pressures.

510

Secondly, we ignore evolutionary processes although natural populations can readily adapt to en-

511

vironmental change. Increased local patch extinction rates should select for higher dispersal rates

512

(Bowler and Benton, 2005; Ronce, 2007), but increased spatial clumping of extinctions could se-

513

lect for lower dispersal rates and longer dispersal distances (Fronhofer et al., 2014), which could

514

result in opposite selective pressures if both increase at the same time. This could have implica-

515

tions for the dynamics of biodiversity because dispersal can mediate species coexistence (Hanski,

516

1983), diversity patterns (Laroche et al., 2016) and speciation (Pellissier, 2015). In particular,

517

increased dispersal could synchronize metacommunities, making them more prone to global ex-

518

tinctions. Metacommunity synchrony could also be increased by the increasing spatial synchrony

519

of climatic events (Di Cecco and Gouhier, 2018), as observed in the metapopulation of Melitaea

520

cinxia

(Kahilainen et al., 2018). On the other hand, evolutionary rescue could buffer the effects of

521

disturbances, allowing metacommunities to persist in increasingly harsher environments (Bell and

522

Gonzalez, 2011).

523

Conclusion

524

Overall, our study shows that the effects of local patch extinctions in metacommunities strongly

525

depend on the spatial distributions of extinctions. Local patch extinctions can increase both α-

526

diversity and β -diversity by allowing weak competitors to persist in the metacommunity and by

527

forcing a differentiation between extinct and non-extinct patches.

528

Dispersal and connectivity between patches are central to recovery as they allow the recolo-

529

nization of extinct patches but also a mixing between extinct and non-extinct patches, which can

530

(29)

result in the spread of local extinction effects to unperturbed patches. In our setting, this spread

531

was characterised by an increase in α-diversity in unperturbed patches through dispersal from

532

species-rich, previously extinct patches to species poor, previously non-extinct patches.

533

By determining the connectivity between extinct and non-extinct patches, the spatial clumping

534

of extinctions modulates the dynamics after the extinction events: when extinctions are clumped,

535

extinct and non extinct patches are weakly connected. This results in a slower biomass recovery,

536

a weak spread of α-diversity and a high β -diversity as extinct and non-extinct patches are dif-

537

ferentiated. On the contrary, dispersed extinctions imply higher connectivity between extinct and

538

non-extinct patches which translates into a faster biomass recovery, a stronger spread of α-diversity

539

and a lower β -diversity as extinct and non-extinct patches are better mixed.

540

Our highly controlled experiment in combination with the theoretical model provide a proof-

541

of-concept for the importance of taking into account the spatial distribution of disturbances in

542

biodiversity research. Of course, applying our findings to specific, real-world ecosystems will

543

require a combination of field data and system-specific models to better estimate the effects of

544

local extinctions in more realistic settings. Nevertheless, our work highlights the importance of the

545

(30)

References

547

Abbott, K. C. 2011. A dispersal-induced paradox: synchrony and stability in stochastic metapop-

548

ulations. Ecology letters, 14:1158–1169.

549

Allen, C. D., A. K. Macalady, H. Chenchouni, D. Bachelet, N. McDowell, M. Vennetier,

550

T. Kitzberger, A. Rigling, D. D. Breshears, E. T. Hogg, et al. 2010. A global overview of

551

drought and heat-induced tree mortality reveals emerging climate change risks for forests. For-

552

est ecology and management, 259:660–684.

553

Altermatt, F. and D. Ebert. 2010. Populations in small, ephemeral habitat patches may drive

554

dynamics in a daphnia magna metapopulation. Ecology, 91:2975–2982.

555

Altermatt, F., E. A. Fronhofer, A. Garnier, A. Giometto, F. Hammes, J. Klecka, D. Legrand,

556

E. M¨achler, T. M. Massie, F. Pennekamp, et al. 2015. Big answers from small worlds: a user’s

557

guide for protist microcosms as a model system in ecology and evolution. Methods in Ecology

558

and Evolution, 6:218–231.

559

Bell, G. and A. Gonzalez. 2011. Adaptation and evolutionary rescue in metapopulations experi-

560

encing environmental deterioration. Science, 332:1327–1330.

561

Bender, E. A., T. J. Case, and M. E. Gilpin. 1984. Perturbation experiments in community ecology:

562

theory and practice. Ecology, 65:1–13.

563

Bowler, D. E. and T. G. Benton. 2005. Causes and consequences of animal dispersal strategies:

564

relating individual behaviour to spatial dynamics. Biological Reviews, 80:205–225.

565

Brown, J. H. and A. Kodric-Brown. 1977. Turnover rates in insular biogeography: effect of immi-

566

gration on extinction. Ecology, 58:445–449.

567

Cadotte, M. W. 2006. Metacommunity influences on community richness at multiple spatial scales:

568

(31)

Cadotte, M. W. 2007. Competition–colonization trade-offs and disturbance effects at multiple

570

scales. Ecology, 88:823–829.

571

Carpenter, K. E., M. Abrar, G. Aeby, R. B. Aronson, S. Banks, A. Bruckner, A. Chiriboga,

572

J. Cort´es, J. C. Delbeek, L. DeVantier, et al. 2008. One-third of reef-building corals face el-

573

evated extinction risk from climate change and local impacts. Science, 321:560–563.

574

Di Cecco, G. J. and T. C. Gouhier. 2018. Increased spatial and temporal autocorrelation of tem-

575

perature under climate change. Scientific reports, 8:1–9.

576

Diehl, S. and M. Feissel. 2001. Intraguild prey suffer from enrichment of their resources: a micro-

577

cosm experiment with ciliates. Ecology, 82:2977–2983.

578

Feng, Y., S. Soliveres, E. Allan, B. Rosenbaum, C. Wagg, A. Tabi, E. De Luca, N. Eisenhauer,

579

B. Schmid, A. Weigelt, et al. 2020. Inferring competitive outcomes, ranks and intransitivity

580

from empirical data: A comparison of different methods. Methods in Ecology and Evolution,

581

11:117–128.

582

Fronhofer, E. A. and F. Altermatt. 2015. Eco-evolutionary feedbacks during experimental range

583

expansions. Nature communications, 6:6844.

584

Fronhofer, E. A., A. Kubisch, F. M. Hilker, T. Hovestadt, and H. J. Poethke. 2012. Why are

585

metapopulations so rare? Ecology, 93:1967–1978.

586

Fronhofer, E. A., J. M. Stelz, E. Lutz, H. J. Poethke, and D. Bonte. 2014. Spatially correlated

587

extinctions select for less emigration but larger dispersal distances in the spider mite tetranychus

588

urticae. Evolution, 68:1838–1844.

589

Gilarranz, L. J., B. Rayfield, G. Li˜n´an-Cembrano, J. Bascompte, and A. Gonzalez. 2017. Effects

590

of network modularity on the spread of perturbation impact in experimental metapopulations.

591

Science, 357:199–201.

592

Figure

Figure 1: Observed response variables in the experiments (dots) and averaged mixed model pre- pre-dictions (medians and 95% confidence intervals; Tab
Figure 2: Observed response variables in numerical simulations of the metacommunity model dis- dis-playing different metrics after the extinction events
Table 1: Relative importance of explanatory parameters in the mixed models explaining all four response variables (α -diversity, β -diversity, bioarea per volume and recovery time) in extinct patches.
Figure 3: Observed response variables in the experiments (dots) and averaged mixed model pre- pre-dictions (medians and 95% confidence intervals; Tab
+7

Références

Documents relatifs

The reduction in the upper limit of pH for SCC with reduced carbonate concentration was at first thought to be a crack chemistry effect (2).. Now we recognize that this is

species pollinating specialist plants may cause a high mean expected PD loss per lost

Our spatial patch blending technique uses all the patches from which a point p ∈ Ω could have been reconstructed during the inpainting process if the filling order had been

Experiments conducted on several standard natural images illustrate the effectiveness of our method when compared to some other state-of-the-art denoising methods like classical

This experiment deter- mined (1) how the local and neighboring densities of conspecifics affect the movement rates of individuals; (2) how the local and neighboring sex ratios

On pourrait donc s’attendre à ce que les espèces rares, dont les populations sont en général de petite taille, évoluent vers un régime de reproduction autogame.. Or de

Lately, there is an increasing interest on the use of goal-oriented error estimates which help to measure and control the local error on a linear or

Patch construction is a key task in software development. In par- ticular, it is central to the repair process when developers must engineer change operations for fixing the buggy