HAL Id: hal-02997511
https://hal.archives-ouvertes.fr/hal-02997511
Submitted on 19 Nov 2020HAL is a multi-disciplinary open access archive for the deposit and dissemination of sci-entific research documents, whether they are pub-lished or not. The documents may come from teaching and research institutions in France or abroad, or from public or private research centers.
L’archive ouverte pluridisciplinaire HAL, est destinée au dépôt et à la diffusion de documents scientifiques de niveau recherche, publiés ou non, émanant des établissements d’enseignement et de recherche français ou étrangers, des laboratoires publics ou privés.
Moira Dillon, Marianne Duyck, Stanislas Dehaene, Marie Amalric, Véronique
Izard
To cite this version:
Moira Dillon, Marianne Duyck, Stanislas Dehaene, Marie Amalric, Véronique Izard. Geometric cate-gories in cognition. Journal of Experimental Psychology: Human Perception and Performance, Amer-ican Psychological Association, 2019, 45 (9), pp.1236-1247. �10.1037/xhp0000663�. �hal-02997511�
Perception and Performance
Manuscript version of
Geometric Categories in Cognition
Moira R. Dillon, Marianne Duyck, Stanislas Dehaene, Marie Amalric, Véronique Izard
Funded by:
• European Research Council • National Science Foundation
• Norman Henry Anderson Graduate Psychology Fund
© 2019, American Psychological Association. This manuscript is not the copy of record and may not exactly replicate the final, authoritative version of the article. Please do not copy or cite without authors’ permission. The final version of record is available via its DOI: https://dx.doi.org/10.1037/xhp0000663
Title Geometric categories in cognition
1 2
Authors Moira R. Dillon1*†, Marianne Duyck2,3,4*, Stanislas Dehaene5,6, Marie Amalric6,7, 3 Véronique Izard2,3 4 5 Affiliations 6 1
Department of Psychology, New York University, New York, NY, USA 7
2
CNRS (Integrative Neuroscience and Cognition Center, UMR 8002), Paris, France 8
3
Université Paris Descartes, Sorbonne Paris Cité, Paris, France 9
4
Laboratory of Sensorimotor Research, NEI/NIH, Bethesda, USA. 10
5
Collège de France, Paris, France 11
6
Cognitive Neuroimaging Unit, CEA DSV/I2BM, INSERM, Université Paris-Sud, Université 12
Paris-Saclay, NeuroSpin Center, Gif/Yvette, France 13
7
Sorbonne Universités, UPMC Université Paris 6, IFD, 4 Place Jussieu, Paris, France 14
15 16
*
These authors contributed equally and are listed in alphabetical order. 17
†
To whom correspondence should be addressed: 18
Moira Dillon 19
Department of Psychology, New York University 20 6 Washington Place 21 New York, NY 10003 22 USA 23
Abstract
25
At the scale in which we live, space is continuous. Nevertheless, our perception and cognition 26
parse the world into categories, whether physical, like scene or object, or abstract, like 27
infinitesimal point or seven. The present study focuses on two categories of special angles in
28
planar geometry, parallels and perpendiculars, and we evaluate how these categories might be 29
reflected in adults’ basic angle discrimination. In the first experiment, participants were most 30
precise when detecting two parallel or perpendicular lines among other pairs of lines at different 31
relative orientations. Detection was also enhanced for two connected lines whose angle 32
approached 90°, with precision peaking at 90°. These patterns emerged despite large variations 33
in the scales and orientations of the angle exemplars. In the second experiment, the enhanced 34
detection of perpendiculars persisted when stimuli were rotated in depth, indicating a capacity to 35
discriminate shapes based on perpendicularity in three dimensions despite large variation in 36
angles’ two-dimensional projections. The results suggest that two categorical concepts which lie 37
at the foundation of Euclidean geometry, parallelism and perpendicularity, are reflected in our 38
discrimination of simple visual forms, and they pave the way for future studies exploring the 39
developmental and evolutionary origins of these cognitive categories. 40
Keywords: categories; shape discrimination; spatial cognition; angle; geometry; parallel;
41
perpendicular; Significance: In this paper, we discover that two categories of special angles in 42
formal geometry, parallels and perpendiculars, are robustly reflected in adults’ basic angle 43
discrimination. Our results both characterize the psychophysical properties of angle 44
discrimination, which has been debated in prior literature, and also link vision research to the 45
conceptual, formal, and school-relevant spatial understanding that supports abstract mathematics. 46
Introduction
47
Categories of all kinds pervade human cognition and organize our physical and mental 48
worlds. Some categories are present early in human development and are rooted in perception. 49
For example, very young infants show more precise discrimination (indicated by an increase in 50
sucking frequency) of two synthetic speech sounds separated by a fixed distance in voice onset 51
time when that distance distinguishes voiced and unvoiced stop consonants (e.g. /b/ and /p/) 52
compared to when it does not (Eimas et al., 1971; Liberman et al., 1961). Moreover, even early 53
brain responses are modulated by categories of visual stimuli: Localized regions of the visual 54
cortex of infants as young as four months respond preferentially to exemplar pictures belonging 55
to categories like faces and scenes (Deen et al., 2017). Nevertheless, such early emerging 56
categorical processing is reshaped by experience. For example, in the first year of life, infants’ 57
auditory discrimination becomes specialized to the phonemic categories present in their native 58
language (Kuhl et al., 1992; Werker & Tees, 1984), and children’s explicit discrimination of 59
phonemes develops reciprocally with culturally constructed reading and writing systems (see 60
Anthony & Francis, 2005 for a review). Such complex developmental stories raise intriguing 61
questions about the origins of our explicit categorical knowledge in adulthood: To what extent is 62
such knowledge innate, rooted in our perceptual experiences, or acquired by explicit education or 63
immersion in a specific language and culture? And what of those categories with no apparent 64
perceptual origins or constraints, like the concept of irrational number or other such abstract 65
concepts often found in formal mathematics? In the present study, we investigate whether two 66
categories of special angles that lie at the foundation of formal, Euclidean geometry, parallelism 67
and perpendicularity (Euclid, 1990/300 B.C.E.), are reflected in adults’ basic angle 68
discrimination. We do so by evaluating whether adults’ discrimination acuity is enhanced around 69
these category boundaries in a variety of perceptual contexts. 70
At the turn of the 20th century, Wilhelm Wundt and Hermann von Helmholtz 71
independently suggested that angle discrimination may not be a wholly continuous process. They 72
observed that small angles are judged to be somewhat bigger than their actual size and that big 73
angles are judged to be somewhat smaller (von Helmholtz, 1897; Wundt, 1897). More recent 74
work on angle discrimination has aimed to explain and quantify this observation by suggesting, 75
for example, that errors in discrimination reflect orientation selectivity in the visual cortex that 76
leads to orientation distortions (Carpenter & Blakemore, 1973) or that the errors are rooted in an 77
inference about how an angle’s appearance reflects its real-world size (Howe & Purves, 2005; 78
Nundy, Lotto, Coppola, Shimpi, & Purves, 2000). 79
A number of studies have focused on comparing the threshold at which we are able to 80
discriminate various angles, but the results have been mixed. In addition, such studies often 81
incompletely controlled for a variety of visual cues in the angle stimuli, such as orientation or 82
size, and so conclusions about angle discrimination specifically have been difficult to make 83
(Werkhoven & Koenderink, 1993; Wenderoth & Johnson, 1984; Snippe & Koenderink 1994; 84
Regan & Hamstra 1992). Chen & Levi (1996) suggested, for example, that there are different 85
detection thresholds for angles of specific sizes, reporting more fine-grained discrimination of 86
90º angles in a discrimination space that otherwise follows Weber’s Law. While such thresholds 87
were measured for 12 different reference angles (ranging from 15º -180º), the angles were 88
presented at only two different orientations, vertical or oblique, so it remains unclear whether the 89
thresholds were generalizable to more variable orientations. Heeley & Buchanan-Smith (1996) 90
found a similar pattern of discrimination thresholds with angles presented at random orientations, 91
but they did not simultaneously vary the lengths of the lines that formed the angles, allowing for 92
other, global shape cues to drive participants’ performance. Regan, Gray, & Hamstra (1996), in 93
contrast, found fairly constant thresholds of angle discrimination between 20º and 160º when 94
angles were presented at a wide range of orientations. The authors suggest, however, that their 95
discrepant findings might have been due to their unique methodology: Participants compared 96
each stimulus to a reference angle size internalized through many practice trials, rather than to a 97
physical display. The existing literature thus suggests that discrimination may be most precise 98
around 90º angles, but it remains inconclusive. 99
In the present study, we measured the discrimination thresholds for many different angles 100
using an intruder task (after Dehaene, Izard, Pica, & Spelke, 2006). We evaluated whether 101
participants could locate an intruder that differed in angle size among five other angle exemplars 102
of the same angle size as each other. The lines forming the angles varied considerably in their 103
lengths and orientations to ensure that responses were made on the basis of angle alone within an 104
individual trial. In addition, no individual lines were oriented within 10° of the horizontal or 105
vertical to avoid any specialized angle discrimination that might occur when individual lines are 106
orientated at the horizontal or vertical (Xu, Chen, & Kuai, 2018). 107
We hypothesized that angle discrimination may reflect categories of parallelism and 108
perpendicularity in two ways. First, detection thresholds may be more precise when parallels or 109
perpendiculars serve as reference angles, compared to intruder angles of other sizes. Second, the 110
detection of angle intruders may be asymmetric such that, for reference angles near 0°/180° and 111
90°, intruders whose angle size moves towards versus away from the parallel or perpendicular 112
category boundaries will be easier to detect. This second prediction should hold when intruders 113
cross the category boundary and also, perhaps, when intruders approach but do not cross the 114
boundary. In Experiment 1, we find evidence for such categories. In Experiment 2, we 115
demonstrate the robustness of these categories by imposing an additional rotation in depth in the 116
experimental displays, dissociating 3D perpendicularity from 2D angle. 117 118 Experiment 1 119 Methods 120 Participants 121
Eight adults (four women; Mage = 25 years; range 19-28 years) participated in this experiment. 122
The sample size was set in advance based on the maximum sample size (8 participants) used in 123
several other studies investigating angle discrimination and presenting large numbers of trials to 124
individual participants (Chen & Levi, 1996; Regan, Gray, & Hamstra, 1996; Heeley & 125
Buchanan-Smith, 1996; Snippe & Koenderink 1994; Regan & Hamstra 1992, Xu et al., 2018). In 126
addition, stimuli were piloted in advance on three of the study’s authors, and effects were robust 127
enough to emerge in each pilot participant. As such, we also illustrate individual participant 128
results in the figures and SM. All participants had normal or corrected-to-normal vision and had 129
completed high school; most of them had also received a college or advanced degree. None were 130
informed of the purpose and hypotheses of the study until after it was completed. This study was 131
part of a research program approved by the Paris Descartes Ethics Committee (Conseil 132
d’Évaluation Éthique pour les Recherches En Santé, CERES) and each participant provided 133
informed consent prior to the experiment. Participants were paid 10€ per hour plus an additional 134
sum, which depended on their performance (see below). On average, participants earned 77.38€ 135
(range 75.60€-80.07€). 136
Design, Apparatus, Procedure, and Stimuli
For each trial, participants were presented with six angles, five of which were identical in their 138
angle size (hereafter referred to as the “reference” angle) and one of which differed in its angle 139
size (hereafter referred to as the “deviant” angle). Participants were asked to identify the deviant 140
angle. In the connected lines condition (Figure 1A), angles were composed of two lines that met 141
at one end. Participants saw trials in seven different blocks, each block with a different reference 142
angle. The angle measures of the stimuli are summarized Table 1. The reference angles were 143
chosen to evaluate discrimination thresholds symmetrically around 90°, and the angle differences 144
between the reference angles and each deviant were chosen to capture potentially large 145
differences in discrimination thresholds across the different references (if, e.g., discrimination 146
followed Weber’s Law). To probe the detection of 90° deviants specifically, +/-10° were 147
presented in the 80° and 100° reference blocks. In the non-connected lines condition (Figure 148
1B), two lines were oriented relative to one another, but did not meet, and participants saw eight
149
different reference angles in separate blocks (Table 1). We again added 90° deviants in the 80° 150
and 100° blocks. We also added 0° (parallel) deviants in the 10° block and removed from that 151
block the -12° and -18° deviants since these values were not geometrically possible (i.e., they 152
would have resulted in -2° and -8° deviants, which would be equivalent to 2° and 8° angles). 153
Each type of deviant was presented 18 times in a random order in a block, three times at each of 154
six possible target locations. The number of trials per block thus ranged from 126 to 162. Finally, 155
despite the addition of 0° and 90° deviants in some reference blocks, those angles were not over-156
represented in the experiment. For example, in the connected lines condition, a total of 756 90° 157
exemplars were presented, compared to 810 exemplars of 80° and 100° angles and 720 158
exemplars of the angles in the other reference blocks (Table 1). 159
Reference Angles 0 10 25 55 80 90 100 125 155 De vian t A n gle D iff er en ce -18 18 7 37 62 72 82 107 137 -12 12 13 43 68 78 88 113 143 -10 0 90 -7 7 3 18 48 73 83 93 118 148 -3 3 7 22 52 77 87 97 122 152 +3 3 13 28 58 83 93 103 128 158 +7 7 17 32 62 87 97 107 132 162 +10 90 +12 12 22 37 67 92 102 112 137 167 +18 18 28 43 73 98 108 118 143 173
Table 1. Summary of the stimuli presented in Experiments 1 & 2. The 25° and 155° reference
161
angles were presented only in Experiment 1 and the 0° and 10° reference angles were presented 162
only in the non-connected lines condition of Experiment 1. All angle measures are in degrees. 163
164 165
166
Figure 1. A. Exemplar trials from the connected lines condition. Participants showed smaller
167
discrimination thresholds with 90° reference angles (top) than with 80° reference angles 168
(bottom). B. Exemplar trials from the non-connected lines condition. Participants easily 169
distinguished non-parallel lines among parallel lines (top) but had difficulty with larger deviants 170
when reference angles were 10° (bottom). Here, deviants differ from the reference angles by 24° 171
(the difference used during training trials). For illustration purposes, the correct responses are 172
circled in red. 173
174
Participants were seated in a lit room (62 cd.m-2) at eye level and 48 cm away from the 175
center of an LCD monitor (60 Hz) subtending 44 x 32 degrees of visual angle (dva). On every 176
trial, six angles appeared at the same time in one of the six white circular placeholders 177
(124 cd.m-2, 5 dva radius). These placeholders were equally distributed around a 11 dva radius 178
circle centered on a central black fixation dot (0.15 cd.m-2, 0.4 dva radius) on a light grey screen 179
(92 cd.m-2). While maintaining their head position with a chin rest, participants were given 5 s to 180
look at all of the angles before the angles disappeared. Participants could respond 250 ms after 181
the presentation onset or up to 30 s after the angles disappeared. At the beginning of each trial, 182
the cursor was positioned at the center of the screen. Participants clicked on the location of the 183
deviant angle and received informative auditory feedback. The next trial started 500 ms after the 184
response. After every quarter of a block, the percentage of correct responding was displayed as 185
well as the sum earned during that block. Participants earned 0.014€ per correct response. 186
In both conditions, the lines that formed each angle were the same length, but these 187
lengths varied across angles in the same display (chosen randomly from a uniform distribution 188
between 2 and 4.4 dva). Lines were never within 10° of the vertical or horizontal axes of the 189
screen. In the non-connected lines condition, one of the lines was displaced relative to the other 190
line both along it (up to its midpoint) and orthogonally (0.6-2.5 dva) to it. Finally, to ensure that 191
all angles in each display were presented at sufficiently different orientations, each was initially 192
assigned to either 0°, 60°, 120°, 180°, 240°, and 300° relative to the screen and then each was 193
jittered randomly between +/-30°. Each angle was then translated to a random location within 0.4 194
dva of its placeholder’s edge. 195
The experiment was divided into two sessions corresponding to the two conditions, 196
which took place on different days within a two-week period. The order of conditions was 197
counterbalanced across participants. Each session started with a short training phase consisting 198
of two trials per reference angle displaying +/- 24° angle deviants. These trials were first 199
presented with unlimited viewing time and then with the 5 s viewing time used in the actual 200
experiment. Each block started with an introductory screen instructing participants to click on the 201
shape that had a different angle size from the rest. This introductory screen also displayed one 202
example of the reference angle for that block, oriented such that a vertical line would bisect the 203
angle. The order of the blocks was random for each participant. Each session lasted 204
approximately 3 hours, with a 15-30 min break after the fourth block in each condition. 205
206
Analyses
207
Participants’ performance for each reference angle and for both the connected and non-208
connected line conditions was fit with down-pointing Gaussian curves constrained to chance 209
performance (chance = 0.167) at a difference of zero degrees and perfect performance at a 210
difference of infinity. The fitted Gaussians were used to estimate individual participants’ 211
thresholds. These thresholds corresponded to the difference in degrees between the reference and 212
the deviant such that the participant could detect the deviant on half of the trials and was 213
guessing on the other half (i.e., performance of 0.583, halfway between chance and perfect 214
performance). To capture possible asymmetries in participants’ responses, performance was fit 215
separately for smaller and larger deviants. Overall thresholds for each reference were obtained by 216
averaging these two values. Because we did not present the same number and measure of angle 217
deviants across reference angles (e.g., we included 10° deviants in the 80° block, but not in the 218
55° block), such thresholds were more appropriate than raw accuracies to compare performance 219
across reference angles. This measure was decided on after pilot testing and in advance of any 220
data collection. 221
In the connected lines condition, all eight participants performed above chance on all 222
seven reference angle conditions with both smaller and larger deviants (binomial tests, two-223
tailed, all ps < 0.05), yielding 112 data sets with above-chance performance. In the non-224
connected lines condition, however, 17 of the 128 data sets did not significantly differ from 225
chance, thus yielding unreliable detection thresholds (see Figure 2 for the accuracy curves of a 226
representative participant and Figure S1 for all individual accuracy curves). To analyze the 227
results of the non-connected lines condition, we thus used non-parametric, rank-order tests 228
instead of parametric tests, which replaced estimated threshold values with ranks based on 229
thresholds’ relative magnitudes. As confirmation of our results for this condition using this 230
method, we also analyzed participants’ accuracy using parametric tests, and we obtained the 231
same results (see SM, Table S1, Figure S2). 232
First, we evaluated participants’ performance in the connected lines condition. Using 233
planned one-tailed t-tests, we examined whether participants’ detection thresholds were more 234
precise for the perpendicular (90°) reference angles compared to the 80° and 100° reference 235
angles (the closest references to 90°, a 10° difference) and to the 55° and 125°reference angles 236
(references further from 90°, a 35° difference). In those same reference blocks, we then 237
examined whether deviant detection was more precise when deviants approached or crossed the 238
90° boundary compared to when they did not. For example, we evaluated whether thresholds in 239
detecting larger deviants in 80° reference blocks were more precise than detecting smaller 240
deviants in 80° reference blocks. Since all four comparisons tested whether angle discrimination 241
was influenced by the category of right angles, p-values were adjusted for multiple comparisons 242
using Holm’s method. 243
For the non-connected lines condition, we investigated whether detection thresholds were 244
more precise for the perpendicular (90°) and parallel (0°) reference angles using planned Holm-245
corrected, one-tailed Wilcoxon signed-ranks tests. As in the connected lines condition, we 246
compared the thresholds of detecting deviants with a 90° reference both to those with an 247
80°/100° reference and also to those with a 55°/125° reference. In addition, we also compared 248
the thresholds of detecting deviants with a 0° reference to the two closest reference blocks (10° 249
and 25°). Finally, we tested for asymmetries in detection thresholds around these categories by 250
examining whether deviant detection was more precise when deviants approached or crossed the 251
90° or 0° boundaries compared to when they did not. 252
253 254
255
Figure 2. Model-fit curves for one participant (S2) for all reference angles in the connected lines
256
condition of Experiment 1. Individual data points are additionally represented for the 80°, 90°, 257
and 100° reference blocks. These curves illustrate lower thresholds in the 90° reference block 258
(i.e., a more narrow curve, in yellow) and lower thresholds for deviants towards versus away 259
from 90° (i.e., an asymmetry in the curves around 0° of deviation) in the 80° (in green) and 100° 260
(in orange) reference blocks. 261
262 263
Results
264
Connected Lines Condition
265
Figure 3A displays the individual and average detection thresholds for each angle
266
reference in the connected lines condition. All participants had similarly shaped curves, in which 267
detection thresholds were smaller as reference angles approached 0°/180°. Strikingly, all 268
participants also showed steep drops in their detection thresholds as angle references approached 269
90°. Group-wise analyses, summarized in Table 2, corroborated these results, finding 270
significantly more precise detection thresholds for 90° reference angles compared to 80°/100° 271
reference angles (t(7) = 5.47, p < .001, Cohen’s d = 1.94) and 55°/125° reference angles (t(7) = 272
10.05, p < .001, Cohen’s d = 3.55). Such differences are characteristic of a categorical effect at 273
90°. 274
Moreover, we observed significant asymmetries in the blocks where the deviants crossed 275
the 90° boundary (80° and 100° references). In these blocks, deviant detection was more precise 276
towards 90° compared to away from it (Table 2; t(7) = -6.29, p < .001, Cohen’s d = 2.23). 277
However, no asymmetries were observed in the 55°/125° reference blocks (t(7) = 0.21, p = .419, 278
Cohen’s d = 0.07). Thus, as deviants crossed 90°, their discrimination became more precise, 279
again signaling an influence of the perpendicular category on performance (see Figure 3B). 280
281 282
Perpendicular
90 80/100 55/125
Connected Lines – thresholds 5 8.9*** 11.2***
Connected Lines – asymmetry toward: 6.9; away: 10.8** toward: 11.1; away: 11.2
Non-Connected Lines – thresholds 8 13.6* 20.7*
Non-Connected Lines – asymmetry toward: 10.1; away: 16.6* toward: 19.5; away:19.0
Parallel
0 10 25
Non-Connected Lines – thresholds 3 13.3* 20.0*
Non-Connected Lines – asymmetry toward: 5.1; away: 21.2* toward: 12.1; away: 28.4*
Table 2. Group-wise mean (for the connected lines condition) or median (for the non-connected
283
lines) detection thresholds for perpendicular and parallel reference angle blocks compared to 284
other reference blocks and detection asymmetries. Planned, Holm-corrected one-tailed t-tests (for 285
the connected lines condition) or Wilcoxon signed-ranks tests (for the non-connected lines 286
condition) compare the 90° or 0° reference blocks to the other reference blocks and the 287
magnitude of the asymmetry effects. All angle measures are in degrees. *p < .05, ** p < .01, 288
***p < .001. 289
290 291
292
Figure 3. A. Estimated detection thresholds for each participant (grey lines) and on average
293
(black line) at different reference angles for the connected lines condition. All curves are 294
characterized by threshold drops towards 0°/180° as well as a sharp drop at 90°. The dashed 295
curve corresponds to the participant shown in Fig. 2. B. Asymmetries in the thresholds for 296
detecting smaller versus larger deviants at different reference angles. Positive values on the y-297
axis indicate greater success in detecting larger versus smaller deviants, and negative values 298
indicate the opposite. The dashed curve corresponds to the participant shown in Fig. 2. For 80° 299
and 100° references, acuity is better (smaller thresholds) when the deviant is in the direction of 300
90°. The asymmetry in detection thresholds crosses zero at almost exactly 90°, and there appears 301
to be an approximately identical advantage on both sides of 90°. 302
303 304
Non-Connected Lines Condition
305
Figure 4A displays the individual and median detection thresholds for each reference
306
angle in the non-connected lines condition. All participants had similarly shaped curves, in 307
which detection thresholds were smallest at 0° compared to other reference angles (see Figure 308
S1 for individual participant accuracy curves). Group-wise analyses corroborated these results
309
(see Table 2), finding more precise detection thresholds for 0° reference angles compared to 10° 310
and 25° reference angles (10°: Z = 2.15, p = .016, 8/8 participants showed the effect; 25°: Z = 311
2.15, p = .016, 8/8 participants showed the effect). Moreover, participants performed better with 312
angles deviating towards versus away from 0° with both 10° and 25° reference angles (10°: Z = 313
2.15, p = .016, 8/8 participants showed the effect; 25°: Z = 2.15, p = .016, 8/8 participants 314
showed the effect; see Figure 4B) suggesting that parallel lines might serve as an anchor for 315
judgments of discrimination. 316
Detection thresholds were quite variable across participants between 10° and 80°, though 317
they exhibit a similar shape, first increasing at smaller reference angles and then decreasing at 318
larger reference angles. Evidently, acute angles are difficult to differentiate with non-connected 319
lines. Nevertheless, as in the connected lines condition, participants’ precision increased around 320
90° compared to 80°/100° reference angles (Z = 2.15, p = .016; 8/8 participants showed the 321
effect) and to 55°/125° reference angles (Z = 2.15, p = .016; 8/8 participants showed the effect; 322
see Table 2). We also observed significant asymmetries in detection thresholds, with better 323
discrimination as deviants approached or crossed the 90° boundary in the 80°/100° reference 324
blocks (Z = 2.15 p = .016, 8/8 participants showed the effect), but not in the 55°/125° reference 325
blocks (Z = 0.07, p = .473, 4/8 participants showed the effect; see Fig. 4B). 326
327
328
Figure 4. A. Estimated detection thresholds for each participant (grey lines) and the group
329
medians (black line) at different reference angles for the non-connected lines condition. 330
Thresholds at some reference angles for some individuals exceed the graph limit. All curves are 331
characterized by low thresholds for the 0° reference angle as well as a sharp drop at the 90° 332
reference angle. B. Asymmetries in the detection thresholds for larger versus smaller deviants at 333
different reference angles. The detection threshold asymmetry crosses zero at around 90°, with 334
an approximately equal advantage on both sides. 335
336
Discussion
337
This experiment presents two main findings. First, acuity in angle discrimination varies 338
massively across angles. In particular, thresholds are smallest for parallels and perpendiculars. 339
When angles are acute or obtuse and far from these two categories, thresholds of discrimination 340
are high, though when angles deviate from such acute or obtuse angles and approach the parallel 341
or perpendicular categories, discrimination becomes more precise. These effects persist over 342
variations in the orientation and scale of the angle exemplars. While other studies reviewed 343
above have found similar categorical responses to parallels and perpendiculars under some 344
conditions, our results suggest that angle discrimination in general and the more precise 345
discrimination of these angle categories in particular are invariant to scale and orientation. 346
How robust, then, are the categories of parallelism and perpendicularity in the face of 347
more drastic variation in the angle stimuli, such as rotations in 3D depth, which are prevalent in 348
everyday viewing conditions? In Experiment 1, where stimuli were presented in the 349
frontoparallel plane, the higher precision for parallel and perpendicular lines could have arisen 350
from a specific sensitivity at the retinal or retinotopic level. If, however, the effect arises at a 351
more abstract representational level, i.e., that parallelism and perpendicularity are properties that 352
apply to the arrangement of lines in 3D space, then the effect should remain even if the stimuli 353
are rotated in 3D depth, off the frontoparallel plane. This manipulation applies specifically to 354
perpendicular lines: While parallel lines remain parallel even with rotation in depth (save a few, 355
“accidental” viewpoints where their projections coincide: Amir, Biederman & Hayworth, 2011; 356
2012; Biederman, Yue, & Davidoff, 2009), perpendicular lines vary greatly in their projected 357
angle measure when the lines are rotated in depth (Nundy et al., 2000). Experiment 2 was 358
therefore conducted both to evaluate how well the detection of perpendicular lines is preserved 359
under viewing conditions that include additional rotations in 3D depth and to examine whether 360
perpendicularity as a category persists under these conditions. 361
362
Experiment 2
363
In this experiment, we presented new participants with stimuli derived from the 364
connected lines condition of Experiment 1. In the slanted screen condition (Figure 5A), 365
participants viewed the same stimuli as Experiment 1, but on a screen that was rotated in depth 366
by 45°. In the normal viewing condition (Figure 5B), participants were presented with the same 367
stimuli as Experiment 1 with an un-rotated, frontoparallel screen (i.e., a direct replication of 368
Experiment 1). By comparing participants’ performance in these two conditions, we could
369
evaluate whether both angle discrimination in general and the perpendicular category in 370
particular persist with the rotation of our visual stimuli in depth. In the projected stimuli 371
condition (Figure 5C), participants viewed the projection of the stimuli presented in the slanted 372
screen condition on a frontoparallel screen. With this condition, we could evaluate whether the 373
3D context, presenting consistent cues to the reference frame transformation (like would be 374
present in our everyday object recognition, see Nakayama, He, & Shimojo, 1995) or some 375
general property of the stimuli’s projection (which has a less clear connection to our everyday 376
perceptual experience) might explain participants’ responses in the slanted screen condition. If 377
participants showed the same pattern of performance on the projected stimuli condition and the 378
slanted screen condition, then there may be some geometric information at the level of the retinal 379
projection that is guiding responses on the slanted screen condition. 380
381
382
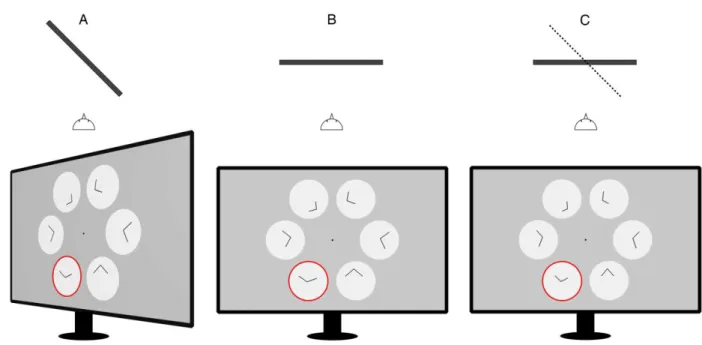
Figure 5. The top panel illustrates on overhead perspective of the setup for the screen and
383
participant for the three conditions: (A) slanted screen; (B) normal viewing; (C) projected 384
stimuli. The lower panel illustrates the same trial (100° referent angle and 124° deviant) as it
385
would be seen on the screen in each condition. The angles in the slanted screen condition are 386
identical to the angles in the projected stimuli condition when projected on to the frontoparallel 387
plane, as illustrated here. For illustration purposes, the correct response is circled in red. 388 389 Methods 390 Participants 391
Twelve adults (10 women; Mage = 23 years; range 19-38 years) participated in this 392
experiment. The sample size was set in advance of data collection. With the sample size and 393
smallest effect size from Experiment 1 (N = 8, Cohen’s d = 1.94), our power to detect group-394
wise categorical effects within condition would be .999. We decided to increase our sample size 395
by four participants compared to Experiment 1 since we also planned to compare results across 396
conditions in this experiment and investigate effects by condition. All participants had normal or 397
corrected-to-normal vision and had completed high school; most of them had also received a 398
college or advanced degree. None were informed of the purpose and hypotheses of the study 399
until after it was completed. Each provided informed consent prior to the experiment and were 400
paid 10€ per hour plus an additional sum, which depended on their performance. On average, 401
participants earned 72.95€ (range 70.47€-75.56€). 402
Design, Apparatus, Procedure, and Stimuli
403
The distance of the participant to the center of the screen, the lighting conditions, the 404
placeholder sizes, the screen luminance, the presentation duration, and the stimuli parameters 405
were identical in all conditions of Experiment 2 to the connected lines condition of Experiment 406
1, except that the lines that formed each angle were slightly shorter (uniform distribution from 407
1.6 to 3.5 dva). In the projected stimuli condition, the angles were transformed by reducing all 408
horizontal coordinates of each angle by a factor of , while keeping all vertical coordinates 409
constant. This transformation was applied to the angles only so that the external reference frame 410
in the slanted and projected stimuli conditions (placeholders’ shapes and screen frame) provided 411
cues to enforce the perception of a slanted or frontoparallel presentation of the stimuli. As in 412
Experiment 1, trials were blocked by reference angle but fewer reference angles were presented 413
to focus on the comparisons that were most relevant to exploring the categorical effect (see 414
Table 1). Each type of deviant was presented 18 times in a random order in a block, three times
415
at each of six possible target locations. The total number of trials per block thus ranged from 144 416
to 162. 417
The experiment was divided into three sessions, one for each of the three experimental 418
conditions. The sessions took place on different days, one to five days apart, and the order of the 419
condition presented at each session was counterbalanced across participants. Sessions started 420
with a short training phase consisting of two trials per reference angle displaying +/- 24° angle 421
deviants. Five blocks corresponding to the five reference angles followed the training phase. The 422
order of the blocks within a session was chosen randomly for each participant. Each session 423
lasted approximately 1.5 hours. As in Experiment 1, at the beginning of each block, participants 424
were given a slide with instructions, showing an example of the reference angle in the vertical 425
orientation. This slide was identical in the slanted screen, normal viewing, and projected stimuli 426
conditions. 427
Analyses
428
As in Experiment 1, we fit performance with asymmetric down-pointing Gaussian 429
curves. However, in several cases participants responded at chance (across participants: 10/120 430
blocks in the slanted screen condition; 3/120 blocks in the normal viewing condition; and 45/120 431
blocks in the projected condition; see Figure S3 for individual accuracy curves). Such at-chance 432
performance resulted in very high and unreliable estimated threshold values. We thus again used 433
non-parametric rank tests to minimize the impact of these extreme values in our comparisons, 434
and we also conducted parametric analyses on accuracy data, which yielded identical results 435
except where indicated (see SM, Table S2). 436
As in Experiment 1, for all conditions of Experiment 2, we examined whether angle 437
detection was more precise for the 90° reference angle compared to the other reference angles 438
that were close to and far from 90° (i.e., 80°/100° reference angles and 55°/125° reference 439
angles). We also evaluated whether deviant detection was more precise when deviants 440
approached or crossed the 90° boundary compared to when they did not (all using Holm-441
corrected, one-tailed Wilcoxon signed-ranks tests). We only evaluated the asymmetries in the 442
80°/100° reference angles since the asymmetries in the 55°/125° reference angles were not 443
significant in Experiment 1. By comparing the findings across the three conditions, first we 444
asked whether categorical effects were present in the slanted screen condition, as in the normal 445
viewing condition (we compared the thresholds and asymmetries in these two conditions using 446
Scheirer-Ray-Hare [SRH] tests, a non-parametric equivalent of a two-way repeated measures 447
ANOVA). Second, we asked whether the effects observed with the slanted screen were due to 448
information present in the stimuli’s projection rather than based on shape information invariant 449
to 3D rotations (by comparing the slanted screen condition to the projected stimuli condition 450
using a second SRH test). 451
452
Results
453
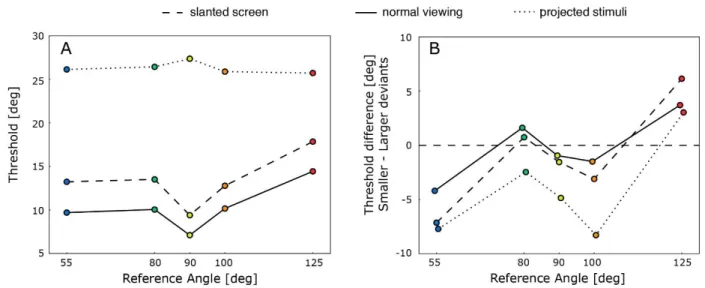
Figure 6A shows the median detection thresholds for each reference angle in all three
454
conditions, and Table 3 shows tests for within-condition categorical effects. First, in the slanted 455
screen condition, we observed more precise detection thresholds for 90° reference angles 456
compared to both the 80°/100° reference angles (Z = 3.18, p < .001, 12/12 participants showed 457
the effect), and also the 55°/125° reference angles (Z = 3.18, p < .001, 12/12 participants showed 458
the effect). Second, this categorical effect did not differ across the slanted screen and normal 459
viewing conditions. An SRH test comparing these two conditions revealed a significant main 460
effect of reference angle (H = 8.37, p = .004), a significant main effect of condition (H = 5.87, 461
p = .015), but, crucially, no interaction between reference angle and condition (H = 0.20,
462
p = .653). As such, our normal viewing condition also replicated the results of Experiment 1,
463
finding smaller detection thresholds with the 90° reference angle compared to the other reference 464
angles (80°/100°: Z = 2.47, p = .007, 11/12 participants showed the effect; 55°/125°: Z = 2.98, p 465
= .001, 11/12 participants showed the effect). 466
467
Perpendicular
Slanted Screen - thresholds 9.4 13.2*** 15.9***
Slanted Screen - asymmetry toward: 12.8; away:14.8*
Normal Viewing - thresholds 7.1 10.6** 12.2**
Normal Viewing - asymmetry toward: 9.5; away: 11.3*
Projected Stimuli - thresholds 27.3 26.5 25.9
Projected Stimuli - asymmetry toward: 22.1; away: 28.1
Table 3. Group-wise median detection thresholds for perpendicular reference angle blocks
468
compared to other reference blocks. Planned, Holm-corrected one-tailed Wilcoxon signed-ranks 469
tests compare the 90° reference blocks to the other reference blocks. All angle measures are in 470 degrees. **p < .01 ***, p < .001. 471 472 473 474
Figure 6. A. Median thresholds for different reference angles in the three conditions of
475
Experiment 2. While the slanted screen and normal viewing conditions show a sharp drop at the 476
90° reference angle, the projected stimuli condition does not. B. Asymmetries in the threshold of 477
detection for larger versus smaller deviants at different reference angles. 478
479 480
Does the increased performance with the 90° reference angle in the slanted screen 481
condition result from an analysis of the stimuli as projected or from an invariance of the 482
detection of perpendicularity over rotations in depth? If the former, then the same categorical 483
effects should be present in the projected stimuli condition. An SRH test comparing the slanted 484
screen and projected stimuli conditions revealed a significant main effect of reference angle (H 485
= 5.89, p = .015), a significant main effect of condition (H = 11.67, p < .001), and an interaction 486
between reference angle and condition (H = 8.56, p = .003). Indeed, contrary to the slanted 487
screen condition, there was no sign of categorical effects in the projected stimuli condition, as 488
performance with the 90° reference angle was no different from the other reference angles (ps = 489
1.00). 490
Next, we assessed whether performance for reference angles 80°/100° was better when 491
the deviant approached or crossed the 90° boundary (see Figure 6B). Performance was 492
significantly asymmetric in the slanted screen condition (Z = 1.85, p = 0.032, 9/12 participants 493
showed the effect). An SRH test comparing the thresholds towards and away from 90° in the 494
slanted screen and normal viewing conditions revealed a significant main effect of deviant 495
direction (H = 5.00, p = .025), condition (H = 7.29, p = .007), but no interaction between these 496
two factors (H = 0.02, p = .896). In the normal viewing condition too, there was a significant 497
asymmetry in detection thresholds (Z = 1.85, p = .032, 8/12 participants showed the effect). 498
Thus, the asymmetry effects were comparable across the slanted screen and normal viewing 499
conditions and were comparable to Experiment 1. 500
Finally, an SRH test comparing the slanted screen and projected stimuli conditions on the 501
asymmetry of their deviant detection thresholds revealed a main effect of deviant direction 502
(H = 6.88, p = .009), condition (H = 11.38, p < .001), and no interaction between the two factors 503
(H = 0.09, p = .770). Indeed, asymmetries followed the same pattern in the projected stimuli 504
condition as in the other conditions, with slightly better performance for angles deviating 505
towards 90° versus away from 90°, though this difference was not significant (Z = 1.20, p = .116, 506
8/12 participants showed the effect; see SM, Table S2). These weak asymmetry effects in the 507
projected stimuli condition may have been due to a residual property of the angle transformation, 508
rather than to participants’ categorical discrimination of projected 90° angles. In particular, when 509
the stimuli were transformed, the range of angle sizes presented on the screen differed based on 510
the reference angle, with the greatest range occurring at 90°. Moreover, projected deviant angles 511
fell outside the range of projected reference angles around 90° more often for deviants towards 512
90° than for deviants away from 90°, making deviants towards 90° easier to detect. 513
514
Discussion
515
This experiment builds on the findings of Experiment 1 by suggesting that both angle 516
discrimination in general, and the perpendicular category in particular, are largely invariant to 517
the rotation of shape stimuli in depth. A 45° rotation of the screen in the slanted screen condition 518
degraded discrimination performance uniformly, yet left the relative discriminability of angles of 519
different sizes intact, including preserving peak discriminability at 90°. Because the 90° angles in 520
that condition were defined only in three dimensions with widely varying 2D projections, these 521
results suggest that participants detected the angle intruder by monitoring the 3D angle sizes 522
rather than their retinotopic, 2D projections. This conclusion is further supported by comparisons 523
between the slanted screen condition and the projected stimuli condition. Here, the 2D angles 524
that were projected on the retina were identical between conditions, yet accuracy varied greatly, 525
suggesting that the preserved shape discrimination in the slanted screen condition was not due to 526
properties of the 2D projection of the stimuli. Indeed, participants performed so poorly in the 527
projected stimuli condition that the data were difficult to model, and it is thus hard to make 528
specific conclusions about the characteristics of our shape discrimination with stimuli 529
transformed in this way. By contrast, rotating shapes in depth, with all of the real-world depth 530
cues intact, led to a largely preserved ability to discriminate angles. 531
532
General Discussion
533
Across two experiments presenting angle-intruder detection tasks, we demonstrated that 534
the discriminability of both connected and non-connected lines forming different angles varies 535
greatly depending on the size of the angles being discriminated. Most notably, thresholds of 536
discrimination were significantly smaller when lines formed parallels and perpendiculars. When 537
angles were acute or obtuse and far from these two special angle categories, thresholds of 538
discrimination were high, though when angles deviated from nearer acute or obtuse angles to 539
approach the parallel or perpendicular categories, discrimination became more precise. This 540
pattern of results persisted not only over variations in the orientations and scale of the angle 541
exemplars, but also over their rotations in depth. In particular, when the very same angle stimuli 542
were presented on a screen rotated 45° in depth, the relative discriminability of angles of 543
different sizes persisted. Most remarkably, the significantly smaller threshold for detecting 544
perpendicular angles persisted, despite the variability in the 2D projections of these angles, and 545
this result was not due to properties of the stimuli’s 2D projection. Our findings thus suggest that 546
angle discrimination in general and the special angle categories of parallelism and 547
perpendicularity in particular affect participants’ shape judgments by their real-world angle 548
information. 549
The prior literature had outlined different models of angle discrimination to which we can 550
compare our results. In two cases, more precise discrimination for horizontal and vertical lines 551
was invoked to explain better acuity for 90° and 0/180° angles: Chen & Levi (1996) suggested 552
an orientation-independent, Weber-like discrimination space except at 90°, where discrimination 553
is heightened and rooted in the presence of vertical and horizontal lines; Xu et al. 554
(2018) proposed that angles which include either a vertical or horizonal line are discriminated 555
most precisely. In contrast, Heely & Buchanan-Smith (1996) proposed that, unlike 556
the discrimination of individual line orientations, angle discrimination operates over a reference 557
frame that is object-centered, like the discrimination of other, more complex objects. Our 558
findings thus support and extend this last model: Not only did our stimuli specifically avoid 559
using lines at or near the horizontal or vertical, but also more precise discrimination 560
persisted when the angles were rotated in 3D depth, suggesting that angle discrimination unfolds 561
at the level of the 3D angle size, as it might for the shape of complex 3D objects. 562
What then is the status of the geometric categories of parallelism and perpendicularity? 563
Some research has suggested that sensitivity to parallelism, at least, arises early in child 564
development. Even four-year-old children indicate that a pair of parallel lines is the “most 565
different” from five other pairs of lines that present continuous differences in angle at varied 566
absolute orientations and scales (Izard et al., 2011a; 2011b). Children’s knowledge of the word 567
“parallel,” moreover, has no relation to this choice (Izard et al., 2011a; 2011b). As such, 568
children’s judgments of parallelism may be rooted in the recognition of more basic shape 569
properties, for example, that two lines have the same orientation or that they maintain a constant 570
distance from each other — and perhaps these very properties contribute to the categorical 571
effects for parallels documented here. Future research should explore whether children display 572
the same categorical effects around the discrimination of parallels as adults and whether their 573
specialized treatment of parallel lines changes with more visual experience or with explicit 574
learning of formal geometry in school. 575
What about perpendicularity, whose angle measure changes greatly with rotations in 3D 576
depth? Unlike their performance with parallel lines, not until age seven or older do children pick 577
out a pair of perpendicular lines from other pairs of lines that vary continuously in angle, and 578
individual children’s knowledge of the lexical terms “right angle” and “perpendicular” correlates 579
with this choice (Izard et al., 2011a). The present task with adults did not rule out the possibility 580
that explicitly learned conceptual representations were supporting participants’ performance. All 581
the adults in this study had benefitted from a formal education at least through high-school, 582
which likely included a geometry class where the concepts of parallelism and perpendicularity 583
were taught. In particular, since participants were introduced to each block of trials with an 584
image that depicted the reference angle, it was possible that, for the parallel and perpendicular 585
categories, participants labeled the reference and used that label to access a stored representation 586
of an exemplar from that category from memory, making its recognition more accurate 587
(Firestone & Scholl, 2016). Like other studies examining advantages in discrimination for 588
complex spatial stimuli, defined, e.g., by topological relations, it is unknown the extent to which 589
the present findings reflect verbal coding or pure visual processing (Lovett & Franconeri, 2017). 590
Indeed, a suite of studies using search tasks and deviant detection tasks show enhanced detection 591
of visual stimuli including colors, simple shapes, and more complex objects when category 592
boundaries line up with linguistic labels (see Goldstone & Hendrickson, 2010; Lupyan, 2012). 593
Future studies using the same angle stimuli with adults from other cultures, children, and non-594
human animals might shed further light on whether the effects observed in this study were 595
perceptual or cognitive. 596
Nevertheless, the detection of perpendicular angles may indeed be universal. A group of 597
adults from the Mundurucu tribe in the Amazon, who, unlike the adults in the present sample, 598
have no specialized geometric training or vocabulary, pick out a pair of perpendicular lines as the 599
“most different” from other pairs of lines that vary continuously in angle (Izard et al., 2011a). 600
While categorization of perpendiculars (as in this study with the Mundurucu adults, Izard et al., 601
2011a) and categorical effects in discrimination (as measured with the adults in this paper) may 602
dissociate, it is possible that a perceptually based perpendicular category arises spontaneously in 603
development and that education in formal geometry refines it or heightens attention to it (see 604
Piazza, Pica, Izard, Spelke, & Dehaene, 2013 for further exploration of this suggestion in the 605
numerical domain). If this is the case, it remains a challenge to identify a perceptual learning 606
mechanism that might operate over such a long period of development and create such a robust 607
category. 608
Might visual experience through development bolster our recognition of 3D shape 609
information from which a heightened sensitivity to perpendicular angles could emerge? Previous 610
work has shown that high-level perceptual learning can occur over extended periods of time, for 611
example, to create or refine specific object categories like letters and faces (Dehaene, Cohen, 612
Sigman, &Vinckier, 2005; Maurer, Le Grand, & Mondloch, 2002). This kind of perceptual 613
learning is nevertheless limited, in that categorical effects disappear when, for example, face 614
stimuli are inverted (Maurer et al., 2002). Such limits may be adaptive to the context: While face 615
recognition is not invariant to large 2D orientation changes, it is invariant over large changes in 616
viewpoint (i.e., in full view or in profile), expression, and lighting (Anselmi & Poggio, 2014). 617
The perceptual learning associated with 3D object recognition may accumulate 2D and 618
3D rotational invariance through development since objects are often seen rotated in 2D or 3D 619
space. While newborns differentiate among 2D angle shapes given long periods of habituation 620
(Slater, Mattock, Brown, & Bremner, 1991), seven-month-old infants fail to differentiate shapes 621
differing in angle during brief exposures to 2D forms with simultaneous variations in scale, 622
direction, and orientation (Dillon, Izard, & Spelke, in preparation). Research with toddlers has 623
suggested that 3D object recognition undergoes protracted development, with a spurt in the 624
ability to recognize objects by their 3D geometric shapes between the ages of 18-24 months 625
(Augustine, Smith, & Jones, 2011; Smith, 2009), and studies with older children have shown that 626
the period during which we become better able to recognize unfamiliar viewpoints of 3D objects 627
captured in 2D drawings extends to adulthood (Jüttner, Müller, & Rentschler, 2006; Jüttner, 628
Wakui, Petters, Kaur, & Davidoff, 2013; Landau, Hoffman, & Kurz, 2006). Further 629
developmental work, investigating invariances in angle detection may begin to shed light on how 630
such shape representations become more robust to every-day 3D viewing conditions. 631
Even if angle detection in general becomes more robust to rotations in 3D depth through 632
development, such development alone does not explain the emergence of a perpendicular 633
category. A rotationally invariant representation of perpendicularity could be singled out because 634
a perpendicular line is the most symmetrical position for a line relative to another line (i.e., 635
splitting a line in half) or to a plane, and both infants and young children show some sensitivity 636
to symmetry (Bornstein, Ferdinandsen, & Gross, 1981; Huang, Xue, Spelke, Huang, Zheng,
637
Peng, 2018). A rotationally invariant representation of perpendicularity could also derive from 638
representations of the absolute vertical and horizontal. These orientations are robustly 639
represented early in development and across animal species (Appelle, 1972). For example, 5-640
month-old infants take longer to look towards a deviant oblique line among other oblique lines 641
versus among vertically oriented lines the same angle measure away (Franklin, Catherwood, 642
Alvarez, & Axelsson, 2010). 643
Finally, the present study raises questions about the relations between our perception of 644
angles and our conception of formal Euclidean geometry. Euclid famously did not explain what 645
he means by “equal” angles when, at the beginning of his Elements (Book 1, Definition 10), he 646
defines a perpendicular as a line with equal angles to either side as it stands up from a baseline. 647
This definition is strikingly perceptual: We see what he means. Do we need to see the 648
abstractions of geometry to conceive of them? Are they driven by mental imagery of specific 649
spatial exemplars, abstract idealized concepts, or linguistic representations? Indeed, what are the 650
mental representations guiding our geometric reasoning? Individuals differ in their ability to 651
discriminate angles: Might individual differences in our angle discrimination predict our ability 652
to reason about the properties of points, lines, and figures on the Euclidean plane? Could training 653
in angle discrimination cause short- or long-term benefits to geometric reasoning or judgment? 654
We are only just beginning to probe how the human mind navigates the perceptual and 655
conceptual worlds of geometry. 656
657
Author Contributions
658
All authors conceived of and designed the study. M. Duyck programmed the stimuli. M. 659
R. Dillon, M. Duyck, and V. Izard collected the data. M. R. Dillon, M. Duyck, and V. Izard 660
performed the data analysis. M. R. Dillon, M. Duyck, and V. Izard drafted the manuscript, and 661
all authors provided critical revisions. All authors approved the final version of the manuscript. 662
663 664
Acknowledgements
This work was supported by a Starting Grant of the European Research Council to V.I. (FP7 666
Project MathConstruction 263179), by a grant from the National Science Foundation to M.R.D. 667
(DGE-1144152), and by the Norman Henry Anderson Graduate Psychology Fund to M.R.D. 668
669 670
Authors’ Note
671
The full data set and analysis code are available on the Open Science Framework at: 672
https://osf.io/wa64q/. Code for the generation of the experimental stimuli are available upon 673
request. 674
References
676
Amir, O., Biederman, I., & Hayworth, K. J. (2011). The neural basis for shape
677
preferences. Vision Research, 51(20), 2198-2206.
678
Amir, O., Biederman, I., & Hayworth, K. J. (2012). Sensitivity to nonaccidental properties across
679
various shape dimensions. Vision Research,62, 35-43.
680
Anselmi, F., & Poggio, T. (2014). Representation learning in sensory cortex: a theory. Center
681
for Brains, Minds and Machines (CBMM).
682
Anthony, J. L., & Francis, D. J. (2005). Development of phonological awareness. Current
683
Directions in Psychological Science, 14(5), 255-259.
684
Appelle, S. (1972). Perception and discrimination as a function of stimulus orientation: the"
685
oblique effect" in man and animals. Psychological Bulletin, 78(4), 266.
686
Augustine, E., Smith, L. B., & Jones, S. S. (2011). Parts and relations in young children's
shape-687
based object recognition. Journal of Cognition and Development, 12(4), 556-572.
688
Biederman, I., Yue, X., & Davidoff, J. (2009). Representation of shape in individuals from a
689
culture with minimal exposure to regular, simple artifacts: Sensitivity to nonaccidental
690
versus metric properties. Psychological Science, 20(12), 1437-1442.
691
Bornstein, M. H., Ferdinandsen, K., & Gross, C. G. (1981). Perception of symmetry in
692
infancy. Developmental Psychology, 17(1), 82.
693
Cantlon, J. F., Pinel, P., Dehaene, S., & Pelphrey, K. A. (2010). Cortical representations of
694
symbols, objects, and faces are pruned back during early childhood. Cerebral Cortex,
695
21(1), 191-199.
696
Carpenter, R. H. S., & Blakemore, C. (1973). Interactions between orientations in human
697
vision. Experimental Brain Research, 18(3), 287-303.
Chen, S., & Levi, D. M. (1996). Angle judgment: Is the whole the sum of its parts?. Vision
699
Research, 36(12), 1721-1735.
700
Deen, B., Richardson, H., Dilks, D. D., Takahashi, A., Keil, B., Wald, L. L., ... & Saxe, R.
701
(2017). Organization of high-level visual cortex in human infants. Nature
702
Communications, 8, 13995.
703
Dehaene, S., Cohen, L., Sigman, M., & Vinckier, F. (2005). The neural code for written words: a
704
proposal. Trends in Cognitive Sciences, 9(7), 335-341.
705
Dehaene, S., Izard, V., Pica, P., & Spelke, E. (2006). Core knowledge of geometry in an
706
Amazonian indigene group. Science, 311(5759), 381-384.
707
Dillon, M. R., Izard, V., & Spelke, E. S. (in preparation). Infants’ sensitivity to shape changes in 708
2D visual forms. 709
Eimas, P. D., Siqueland, E. R., Jusczyk, P., & Vigorito, J. (1971). Speech perception in
710
infants. Science, 171(3968), 303-306.
711
Euclid. (1990). Great Books of the Western World: The thirteen books of Euclid’s Elements. The
712
works of Archimedes, including The Method. Introduction to Arithmetic by Nicomachus
713
(2 ed.). Chicago: Encyclopedia Britannica. (Original work written c. 300 B.C.E.).
714
Firestone, C., & Scholl, B. J. (2016). Cognition does not affect perception: Evaluating the
715
evidence for “top-down” effects. Behavioral and Brain Sciences, 39, 1-19.
716
Franklin, A., Catherwood, D., Alvarez, J., & Axelsson, E. (2010). Hemispheric asymmetries in
717
categorical perception of orientation in infants and adults. Neuropsychologia, 48(9),
718
2648-2657.
719
Goldstone, R. L., & Hendrickson, A. T. (2010). Categorical perception. Wiley Interdisciplinary
720
Reviews: Cognitive Science, 1(1), 69-78.
Heeley, D. W., & Buchanan-Smith, H. M. (1996). Mechanisms specialized for the perception of
722
image geometry. Vision Research, 36(22), 3607-3627.
723
Howe, C. Q., & Purves, D. (2005). Natural-scene geometry predicts the perception of angles and
724
line orientation. Proceedings of the National Academy of Sciences of the United States of
725
America, 102(4), 1228-1233.
726
Izard, V., Pica, P., Dehaene, S., Hinchey, D., & Spelke, E. S. (2011a). Geometry as a universal
727
mental construction. Space, Time and Number in the Brain, 19, 319-332.
728
Izard, V., Pica, P., Spelke, E. S., & Dehaene, S. (2011b). Flexible intuitions of Euclidean
729
geometry in an Amazonian indigene group. Proceedings of the National Academy of
730
Sciences, 108(24), 9782-9787.
731
Huang, Y., Xue, X., Spelke, E., Huang, L., Zheng, W., & Peng, K. (2018). The aesthetic
732
preference for symmetry dissociates from early-emerging attention to
733
symmetry. Scientific Reports, 8(1), 6263.
734
Jüttner, M., Müller, A., & Rentschler, I. (2006). A developmental dissociation of view-dependent
735
and view-invariant object recognition in adolescence. Behavioural Brain Research,
736
175(2), 420-424.
737
Jüttner, M., Wakui, E., Petters, D., Kaur, S., & Davidoff, J. (2013). Developmental trajectories of
738
part-based and configural object recognition in adolescence. Developmental Psychology,
739
49(1), 161.
740
Kuhl, P. K., Williams, K. A., Lacerda, F., Stevens, K. N., & Lindblom, B. (1992). Linguistic
741
experience alters phonetic perception in infants by 6 months of age. Science, 255,
606-742
608.