1 INTRODUCTION
The study of adhesion of repair materials on concrete structures implies a good knowledge of the influence of concrete surface treatment (Courard 2000). Many authors describe the influence of the surface prepara-tion technique on the superficial cohesion of con-crete (Courard et Bissonnette (a) & Courard et al. 2005) or the adhesion (Silfwerbrand 1990, Pretorius et Kruger 2001 & Courard et al. (b)). However, the effects of surface preparation technique is never clearly described or quantified: it is consequently difficult to point out the real influence of roughness on adhesion results, as this is disturbed by other ef-fect like microcracking or bond coating (Pretorius and Kruger 2001 & Courard et Bissonnette (a)).
A first step was made by using mechanical pro-filometry to differentiate polished and sandblasted concrete surfaces (Courard 1998, Courard and Nélis 2003 & Courard and Garbacz 2004). This technique is very accurate for investigations in laboratory, on a limited surface area. If Quality Control is requested or if it is impossible to core samples from the site, other procedures should be followed. That the reason why optical analysis has been developed(Perez et al. 2003) in order to analyse larger surfaces. The com-parison between the two techniques is presented hereafter.
2 DESCRIPTION OF MATERIALS AND SURFACE PREPARATION
The effect of the concrete removal/preparation tech-nique is most likely dependent upon the nature and the quality of the concrete substrate. The concrete mixture selected to cast the test specimens (sub-strate) for the purpose of this study is a 0.40 W/C micro-concrete (10-mm maximum size aggregate) used as a reference material in many on-going search projects conducted at Laval University in re-lation with repair and rehabilitation (Courard et al. 2005).
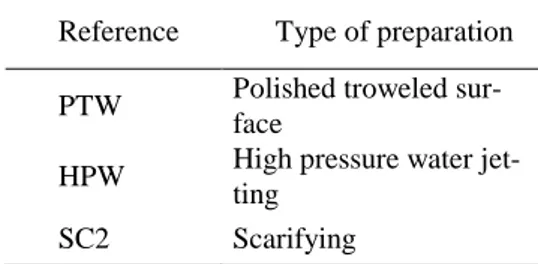
Table 1. Test specimens and surface preparation Reference Type of preparation PTW Polished troweled
sur-face
HPW High pressure water jet-ting
SC2 Scarifying
Three types of surface preparation techniques were investigated (Table 1): scarifying, high pressure wa-ter jetting (18000 psi pressure and 6 gal/h wawa-ter flow) and polishing. Polishing is obtained by means of two abrasive and rotative wearing plates until ob-taining smooth touch surface. The visual observation of the concrete surfaces indicates that the high pres-sure water jetting technique induces a particular
tex-Two different techniques for the evaluation of concrete surface
roughness
L. Courard
GeomaC Department, Université de Liège, Liège, Belgium
F. Perez and B. Bissonnette
CRIB - Civil Engineering Department, Université Laval, Québec, Canada
M. Gorka and A. Garbacz
Institute of Construction Engineering & Management, Faculty of Civil Engineering, Warsaw University of Technology, Poland
ABSTRACT: The study of adhesion of repair materials on concrete structures implies a good knowledge of the influence of concrete surface treatment. The effects of surface preparation technique is rarely clearly de-scribed and parameterised: it is consequently difficult to point out the real influence of roughness on adhesion results. A first step was made by using mechanical profilometry to differentiate concrete surfaces prepared by shot blasting, sand blasting and hand or mechanical milling. This technique is very accurate for investigations in laboratory, on a limited surface area. If Quality Control is requested or if it is impossible to core samples from the site, other procedures should be followed. That the reason why opto-morphometry analysis has been developed, in order to analyse larger surfaces. The comparison of the two techniques shows clearly the advan-tages of each one and the precision that can be achieved.
ture characterized by large waves mostly parallel to the water flow while scarifying will generally induce some oriented macro-roughness (grooved surface); though in this study it was intentionally eliminated by the operator by means of successive transverse and perpendicular operations.
The samples used for mechanical profile investiga-tions (100-mm in diameter) were cored from con-crete blocks specimens. The cores were sawn in two parts (identified a and b), along their main axis.
3 SCALE EFFECT AND ROUGHNESS PARAMETERS
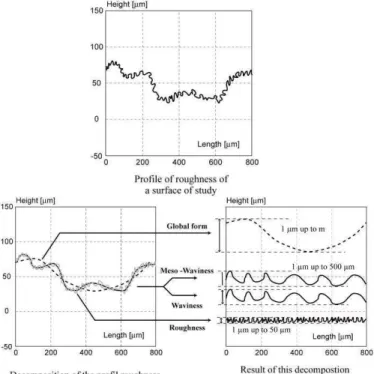
After treatment, concrete surfaces present fractal to-pography. As for any fractal object, it is possible to break up this surface or this profile in a sum of un-der-profiles. Each under-profile can be differentiated in terms of wavelengths; there is however no limit or precise criterion to validate the choice of decomposi-tion method.
Figure 1. Scale effect on profile decomposition
In the two applications presented hereafter, two distinct methods of decomposition are used. Never-theless, they use the same approach principles and they have the same objective. As the two methods have different resolutions, they make it possible to reach complementary scales of topography. The method with mechanical stylus (chapter 4) and high resolution reaches two scales of roughness named: roughness (R) and waviness (W). The optical method, (chapter 5) with a resolution of 0.200-µm,
makes possible to reach two higher scales named meso-waviness (M) and form (F).
A series of parameters make it possible to break up a total wave into two waves. The determination of surface parameters (Table 2) is realised on the ba-sis of the mean line as a reference line (Courard 1998).
Table 2. Profile amplitude and statistic parameters.
Parameter Definition
Xt total height of the profile
Xv maximum depth of the profile (holes) Xp maximum height of the profile (peaks)
Xa arithmetic mean of the deviation of the profile from the mean line
Xq quadratic mean of the deviation of the profile from the mean line
Sk skewness of surface height distribution
Sm mean spacing between profile peaks at the mean line, measured over the assessment length
Another interesting information from surface analysis is the bearing ratio (Courard & Nélis 2003) and the Abbott’s curve (Fig. 2). The surface parame-ters defined on the basis of this curve let us to ana-lyse not only the depth of the holes but also the shape of the profile: CF represents the depth of the profile, excluding high peaks and holes; CL is the relative height of the holes and CR the relative height of the peaks.
Figure 2. Abbott's curve (curve of bearing ratio) and curve pa-rameters.
By definition, calculation of the parameters is real-ized as follows:
CR = H20% - H3%
CF = H70% - H20%
CL = H97% - H70%
The CF parameter gives an idea of the flatness of the surface: the lower it is, the more flat the profile is. Parameter CL gives an idea of the volume of voids, beneath the mean line of the profile, which could be fulfilled by the bond coat or the repair material.
4 EVALUATION OF THE PROFILE ROUGHNESS BY MECHANICAL SURPHOMETRY
The technique has been already described in details (Sherrington and Smith 1988 & Courard and Nélis 2003) and is only here rapidly remembered. A stylus is walked along the surface to be analysed and the profile is continuously registered (Fig. 2).
Figure 2. Stylus walking on the concrete surface.
The total registered profile is filtered in high and low frequencies in order to separate roughness and wavi-ness, respectively (Courard 1998). Filtering will re-duce to 50 % of the initial amplitude of a wave when its wavelength corresponds to the filter characteris-tic.
5 EVALUATION OF THE PROFILE
ROUGHNESS BY OPTO-MORPHOMETRY The projection “moiré” technique is an interfer-ometrical measurement method. The “moiré» phe-nomenon appears when two networks of light rays, made of equidistant lines - alternatively opaque and transparent -, are superimposed. This phenomenon may occur naturally in the everyday life when day-light passes through at least two thicknesses of cur-tains. The networks used are generally transparent, with a transmittance given by square functions. When the network is linear, the fringes take the shape of periodically transparent and coloured cren-els.
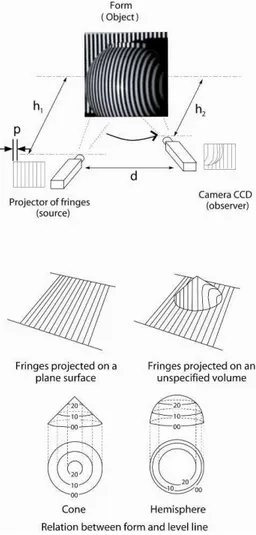
The technique of identification of relief is based on the deformation’s measurement of a parallel fringes pattern projected on a surface (Figure 3). The moiré’s fringes are similar to level lines representing the variations height of the object. By projecting a network of parallel fringes on a plane surface, this network will not be deformed, as shown on Fig. 3.
When projected on an unspecified form, this same network will be deformed according to the level of rise in this form (Fig. 3). Moreover, there is a rela-tion between rise in the form and distance between each level line. The main principle of the test con-sists in the comparison of two images having two different moiré networks. The first image is the im-age reference: it is an imim-age of the network of not deformed parallel fringes. The second image con-tains the projected network deformed according to the analyzed form. An algorithm analyzes the image and compares the grid of calibration and the de-formed grid. This treatment is based on the indices of grey which express the level of color in black and white. The variation of the color is treated like the displacement of this color.
Figure 3. Principles of the Moiré projection technique.
A set of equation can be written to describe this process (Perez 2005). From these equations and with known phase shift values, the phase value and the modulation can be evaluated for every pixel of the image. It is then possible to build a continuous sur-face from the phase’s values.
The measurement accuracy is directly related to the density of the fringes network, and the capacity of differentiation of the network by the system of image analysis. Theoretically, with an illumination angle of 45o and a camera CDD of 512x512-pixels,
the resolution will be approximately 1/5000 of the size of the object. With a camera of 1000x1000-pixels, the resolution is 1/10000 of the size of the object. In our application, the resolution is of 200 µm in the three directions of space for one surface of 350x350-mm (Fig.4). The measurable maximum vertical amplitude could be about 100 mm.
A profile can be divided into several scales of rough-ness. Each scale can be dissociated from the prece-dent by carrying out a decomposition process. Fig. 1 indicates the three principal scales of roughness for the concrete surfaces. Because of the vertical resolu-tion of the device, it is impossible to separate rough-ness from wavirough-ness. A profile obtained through this approach will consequently give the description of meso-waviness and global form. The signal treat-ment is based on the principle of decomposition by wavelets: this type of filtration does not modify sampling, on the contrary of median methods. This is a considerable advantage, knowing that sampling has a major influence to the measurement of fractals surfaces.
Figure 4. Example of setup to obtain optical evaluation.
6 RESULTS
6.1 Mechanical evaluation
A first evaluation by mechanical profilometry has been realized by means of a stylus with diamond sphere radius of 6 µm. The length of measurement was 8 mm and the filter used to separate roughness from the profile was fixed to 0.8 mm. Three profiles were registered on one sample of each kind of prepa-ration; each profile on the sample was made in dif-ferent directions. A second measurement was made with stylus of 79 mm long and a diamond of 1.5 mm radius, in order to point out waviness. The length of the measurement was enlarged to 30mm or more. The filter was again chosen at 0.8mm and the filter to separate shape from the profile was 16mm (two times the dimensions of the aggregates). Observation of the values of the roughness amplitude parameters
(Table 4) clearly shows that Ra, Rq, Rt parameters is between1.5 and 3 times smaller for the polished con-crete profile than for water jetting and scarification, and that the values of amplitude and statistical roughness parameters are equal for water jetting and scarification.
Table 4. Waviness (W) and roughness (R) parameters for me-chanical evaluation (dimension en µm)
Treatment Polishing Water
jet-ting Scarification Wa 6 420 127 Wp 13 1003 346 Wq 9 501 158 Wv 47 923 445 Wt 60 1926 791 Ra 5 14 15 Rq 7 17 19 Rt 70 96 102 CR 4 152 412 CF 10 228 827 CL 14 231 537
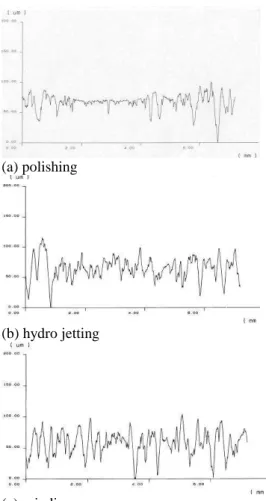
It is here confirmed that the surface treatment technique (Fig.5) has no major influence on the mi-cro-roughness (“high frequencies waves”) of the pro-file. However, the differences are more effectives for waviness parameters.
(a) polishing
(b) hydro jetting
(c) grinding
Figure 5. Roughness profile after different surface treatments
(a) polishing
(b) hydro jetting
(c) grinding
Figure 6. Waviness profile after different surface treat-ments
6.2 Opto-metrical evaluation
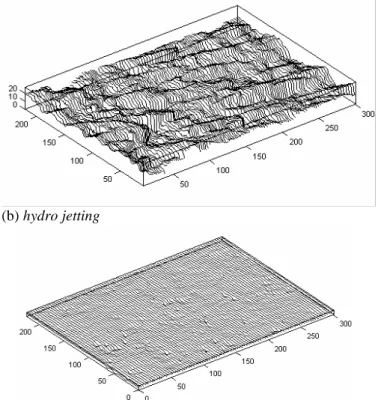
As the same way to mechanical evaluation, 3 opto-metric topography evaluations have been made. The figure 8 presents the statements of the optical measurement. At this scale, water jetting seems to induce the bigger ”roughness”. Polishing and scarifi-cation are quite similar. It’s due to the bubble effect at the surface which gives roughness aspect.
(a) polishing
(b) hydro jetting
(c) Scarification
Figure 7. Meso-waviness profile after different surface treatments (dimension in mm)
Observation of the values of the roughness ampli-tude parameters (Table 5) clearly shows that Ma pa-rameter is 20 times more important for water jetting than for scarification and polishing. At this scale, the others treatments induce smooth surface. Polishing surface is the less rough surface. The major part of apparent roughness of polishing surface comes from the bubble. At this day, it’s not possible to cut off bubble from the meso-waviness.
Table5. Global form (F) and meso-waviness (M) parameters.for opto-metric evaluation (dimension en mm)
Treatment Polishing Water
jet-ting Scarification Fa 0.137 0.358 0.326 Ft 4.1 10.8 12.6 F Sm 129 85.3 102.3 Ma 0.169 2.85 0.315 Mt 19.7 27.8 10.2 M Sm 15.3 36.5 22.5 CR 0.30 4.65 0.41 CF 0.29 5.76 0.55 CL 0.35 5.71 0.81 7 CONCLUSIONS
The use of these two methods to evaluate the pro-files of concrete presents some limitations:
for mechanical technique,
• Stylus : because of the shape of the stylus it is impossible to make measurements on very rough surfaces prepared by hydro-jetting for example; • Air bubbles : some of the air bubbles in concrete
are so large that the stylus falls and the meas-urement is interrupted. That means that the selec-tion of the zone to be investigated is very impor-tant;
• Dimensions: this measurement is very high time consuming and it is the reason why the surface of investigation is limited. Moreover, this system is not usable on site.
for opto-metric technique,
• Vertical resolution: it’s impossible to evaluate micro-roughness and waviness.
• Air bubbles: future version of logarithm will be able to remove bubble effect in order to obtain real roughness.
But the combination of these two methods let us to have a very good description of “roughness” at all scales. The accuracy of the method that is used is fundamental for the quality of the description of the surface.
8 REFERENCES
Courard L., Bissonnette B. and Belair N. 2005. Effect of sur-face preparation techniques on the cohesion of superficial concrete: comparison between jack-hammering and water-jetting.. In: ICCRRR 2005 International Conference on Concrete Repair, Rehabilitation and Retrofitting (Eds. H. Beushausen, F. Dehn and M.G. Alexander), Cape Town, South Africa (21-23 Novembre 2005)
Courard L., Garbacz, A. and Gorka, M. 2004. Concrete surface treatments quantification by means of mechanical profilo-metry. in: ICPIC, XIth International Congress on Polymers in Concrete (Ed. M. Maultzsch, Federal Institute for Mate-rials Research and Testing), Berlin, Germany (2-4 June 2004): 125-132.
Courard, L. and Nélis, M. 2003. Surface analysis of mineral substrates for repair works: roughness evaluation by pro-filometry and surfometry analysis. Magazine of Concrete
Research. 55(4): 355-366.
Courard, L. 2000. Parametric Study for the Creation of the In-terface between Concrete and Repairs Products. Mater.
Struct., 33 (225): 65-72.
Courard, L. 1998. Parametric Definition of sandblasted and polished Concrete Surfaces, in: IXth International Congress on Polymers in Concrete, Bologna, Italy (ICPIC , Ed. P. Sandrolini,): 771-778.
(a) Courard, L. and Bissonnette, B. Quantification of the influ-ence of concrete removal techniques upon residual crack-ing. Concrete International. Sent for publication.
Fukuzawa, K., Mitsui, M. and Numao, T. 2001. Surface rough-ness indexes for evaluation of bond strengths between
CRFP sheet and concrete. In: Xth International Congress on Polymers in Concrete (ICPIC 01, Ed. D. Fowler), Honolulu, Hawaï: p12.
Garbacz, A., Courard, L.,and Gorka, M. On the effect of con-crete surface treatment on adhesion in repair systems.
Magazine of Concrete Research. 57(1):49-60.
Perez, F. 2005. Contribution à l’étude du comportement méca-nique des éléments bicouches composés de bétons d’âges différents sous sollicitations statiques et cycliques. PhD
Dissertation, Université Laval, Département de Génie Civil,
Québec, Canada, 219p.
Perez, F., Bissonnette, B. et Courard, L. 2003. Outils de carac-térisation paramétrique de la rugosité des surfaces en bé-ton : nouveaux développements. In : Journées scientifiques du RF²B, 25-26 août, Sherbrooke, Canada.
Pretorius, J. and Kruger, D. 2001. The influence of surface roughness on the bond strength of concrete repairs. In: Xth International Congress on Polymers in Concrete (ICPIC 01, Ed. D. Fowler), Honolulu, Hawaï: p13.
Sherrington, I. and Smith, E.H. 1988. Modern measurement techniques in surface metrology - Part I: Stylus instruments, electron microscopy and non-optical comparators. Wear 125: 271-288.
Sherrington, I. and Smith, E.H. 1988. Modern measurement techniques in surface metrology - Part II: Optical instru-ments Wea, 125: 289-308.
Silfwerbrand J. 1990. Improving Concrete Bond in repaired Bridge Decks. Concrete International. 12 (9): 61-66.
9 ACKNOWLEDGMENTS
The authors express their sincere appreciation to Professor J. Bozet, Head of the Mechanical Engi-neering and Tribology Department and M. Nélis, Research Engineer, for the opportunity to use the SURFASCAN test device. The authors are also thankful to Micha Gorka, Master Student at the Technical University of Warsaw, for his assistance in making tests. The research project was financially supported by the Government of Québec (MRI), Canada and the Regional Government of Wallonia (DRI), Belgium.