HAL Id: hal-01837510
https://hal.archives-ouvertes.fr/hal-01837510
Submitted on 26 May 2020
HAL is a multi-disciplinary open access archive for the deposit and dissemination of sci-entific research documents, whether they are pub-lished or not. The documents may come from teaching and research institutions in France or abroad, or from public or private research centers.
L’archive ouverte pluridisciplinaire HAL, est destinée au dépôt et à la diffusion de documents scientifiques de niveau recherche, publiés ou non, émanant des établissements d’enseignement et de recherche français ou étrangers, des laboratoires publics ou privés.
Magdalena Kristiawan, Valerie Micard, Priscilla Maladira, Christine
Alchamieh, Jean-Eudes Maigret, Anne-Laure Réguerre, M.A. Emin, Guy
Della Valle
To cite this version:
Magdalena Kristiawan, Valerie Micard, Priscilla Maladira, Christine Alchamieh, Jean-Eudes Maigret, et al.. Multi-scale structural changes of starch and proteins during pea flour extrusion. Food Research International, Elsevier, 2018, 108, pp.203-215. �10.1016/j.foodres.2018.03.027�. �hal-01837510�
Version postprint
Multi-scale structural changes of starch and proteins during pea
flour extrusion
M. Kristiawan, V. Micard, P. Maladira, C. Alchamieh, J.-E.
Maigret, A.-L. Réguerre, M.A. Emin, G. Della Valle
PII:
S0963-9969(18)30203-5
DOI:
doi:
10.1016/j.foodres.2018.03.027
Reference:
FRIN 7464
To appear in:
Food Research International
Received date:
5 January 2018
Revised date:
7 March 2018
Accepted date:
9 March 2018
Please cite this article as: M. Kristiawan, V. Micard, P. Maladira, C. Alchamieh, J.-E.
Maigret, A.-L. Réguerre, M.A. Emin, G. Della Valle , Multi-scale structural changes
of starch and proteins during pea flour extrusion. The address for the corresponding
author was captured as affiliation for all authors. Please check if appropriate. Frin(2018),
doi:
10.1016/j.foodres.2018.03.027
This is a PDF file of an unedited manuscript that has been accepted for publication. As
a service to our customers we are providing this early version of the manuscript. The
manuscript will undergo copyediting, typesetting, and review of the resulting proof before
it is published in its final form. Please note that during the production process errors may
be discovered which could affect the content, and all legal disclaimers that apply to the
journal pertain.
Version postprint
ACCEPTED MANUSCRIPT
Multi-scale structural changes of starch and proteins during pea flour extrusion1
*M. Kristiawan, 2V. Micard, 1,2P. Maladira, 1C. Alchamieh, 1J.-E. Maigret, 1A.-L. Réguerre, 3M.A. Emin, and 1G. Della Valle
1
INRA, UR 1268 Biopolymers Interactions and Assemblies (BIA), 44316 Nantes, France
2
Montpellier SupAgro-INRA-UM-CIRAD, JRU IATE 1208, 34060 Montpellier, France
3
Karlsruhe Institute of Technology, Institute of Process Engineering in Life Sciences, 76131 Karlsruhe, Germany
Version postprint
ACCEPTED MANUSCRIPT
AbstractDehulled yellow pea flour (48.2% starch, 23.4% proteins, d.b.), was processed by a twin-screw extruder at various moisture contents MC (18-35% w.b.), product temperature T (115-165°C), and specific mechanical energy SME (50-1200 kJ/kg). Structural changes of extruded pea flour were determined at different scales by measurements of density (expansion), crystallinity (X-ray diffraction), gelatinisation enthalpy (DSC), starch solubility in water and protein solubility in SDS and DTE (SE-HPLC). Foam density dropped from 820 to 85 kg/m3 with increase in SME and T (R2>0.78). DSC and XRD results showed that starch was amorphous whatever extrusion conditions. Its solubility in water augmented up to 50%. Increasing temperature from 115 to 165°C decreased proteins soluble in SDS from 95 to 35% (R2=0.83) of total proteins, whereas the proteins soluble in DTE increased from 5 to 45% (R2=0.75) of total proteins. These trends could be described by sigmoid models, which allowed determining onset temperatures for changes of protein solubility in the interval [125, 146°C], whatever moisture content. The SME impact on protein solubility followed similar trends. These results suggest the creation of protein network by S-S bonds, implicating larger SDS-insoluble protein aggregates, as a result of increasing T and SME, accompanied by creation of covalent bonds other than S-S ones. CSLM images suggested that extruded pea flour had a composite morphology that changed from dispersed small protein aggregates to a bi-continuous matrix of large protein aggregates and amorphous starch. This morphology would govern the expansion of pea flour by extrusion.
Keywords
Composite morphology, expansion, protein aggregates, solid foam, solubility
Abbreviations and nomenclature
a, b, b1, b2, k, m, Tc parameters in fitting equations
a* one of three coordinates of CIE color space which represents redness
b* one of three coordinates of CIE color space which represents yellowness
CSLM confocal laser scanning microscopy
d.b. dry basis
DTE dithioerythritol
DSC differential scanning calorimetry
GMO genetically-modified organism
L* one of three coordinates of CIE color space which represents lightness
LEI longitudinal expansion index
Δ𝐻𝑢 melting enthalpy per mole of monomer unit (or anhydroglucose) (in kJ/mol)
MC moisture content, in wet basis
Version postprint
ACCEPTED MANUSCRIPT
N screw speed (rpm)
Nmax maximum screw speed (rpm)
p significance level
Pmax maximum power (kJ)
PPA Acriflavine-Schiff reagent for starch staining
Q total mass flow rate (kg/h)
QF mass flow rate of pea flour (kg/h)
QW mass flow rate of water (kg/h)
R gas constant (8.31×10⁻³ kJ/mol.K)
Si SDS-soluble proteins fractions (%) with i represents i th
fractions
SDS sodium dodecyl sulphate
SE-HPLC size-exclusion high-performance liquid chromatography
SEI sectional expansion index
Sol. protein solubility
SME specific mechanical energy (kJ/kg)
T product temperature (°C), measured at the end of extruder
Tdie imposed die temperature (°C)
Ti temperature at the onset of starch and protein changes (°C)
Tm melting temperature of starch (°C)
𝑇𝑚° melting temperature of anhydrous starch (in K)
v1 water volume fraction (dimensionless)
Vu molar volume of the monomer unit (dimensionless)
V1 molar volume of water (dimensionless)
VEI volumetric expansion index
WAXS wide angle X-ray scattering
WAI water absorption index (in % dry powder)
w.b. wet basis
WSI water solubility index
WSIsolids WSI of total solids (in kg/kg dry flour)
WSIstarch WSI of starch (in kg/kg dry starch in flour)
XRD X-ray diffraction
Ø diameter
*
density of extrudates (kg/m3)
2 scattering angle (°)
τ measured torque (in % of maximum torque)
τempty measured torque when extruder is empty (in % of maximum torque)
Version postprint
ACCEPTED MANUSCRIPT
1. IntroductionPulse legumes (pea, lentil, faba bean) are excellent source of proteins (20-30% dry basis), dietary fibers (10-30%), starch (40-55%), vitamins and minerals, and they are low in sugar, sodium and fat (El-Adawy, Rahma, El-Bedawey, & El-Beltagy, 2003). Pulse proteins are relatively high in lysine and low in sulphur-containing amino acids: cysteine, methionine, and tryptophan (Leterme, Monmart, & Baudart, 1990). Combination of pulse proteins with low-lysine cereal proteins allows a nutritional adequate protein profile. The formulation of gluten-free extruded snacks made entirely from pulse legumes is also an interesting way to introduce pulse to modern consumers demanding vegan, gluten free, non-GMO and protein enriched functional foods.
Extrusion is one of the most versatile and efficient food processing technique used in preparation of starch based foods and especially to process protein-fortified extrudates (Day & Swanson, 2013). After melting, the viscous material is forced through a die where the vapour expands the material to a porous structure. Texture properties of extruded products, envisioned like solid foam, depend not only on density and cellular structure but also on the mechanical properties of the material which constitutes the cell walls of the foam. These properties depend on the morphology of the cell wall material created during extrusion under high temperature and shear. These conditions lead to many biopolymer transformations: starch melting, depolymerisation, protein denaturation, browning, and destruction of anti-nutritional components. With increasing temperature, molecular changes in proteins take place in several steps: association, dissociation, and aggregation of subunits by non-covalent (hydrophobic, ionic, H) and non-covalent (disulphide, isopeptide) bonds (Stanley, 1989). In the case of extrusion of soy and pea protein isolates, the increasing shear energy promotes protein unfolding resulting in protein re-association (Della Valle, Quillien, & Gueguen, 1994; Fang, Zhang, Wei, & Li, 2013). Besides, moisture content probably increases the mobility of proteins and their cross-linking (Holay & Harper, 1982).
The knowledge about the bonding forces involved in protein changes during extrusion was generally deducted from experiments on protein solubility of extrudates in selective reagents capable to disrupt specific bonds. Most of the studies on legume protein solubility have focused on high moisture extrusion (>50% w.b.) producing meat analogues from soy and pea protein isolates. Recent studies show that the meat analogue structuring is more related to thermodynamic incompatibility, which could be induced by protein-protein interactions (Tolstoguzov, 2016).
Most studies on expanded snacks, made from legume proteins extruded at lower moisture (<25% w.b.), focused mainly on the effect of extrusion variables on density, expansion and functional properties using black box modelling for optimizing. Studies on the changes of protein structure and solubility were performed after extrusion, generally in a narrow extrusion domain, and did not involve macroscopic features like expansion (Alonso, Orue, Zabalza, Grant, & Marzo, 2000; Ben-Hdech,
Version postprint
ACCEPTED MANUSCRIPT
Gallant, Bouchet, Gueguen, & Melcion, 1991; Della Valle et al., 1994; Gujska & Khan, 1991). More recently, protein aggregations have been studied on pulse legume based pasta extruded at moisture content between 30 and 35% (w.b.) and low temperature (<100°C) (Laleg et al., 2017). However pasta are not expanded product. The diversity of protein sources and processing conditions make the comparison of results difficult and sometimes contradictory. Published results about the effect of protein content on sectional expansion index (SEI) showed both negative and positive impact. Paton & Spratt (1984) found that for extrusion of gluten-wheat starch blend (moisture content MC 21%, 163°C, 50 rpm), the SEI increased from 3 to 5 when adding 10% gluten. Conversely, for extrusion held at the same level of MC but higher mechanical energy (230 rpm), De Mesa et al. (2009) found that an addition of 5-20% soy protein concentrate into corn starch decreased SEI from 17 to 7. The increase of protein content from 6 to18% during extrusion of pea flour (MC 21%, 120°C) resulted in SEI drop from 7 to 2 (Hood-Niefer and Tyler, 2010). The effects of extrusion variables on mechanism of protein transformations and, consequently, on multi-scale structure of legume based starch-protein matrices are still not well understood. Depending on operating variables of extrusion, destructured starches and insoluble protein aggregates can form a melt with various morphologies. In turn, the morphology affects expansion and functional properties (i.e. foam texture) through the change of melt rheology.
The first objective of this work is to ascertain the effect of biopolymer transitions on the structure of extruded pea flour. The structure was studied at two levels: (1) the cell walls of foams constituted by starch-protein blends, and (2) the overall expansion. Second objective is to determine the relationship between extrusion variables, product structure, and material transformations on a mechanistic basis. A wide range of extrusion conditions was selected and resulting products were thoroughly analysed at different levels of matter organization.
2. Materials and methods
2.1 Raw materials
Dehulled yellow split pea grits was obtained from Sotexpro (France). The pea (variety Karpate) was harvested in spring 2016. The pea grits were ground by a miller (Sarl Giraud, France) in order to obtain pea flour with median diameter of about 480µm.
2.1.1 Chemical composition (in dry basis)
Total crude protein content of pea flour was obtained using Kjeldahl procedure with a nitrogen-to-protein conversion factor of 6.25. Total starch content was determined with an enzymatic assay kit (Megazyme, Co., Ireland). Ash content was determined by incineration at 900 °C for 2h according to the French standard (NF 03-720). Total lipids were extracted according to method of Folch et al. (1957). All measurements were conducted in triplicate. The reported values are averages
Version postprint
ACCEPTED MANUSCRIPT
with relative standard deviation lower than 5%. Fibre content was calculated by subtraction of average content (% d.b.) of ash, fat, protein and starch from total chemical content.
2.2 Extrusion trials
Pea flour was extruded using a laboratory scale co-rotating twin-screw extruder (Coperion Werner & Pfleiderer ZSK 26Mc). The screw diameter was 25.5mm. The barrel was divided into 7 sections with a total length of 740mm. During the experiments, each barrel section, except the first one, was heated separately to 40, 60, 80, 90, 90, and 90°C. The raw material was fed by a gravimetrically controlled feeder (Brabender DDW-DDSR 40). Water was added into the second barrel by a volumetric pump. The screw profile included (i) conveying elements with decreasing pitch from 36 to 24mm, (ii) followed by three 45° kneading discs (length of 12mm each) located inside the fourth barrel, (iii) three reverse elements having pitch and length of 12 mm located inside the fifth barrel, (iv) conveying elements having pitch of 24mm. This geometry assured (i) homogeneous mixing of flour and water at the inlet (ii) melting dough completely in the stagnant area generated by reverse elements and (iii) conveying the molten phase to die.
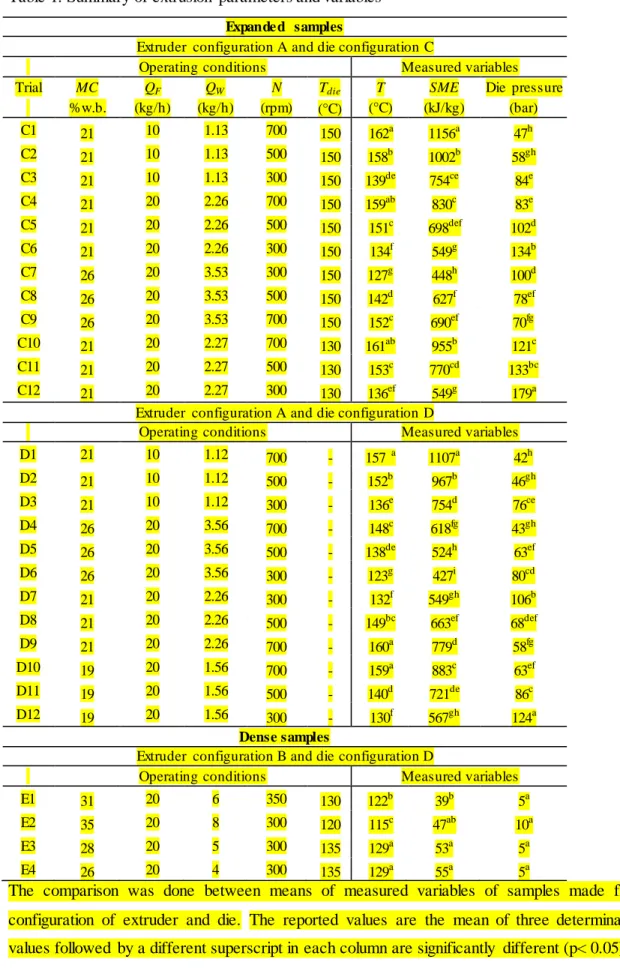
In order to obtain extrudates having a wide range of structures and biopolymer transformations,a large domain of operating parameters was applied: moisture content 18–35% w.b., screw speed 300–700 rpm, total feed rate 10–25 kg/h, extruder configuration with (A) and without (B) restrictive elements, and imposed die temperature 130–150°C. Two die geometries were used: die C consisted of a long slit die (thickness 3mm, width 15mm, length 72mm) followed by an orifice die (Ø 3mm, length 15mm), die D consisted of an orifice die mounted directly to the extruder head without slit die. Extrusion parameters are summarized in Table 1. The interval of variations of these parameters was chosen by numerical screening using a twin-screw simulation software Ludovic® (Vergnes, Della Valle, & Delamare, 1998), in order to cover a wide range of extrusion variables, such as product temperature 115–165°C and specific mechanical energy (SME) 40–1200 kJ/kg. In addition, the knowledge of pea starch melting temperature at various moisture contents was used for setting extrusion conditions to obtain extrudates with amorphous starch mainly under low SME (< 100 kJ/kg) (Logié, Della Valle, Rolland-Sabaté, Descamps, & Soulestin, 2018).
In particular, experiments using relatively high moisture content (between 26 and 35%) were performed to produce dense material samples (low expansion) that can be considered as the constitutive material (“parietal material”) of the pea flour foams (expanded samples). Die pressure and product temperature were measured just in the last section of the extruder with an accuracy of +0.25% and +0.5°C, respectively. Specific mechanical energy (SME, kJ/kg) was calculated from screw speed, measured torque and power as follows:
𝑆𝑀𝐸 = 𝑁 𝑁𝑚𝑎𝑥× 𝜏−𝜏𝑒𝑚𝑝𝑡𝑦 100 𝑄 × 𝑃𝑚𝑎𝑥 × 3600 (1)
Version postprint
ACCEPTED MANUSCRIPT
where N and Nmax are the actual and maximum screw speed (Nmax = 1800 rpm), τ and τempty are the
actual and empty measured torque . The maximum power of extruder Pmax is 40 kW. Q is the total
mass flow rate (kg/h).
The extrudates were dried under vacuum at 40°C overnight in order to get final moisture content less than 10% w.b. and stored in airtight plastic bags at room temperature. A part of each extrudate was ground into a fine powder using a grinder (M20, IKA Werke GmbH & Co., Germany). The ground samples and pea flour were sieved to pass a 250 µm mesh and conditioned at a relative humidity of 59% at 20°C for two weeks.
2.3 Product analysis
2.3.1 Density and sectional expansion index
Extrudate density reflects overall or volumetric expansion expressed by the index VEI ≈ melt density / extrudate density. Volumetric expansion results from radial and longitudinal expansions, each term being assessed by a specific index (Kristiawan, Chaunier, Della Valle, Ndiaye, & Vergnes, 2016). Longitudinal expansion index (LEI) characterizes the expansion in die flow direction, whereas radial or sectional expansion index (SEI) refers to the increase of cross section in the plane orthogonal to flow direction. The three indices are linked by the relationship:
𝑉𝐸𝐼 = 𝐿𝐸𝐼 × 𝑆𝐸𝐼 (2)
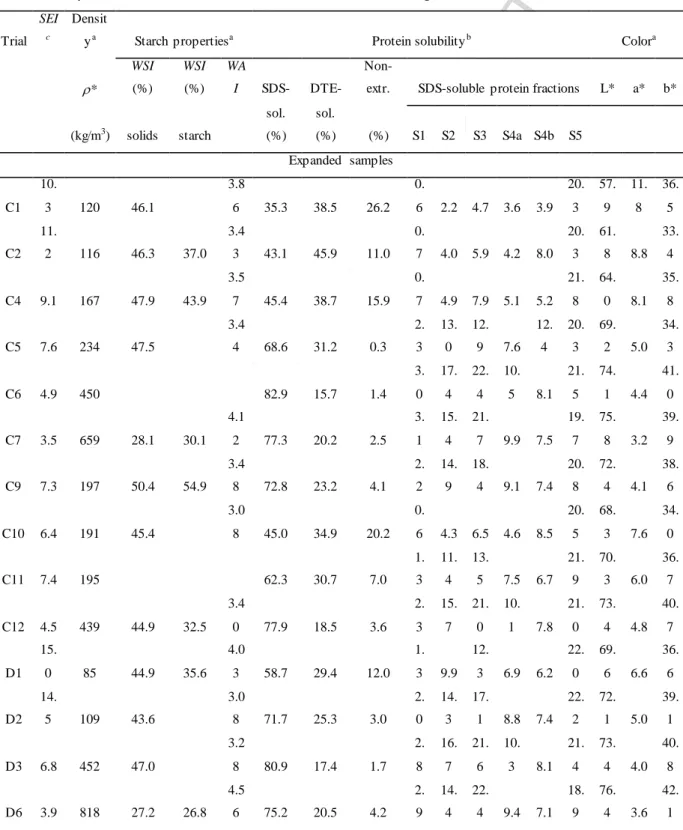
In this work, macro structure of extrudates was characterized by density and SEI. The bulk density was obtained using glass beads displacement method. The extrudate density (ρ*) was calculated from the mass of extrudate and its volume measured through the displacement of glass beads (Ø 1mm). The reported values (Table 2) were the averages of three repetitions (relative error 10%). The SEI was calculated as the ratio of cross-sectional area of extrudate to that of die. For each sample, diameter was measured at five random positions on each of seven pieces of extrudates. The reported SEI values were the averages of these thirty-five measurements (relative error 15%).
2.3.2 Starch transformation Melting transition
Pea flours with various moisture contents (5 to 35% wet basis) were prepared under controlled relative humidity of 11 to 97% over saturated salts at 20°C for 1-2 weeks. DSC Q10 (TA Instrument, France) was used for melting point analysis following the method of Barron et al. (2000). The samples were heated from 25 to 180°C at a heating rate of 3°C/min. Melting temperature (Tm) was defined as
the offset temperature of endothermic peak. The measurements were done in duplicate (relative error 10%).
Version postprint
ACCEPTED MANUSCRIPT
The degree of starch transformation (crystallinity loss and granular disorganization) was determined by duplicate measurements of DSC gelatinization enthalpy of extrudates, in excess water, compared to untreated pea flour. Absence of residual gelatinization enthalpy means that starch is amorphous. The DSC scans were run at 3°C/min from 10 to 120°C.
Crystallinity state by WAXS
The loss of crystallinity was also examined using a wide angle x-ray scattering analysis (WAXS) (Barron et al., 2000). The analysis was performed using a Bruker D8 diffractometer (Bruker AXS Inc., USA) equipped with a copper source operating at 40 kV and 40 mA.
Water Solubility Index (WSI) and Water Absorption Index (WAI)
Water solubility index of total solids (WSIsolids) and water absorption index (WAI) of flour and
ground extrudates were determined using the method of Anderson et al. (1970). Mass of 2.5 g of samples was dispersed in 30 ml of distilled water, then agitated at 30°C for 30 min and finally centrifuged at 3000 g for 10 min at 20°C. The supernatant was dried overnight in a Chopin oven at 105°C. WAI was calculated as the ratio of mass of wet pellet to dry original sample. WSIsolids was
determined as the percentage of mass of supernatant dry solid to dry original sample.
For determining WSI of starch (WSIstarch), the samples underwent firstly the same extraction
and centrifugation procedure as described before. Thereafter, the supernatant was titrated with orcinol in an automatic spectrocolorimeter, according to the method of Tollier and Robin (1979).
The measurements of WSI and WAI were carried out in triplicate (relative error 15%).
2.3.3 Protein transformation Procedure of protein extraction
Proteins were extracted using a method adapted from Morel et al. (2000). Samples underwent two successive extractions. The first stage, aiming to extract SDS-soluble proteins, was conducted at 60°C for 80 min with a sodium phosphate buffer containing 1% of sodium dodecyl sulphate (SDS, 0.1 M) with a solid-to-solvent ratio of 8 mg/mL. SDS disrupts the electrostatic, hydrophobic and hydrophilic interactions between proteins. After centrifugation, 1 mL of the supernatant was analysed on size distribution using SE-HPLC. During the second extraction, the pellet was suspended in a 5mL of the SDS-phosphate buffer containing 20 mM of dithioerythritol (DTE) at 60°C for 60 min, sonicated for 5 min and centrifuged. The supernatant, referred as DTE-soluble proteins, was sampled for SE-HPLC analysis. The combination of sonication and DTE causes disruption of disulphide bonds. The remaining pellet made of non-extractable proteins represents proteins linked by other covalent bonds than S-S ones (e.g. isopeptides bonds). Protein solubility (%) in a specified reagent (SDS or DTE) is expressed as the percentage of integrated area to that of all extractable proteins of a
Version postprint
ACCEPTED MANUSCRIPT
reference sample D8. As explained in detail later, D8 has been chosen because it has maximum total extractable proteins.
Measurement of molecular weight distribution of proteins aggregates
The size distribution of protein aggregates in the extracts was studied by Size-Exclusion High-Performance Liquid Chromatography (SE-HPLC). The SE-HPLC apparatus (Waters LC Module1 plus) was equipped with an analytical column TSK G4000-SW, 7.5 x 300 mm (Merck, France) and a guard column TSK G3000-SW, 7.5 x 75 mm (Merck, France). Apparent molecular weights were determined in the column calibrated with protein standards (Redl, Morel, Bonicel, Vergnes, & Guilbert, 1999). Once corrected for their different solid-to-solvent ratios, the integrated areas of SDS-soluble and DTE-SDS-soluble proteins of samples were expressed as percentage of the total area of the reference sample D8 giving the maximum total extractable proteins. The solubility experiments were duplicated (relative error 5%).
2.3.4 Color measurement
Color changes of ground samples (sieved between 250 and 500µm) were assessed by measurement of CIE Lab color space (L*, a* and b*) using a chromameter (Konica Minolta CR-400) with a standard illuminant D65 (natural daylight), and an observation angle of 2°. L* stands for lightness black-white (0, 100), a* and b* for color opponents green-red (-100, +100) and blue-yellow (-100, +100), respectively. Color measurements were done in triplicate (relative error 1%). These color changes could reflect Maillard reactions occurring between reducing sugars and free amine groups due to thermo-mechanical treatment.
2.3.5 Morphology of starch-protein blends
Confocal laser scanning microscopy (CLSM) was used to locate the starch/protein phases in the constitutive material of extruded samples. The extrudates were cut perpendicularly and embedded in paraffin using a method adapted from Ben Hdech et al. (1991). The slices of 10 µm were then cut using a rotary microtome. Starch was stained red with oxidation in periodic acid solution followed by coloration with Acriflavine-Schiff reagent, called as PAA staining. Proteins were stained green with 0.01% (w/v) Fuchsine Acid in 1% (v/v) acetic acid (Chanvrier, Colonna, Della Valle, & Lourdin, 2005). Images were acquired using a confocal laser scanning microscope (Nikon A1) with attached NIS imaging system (Nikon, Germany). Samples were examined in the epifluorescence mode of the microscope, excited by a green laser beam at 561nm for Fuchsine Acid stain and at 488nm for PAA stain. The emitted light was selected by a long-pass filter (>570nm). Three-dimensional images of samples were obtained by observing 20 planes of 1µm thick, every 1µm. Each image corresponds to the projection of these 20 planes of a sample area of 318 x 318 µm2.
Version postprint
ACCEPTED MANUSCRIPT
2.4 Statistical analysis
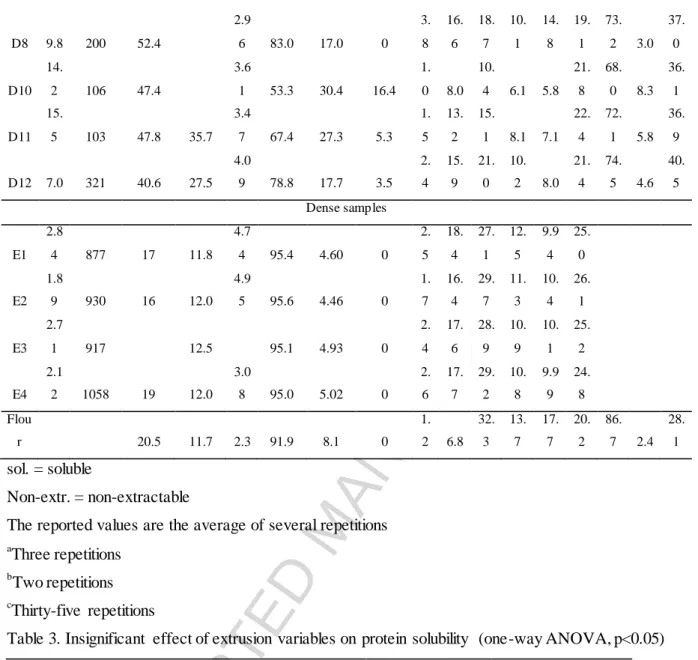
The significant difference between means of measured extrusion variables (Table 1) within a grouped samples extruded using same extruder and die configuration was determined by analysis of one-way ANOVA and Fisher’s least significant different (LSD). Analysis of one-way ANOVA was also conducted to determine effect of several levels of extrusion variables on protein solubility (Table 3). All statistical analysis were performed at 5% significance level using Microsoft Excel 2010.
3. Results and discussion
Native pea flour contained three major components: starch (46.3% d.b.), proteins (23.9% d.b.). The minor components were ash (2.1% d.b.) and lipids (2% d.b.). The chemical composition was in the range determined by Li & Ganjyal (2017) for five varieties of yellow peas. The resulting fiber content was 25.7% (d.b.).
3.1 Flour melting, extrusion and expansion
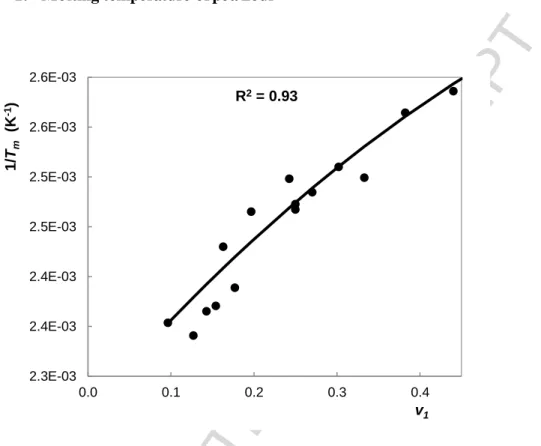
The measured melting temperature of pea flour Tm was 118°C (MC = 20% w.b.), defined as
the temperature at peak offset, was slightly higher than those found by Li & Ganjyal (2017) in the interval [108, 113°C]. Variation of melting temperature of pea flour with water volume fraction, was fitted by Flory-Huggins equation, R2 = 0.93 (Appendix, Eq. A1, Fig. A1).
Extrusion parameters and variables are summarized in Table 1. The selected processing conditions, using screw configuration A, resulted in a wide domain of extrusion variables: product temperature T varied between 120 and 165°C, MC between 18 and 26%, and SME between 400 and 1200 kJ/kg (Fig. 1a). The most severe extrusion conditions values corresponding to highest temperature and SME were obtained for sample C1 with low moisture content (21.4%). Conversely, samples E1-E4 were processed at lower temperature (<130°C) and low SME (<100 kJ/kg) using screw configuration B and larger MC (≥26%). Under all conditions, product temperature at the die T was higher than Tm. The extrusion domain exceeded that covered in the previous studies on pea extrusion
(Berrios, Tang, & Swanson, 2008; Hood-Niefer & Tyler, 2010; Li, Kowalski, Li, & Ganjyal, 2016; Maskus & Arntfield, 2015).
Fair correlation (R2=0.74) between T and SME was found, whatever the values of other variables (Fig. 1a). Indeed, higher T and SME values were obtained for lower MC. This general trend, which has not been underlined yet for legume extrusion, is common to starchy products. It is due to the influence of solid friction between flour particles and viscous dissipation in the molten phase (Colonna, Tayeb, & Mercier, 1989).
The SME effect on the proteins transformation is complex. The heat due to viscous dissipation can enhance the polymerisation whereas shear causes depolymerisation. Therefore, it is interesting to find how to control SME by processing parameters. This is illustrated in Fig. 1b, where SME was plotted as a function of the ratio of total flow rate to screw speed, Q/N, which is proportional to the
Version postprint
ACCEPTED MANUSCRIPT
filling ratio of screw for a given screw configuration. Good correlation (R2=0.86) between SME and
Q/N was obtained for the screw configuration involving reverse elements, whatever MC and die
geometry. The same trend was observed in the case of twin-screw extrusion of starchy products: SME increases when screw speed increases and decreases when feed rate is inc reased (Meuser & Wiedmann, 1989). Obviously, the SME depends on screw filled length, which changes with screw configuration.
In the applied domain of thermomechanical conditions, the density varied in a large interval (85-1060 kg/m3, Table 2). Samples extruded with the configuration B (no restrictive elements) were not expanded, likely because of low temperature and SME. They are called dense samples. Extruded samples with density lower than 200 kg/m3 had similar aspect to directly expanded starchy snacks or foams. Higher expansion is generally preferable because it favours the obtaining of lighter and crispier products.
Density was negatively correlated with product temperature (T) (R2=0.77, Fig. 2a). The same trend was observed for SME (R2=0.80 result not shown). On the other hand, MC was correlated positively with foam density (R2>0.75 result not shown).
Foam density was inversely related to sectional expansion index (SEI) (R2=0.91) for any die geometry (Fig. 2b). This general trend that is known for starchy product extrusion has not been evidenced yet for legumes. Calculation of longitudinal expansion index using Eq. (2), LEI = VEI / SEI, led to LEI values lower than 1 for all pea extrudates. Hence, the volumetric expansion was governed by radial expansion. This result is different from that obtained for starch melts, where increasing die length favoured longitudinal expansion (Kristiawan et al. 2016).
The impact of extrusion variables (MC, T, SME) on pea flour expansion was the same as on proteinaceous products including legumes (Berrios et al., 2008; Li et al., 2016). However, contrary to starch expansion, the effect of product temperature on pea flour expansion was positive and large (Fig. 2a). Indeed starch expansion is governed by different mechanisms: nucleation, water vaporization, growth, coalescence and shrinkage of gas bubbles in a homogeneous viscous fluid. The influence of temperature on these mechanisms result in opposite effects on final expansion, and thus on density (Kristiawan et al., 2016). The positive influence of temperature on expansion of pea flour by extrusion, suggests that this phenomenon is not only govern by these mechanisms, but also by rheological changes of material structure linked to the morphology of starch-protein composites. Unlike starch melt, pea flour melt cannot be considered as a fully homogenous viscous fluid, this will be discussed in the later discussion about the morphology of parietal material of extrudates (section 3.4).
3.2 Protein modifications
Proteins in native flour consisted of a high fraction of SDS-soluble proteins (91.9%), a low fraction of DTE-soluble proteins (8.1%), and no traces of non-extractable proteins. This indicates that
Version postprint
ACCEPTED MANUSCRIPT
proteins were mainly linked by non-covalent interactions and less by disulphide bonds. Pea proteins were mainly composed of salt-soluble globulins (45-60%) and water-soluble albumins (14-30%), with minor acid/alkali soluble-glutelins and alcohol-soluble prolamines, which explains the high solubility in SDS. The low content in protein DT-soluble can be explained by the poor content of native flour in sulphur containing amino acids such as methionine and cysteine which are able to produce disulphide bonds (Leterme et al., 1990).
According to SE-HPLC elution profile (Fig. 3), SDS-soluble extract was divided into six major fractions: S1 (1.2%), S2 (6.8%), S3 (32.3%), S4a (13.7%), S4b (17.7%), and S5 (20.2%). Pea flour consisted mainly of proteins with intermediate and small sizes having molecular weights ranging from 41 to 91 kDa (S3) and from 9 to 24 kDa (S5) (Barac et al., 2010; Mession, Sok, Assifaoui, & Saurel, 2013). Albumin 2 (5-80 kDa) can contribute to S3, S4 and S5 fractions. Some of pea globulins (150-420 kDa), i.e. the convicilin (~290 kDa) and vicilin (~170-180 kDa), make a part of S2. Legumins are hexameric proteins with subunit linked by disulphide bonds, 300-420 kDa, which contribute to S2, and Albumin 1 (cysteine-rich peptide, ~10 kDa) is part of S5.
Protein solubility of dense samples (E1-E4), extruded at low temperature and SME values was close to that of the native flour (Table 2). With increasing product temperature, beyond 140°C, SDS-soluble proteins decreased from 95% to 35% (R2=0.83) (Fig. 4a). Conversely, DTE-soluble proteins increased from 5% to 45% with temperature (R2=0.75). Given the strong correlation between SME and
T, the same trends were observed on variations of protein solubility with SME (result not shown). This
result indicated the formation of SDS-insoluble protein aggregates via protein cross-linking by disulphide bonds, which was confirmed by the negative correlation between solubility in SDS and DTE (R2=0.93, result not shown). The best fitting for solubility variations with temperature was obtained using the sigmoid function (see Fig. 4a, R2≥0.75):
Sol. = a/(1 + exp(-k(T-Tc))) (3a)
where Sol. is the solubility (in SDS, DTE…), T is the material temperature measured inside the die and
Tc is the temperature at inflexion point, and a and k are the parameters in sigmoid model (Appendix 3),
with
Sol(Tc) = a/2 (3b)
and k is linked to the rate and magnitude of solubility change:
Version postprint
ACCEPTED MANUSCRIPT
Numerical values of these parameters are summarized in Appendix (Table A1). Onset temperature of the events governing the variation of protein solubility, Ti, was found using the sigmoid model, see
Appendix 3. The loss of protein solubility in SDS started at 146°C, while the onset of formation of DTE-soluble proteins occurred at 125°C. The variation of solubility with SME could be fitted with a similar sigmoid function (result not shown). By subtracting SDS and DTE-soluble proteins from the total protein content in samples (100%), the fraction of non-extracted proteins was found. It resulted from the formation of aggregates linked by other covalent bonds than S-S. This fraction could reach up to 26 % (sample C1, Table 1). Formation of these bonds started massively at a temperature close to 152°C.
The impact of material temperature on size distribution of SDS-soluble proteins of extrudates is illustrated by the variation of fractions identified by SE-HPLC (Fig. 4b). Increasing material temperature led to a marked decrease in the SDS solubility of S1, S2, S3 and S4a fractions following Eqs. (3) (R2>0.85, Fig.3). The model parameters are reported in Appendix, Table A1. Conversely, ANOVA analysis showed that protein fraction of S4b and S5 did not vary significantly with temperature (Table 3) and they took average values close to 8.2 and 21.8 %, respectively. Each protein fraction had different onset temperature for solubility change, S1 and S2: 151°C, S3: 135°C, and S4a: 147°C, and SME in the range 550-600 kJ/kg. These values are closed to those for the formation of protein aggregates linked by S-S (125°C; 625 kJ/kg) and other covalent bonds (152°C, 550 kJ/kg) (Fig. 4a). As expected, the SDS solubility of S3, S3 and S4a fractions decreases with increasing DTE-soluble and non-extractable proteins, which shows that these fractions become inDTE-soluble with the formation of S-S and other covalent bonds.
Thermal induced protein in-solubilisation due to S-S cross-linking has been reported for extrusion of legumes (Alonso et al., 2000; Laleg, Cassan, Barron, Prabhasankar, & Micard, 2016; Stanley, 1989) and gluten (Pommet, Redl, Morel, Domenek, & Guilbert, 2003). Increasing SME favoured proteins cross-linking by S-S and non S-S covalent bonds due to the enhancement of un-folding and re-association of protein aggregates under high shear force (Anderson & Ng, 2000; Camire, 1991; Della Valle et al., 1994). Although SME is directly correlated to T because of solid friction and viscous dissipation, our results suggest that it is the temperature which influenced directly these changes. Moreover, the ANOVA analysis did not show any significant effect of die geometry (configuration C and D) on protein solubility (Table 3), probably because shear did not contribute to protein transformation. The close protein transformations between two die geometries mean that the main structural changes happened in the screw extruder section and no further changes occurred in long die. ANOVA analysis also demonstrated that there was insignificant effect of moisture content on protein changes for the three conditions (0.18; 0.21; 0.26) (Table 3). The material temperature corresponding to the onsets of proteins cross-linking during extrusion of pea flour were determined for the first time. Both S-S and non S-S covalent bonds contributed to protein in-solubilisation. Della Valle et al. (1994) pretended that the role of S-S was less important than other covalent bonding based
Version postprint
ACCEPTED MANUSCRIPT
on the fact that protein aggregates with S-S bonds did not vary much with extrusion conditions. This discrepancy can be attributed to different methods of protein extraction and quantification. In the earlier works, neither sonication-assisted extraction procedure nor precise SE-HPLC for soluble-protein quantification was performed. Moreover, different reagents (DTT in citrate phosphate buffer vs. DTE in SDS-phosphate buffer) and extraction temperature were implemented to disrupt S-S bonds. The use of DTT in the absence appropriate denaturant (urea, guanidine, or SDS) is less effective because it cannot reduce buried (solvent-inaccessible) disulfide bonds (Hermanson, 2013).
3.3 Total solubility, color and starch changes
Native pea flour displayed peaks at 5.6°, 9.8°, 11.3°, 15.2°, 17°, 18.2°, 21.9°, 23° and 26.3° on the WAXS diffractograms (Fig. 5a). These peaks are typical for C-type crystallinity pattern of starch from legumes (Buleon, Gerard, Riekel, Vuong, & Chanzy, 1998). For extruded samples, these peaks have disappeared, which suggested that starch was amorphous. This is in agreement with the values of
T, always larger than Tm (see 3.1). The absence of DSC residual gelatinisation (Fig. 5b) confirmed that
the extruded samples were amorphous.
The water solubility index of total solids WSIsolids of flour and extrudates took into account
starch and other soluble components like fibers and proteins. WSIsolids was correlated positively with
that of starch (R2=0.81, result not shown). As protein aggregates resulting from cross-linking of water soluble proteins were not soluble in water, and since only 1.1% (d.b.) of total fibers (13.4% d.b.) in native split pea flour was water soluble (Petitot, Barron, Morel, & Micard, 2010), we supposed that fibers, the third major component in pea flour, were solubilized during extrusion (Ralet, Della Valle, & Thibault, 1993).
Extruded starches were partially soluble with WSI 50%, i.e. lower than WSI of solids. Both indices increased with temperature (Fig. 6), and also with SME (result not shown). Both temperature and shear energy are known to increase the breakdown of starch granules and macromolecules and subsequently to raise the amount of water-soluble components (from 12 to 55%) compared to starch in native flour (11.7%). Moreover, WSI of total solids was negatively and linearly correlated with WAI (R2=0.83, result not shown), suggesting that extrudates that are less soluble in water may absorb more water. Higher WAI indicates the presence of larger starch granule fragments, while higher WSI implies that starch was depolymerized (de Mesa et al., 2009; Kirby, Ollett, Parker, & Smith, 1988). These results are rather confirmatory, since they are common to extrusion of starches (Chinnaswamy & Hanna, 1990). However, Mercier and Feillet (1975) reported that in the temperature domain [90; 250°C] WAI of extruded corn starch increased with WSI, reaching maximum at 175°C. We found that the increase of both WSI indices with material temperature could be fitted sufficiently with sigmoid model (Fig. 6). This model allowed determination of onset temperature of starch solubility increase, close to 115°C. This value is lower than the onset temperatures of protein solubility decrease and formation of S-S bonds. The interval between onset temperature of starch and protein changes can be
Version postprint
ACCEPTED MANUSCRIPT
considered as experimental window to obtain extruded products having sufficient soluble starch and to avoid massive in-solubilisation of proteins.
Extruded materials were darker as shown by the decrease of L* values from 87 to 58 and more reddish and bluish (higher a* and lower b*) with increase of T (Fig. 7a). Moreover, correlations of a* with protein solubility in DTE (R2=0.80) and non-extractable proteins (R2=0.80) showed that protein aggregations by other covalent bonds occurred at the same time as darkening and increase in redness, i.e. browing (Fig. 7b). Extrudate browning can be related to the development of Maillard reactions between reducing sugars and free amine groups (lysine). Reducing sugars can result from starch breakdown during extrusion (Camire, 1991). The higher intensity of thermo-mechanical treatment, the higher was the transformation of starch and proteins and the interactions between their derivatives. Consequently, Maillard reactions can be related to the reduction of lysine availability in the extruded pea (Asp & Björck, 1989; Meuser & Wiedmann, 1989). Lysine is one of the most sensitive and most limiting amino acids in humane diets, so lysine availability is one of nutritional quality criteria for processed legumes (Asp & Björck, 1989; Hood-Niefer and Tyler, 2010; Laleg et al., 2017). Finally, extrudate color can be utilised as indicator of protein aggregation by covalent linkages others than S-S ones; in a first approach for sample screening before analysis of protein solubility using SE-HPLC.
3.4 Cell wall morphology
The morphology of starch-protein blend in the cell wall materials of expanded samples was ascertained using CSLM for two samples extruded at similar T, higher than the onset of proteins aggregation by S-S bonds: sample C12 (550 kJ/kg, 136°C) and D11 (720 kJ/kg, 140°C). Sample D11 had slightly higher starch and DTE-protein solubility, likely due to higher SME. For C12 (Fig. 8a). CSLM micrograph shows small protein aggregates (≈10 µm, green) dispersed among some swollen and stretched starch granules (“ghosts”, ≈50 µm, light red), and entrapped in a continuous reddish network, formed by dispersed starch macromolecules. Conversely, CSLM of sample D11 (Fig. 8b) revealed larger stretched protein aggregates connected together (30-50 µm, green) and forming morphology of co-continuous phases with starch macromolecules (reddish), with much less swollen granules. In both cases, the presence of swollen granules and dispersed starch phase was expected, since starch was amorphous and solubility index was about 35%. Together with preceding results (3.2 and 3.3) these images suggest that different states of protein aggregations can lead to various starch-protein morphologies. Hence the composite morphology of the cell wall of expanded pea flour would be governed by the size and continuity of protein aggregates. Their presence may lead to a continuous protein phase which can limit the access of water to starch, and explain the lower values of starch swelling and solubility in pea flour compared to the pure starch with WSI as high as 100% (Meuser, van Lengerich, & Reimers, 1984). Moreover, these results confirmed that pea flour cannot be considered as a homogenous viscous fluid during extrusion, as suggested in chapter 3.1, and they
Version postprint
ACCEPTED MANUSCRIPT
could explain the difficulties encountered when measuring its melt viscosity under thermomechanical conditions close to those of extrusion (Beck, Knoerzer, Sellahewa, Emin, & Arcot, 2017).
The changes of morphology can affect the viscosity of the pea flour during extrusion and modify its behaviour during expansion. Although extrusion conditions (SME, T) were very close to each other, density values (103 vs 439 kg/m3, see Table 2) indicated that sample D11 was much more expanded than C12. Expansion during extrusion involves the succession of various mechanisms and the influence of extrusion variables on these mechanisms has been recently reviewed (Kristiawan et al., 2016). By increasing interface area between protein aggregates and amorphous starch, like in the case of the co-continuous phases (sample D11), bubble nucleation is increased which favours expansion. Moreover, for composite morphology, bubble coalescence can be reduced because of increased elongational viscosity of the melts, as shown by results for starch/zein composites (Chanvrier, Chaunier, Della Valle, & Lourdin, 2015; Chanvrier, Della Valle, & Lourdin, 2006). These authors found that the starch-protein blends with co-continuous phases morphology of (like sample D11) had higher elongational viscosity than the blends with the morphology of particles dispersed in a matrix (sample C12). This interpretation was comforted by the fact that sample D11 was extruded with the circular die D, where, due to section contraction, elongational strains were larger than for the slit die C with prevailing shear. Clearly, this interpretation has to be confirmed by studying the rheological behaviour of pea flour envisioned like a composite material of protein aggregates with amorphous starch and by ascertaining the morphology of these materials.
4. Conclusion
The large domain of hydro-thermo-mechanical conditions of pea flour extrusion led to a large panel of starch and protein chemical changes, and of morphologies of the foams cell wall material. Multi-scale structural analyses have shown that protein and starch changes depend mainly on material temperature during extrusion. With increasing intensity of thermo-mechanical treatment starch solubility in water increased, and protein solubility in SDS decreased due to the formation of protein aggregates linked by disulphide and other covalent bonds. The onset of proteins changes occurred in the interval [125, 146°C] while that of starch solubility took place at lower temperature (115°C). The interval [115, 146°C] can be suggested as temperature domain allowing to design extruded products having sufficient soluble starch without massive insolubilisation of proteins. At close values of T and
SME, die geometry affects expansion by modifying the starch/protein composite morphology
constituting the cell wall material of the extrudate, from dispersed small protein aggregates to a bi-continuous matrix between large protein aggregates and amorphous starch.
These trends will be ascertained in future work by focusing on the rheological behaviour of composite material by taking into account the influence of other constituents of flour (fiber, lipid) on morphology. This approach will help the modelling of pea flour expansion by extrusion, and designing cellular structure for target texture properties.
Version postprint
ACCEPTED MANUSCRIPT
AcknowledgementsAuthors are thankful to Joëlle Bonicel (INRA-IATE) for protein SE-HPLC analysis, Roselyne Desirest and Bruno Pontoire (INRA-BIA), and Kerstin Sauther and Andrea Butterbrodt (KIT) for excellent technical assistance.
References
Alonso, R., Orue, E., Zabalza, M. J., Grant, G., & Marzo, F. (2000). Effect of extrusion cooking on structure and functional properties of pea and kidney bean proteins. Journal of the Science
of Food and Agriculture, 80(3), 397-403.
Anderson, A. K., & Ng, P. K. W. (2000). Changes in disulfide and sulfhydryl contents and electrophoretic patterns of extruded wheat flour proteins. Cereal Chemistry Journal, 77(3), 354-359. Anderson, R. A., Conway, H. F., & Peplinski, A. J. (1970). Gelatinization of corn grits by roll cooking, extrusion cooking and steaming. Starke, 22(4), 130-135.
Asp, N.-G., & Björck, I. (1989). Nutritional properties of extruded foods. In C. Mercier, P. Linko, & J. M. Harper (Eds.), Extrusion cooking (pp. 399-434). St. Paul, Minnesota, USA: American Association of Cereal Chemists, Inc.
Barac, M., Cabrilo, S., Pesic, M., Stanojevic, S., Zilic, S., Macej, O., & Ristic, N. (2010). Profile and functional properties of seed proteins from six pea (Pisum sativum) genotypes.
International Journal of Molecular Sciences, 11(12), 4974-4991.
Barron, C., Buleon, A., Colonna, P., & Della Valle, G. (2000). Structural modifications of low hydrated pea starch subjected to high thermomechanical processing. Carbohydrate Polymers, 43(2), 171-181.
Beck, S. M., Knoerzer, K., Sellahewa, J., Emin, M. A., & Arcot, J. (2017). Effect of different heat-treatment times and applied shear on secondary structure, molecular weight distribution, solubility and rheological properties of pea protein isolate as investigated by capillary rheometry.
Journal of Food Engineering, 208, 66-76.
Ben-Hdech, H., Gallant, D. J., Bouchet, B., Gueguen, J., & Melcion, J.-P. (1991). Extrusion-cooking of pea flour: Structural and immunocytochemical aspects. Food structure, 10(3), 203-212.
Berrios, J. J., Tang, J., & Swanson, B. G. (2008). Extruded legumes. US Patent 2008/0145483
A1, 1-16.
Buleon, A., Gerard, C., Riekel, C., Vuong, R., & Chanzy, H. (1998). Details of the crystalline ultrastructure of C-starch granules revealed by synchrotron microfocus mapping. Macromolecules,
31(19), 6605-6610.
Camire, M. E. (1991). Protein functionality modification by extrusion cooking. Journal of the
Version postprint
ACCEPTED MANUSCRIPT
Chanvrier, H., Colonna, P., Della Valle, G., & Lourdin, D. (2005). Structure and mechanical behaviour of corn flour and starch-zein based materials in the glassy state. Carbohydrate Polymers,
59(1), 109-119.
Chanvrier, H., Della Valle, G., & Lourdin, D. (2006). Mechanical behaviour of corn flour and starch-zein based materials in the glassy state: A matrix-particle interpretation. Carbohydrate
Polymers, 65(3), 346-356.
Chanvrier, H., Chaunier, L., Della Valle, G., & Lourdin, D. (2015). Flow and foam properties of extruded maize flour and its biopolymer blends expanded by microwave. Food Research
International, 76, 567-575.
Chinnaswamy, R., & Hanna, M. A. (1990). Macromolecular and functional properties of native and extrusion-cooked corn starch. Cereal Chemistry, 67(5), 490-499.
Colonna, P., Tayeb, J., & Mercier, C. (1989). Extrusion cooking of starch and starchy products. In C. Mercier, P. Linko, & J. M. Harper (Eds.), Extrusion cooking (pp. 247-319). St. Paul, Minnesota, USA: American Association of Cereal Chemists, Inc.
Day, L., & Swanson, B. G. (2013). Functionality of protein-fortified extrudates.
Comprehensive Reviews in Food Science and Food Safety, 12(5), 546-564.
de Mesa, N. J. E., Alavi, S., Singh, N., Shi, Y. C., Dogan, H., & Sang, Y. J. (2009). Soy protein-fortified expanded extrudates: Baseline study using normal corn starch. Journal of Food
Engineering, 90(2), 262-270.
Della Valle, G., Quillien, L., & Gueguen, J. (1994). Relationships between processing conditions and starch and protein modifications during extrusion-cooking of pea flour. Journal of the
Science of Food and Agriculture, 64(4), 509-517.
El-Adawy, T. A., Rahma, E. H., El-Bedawey, A. A., & El-Beltagy, A. E. (2003). Nutritional potential and functional properties of germinated mung bean, pea and lentil seeds. Plant Foods for
Human Nutrition, 58(3), 1-13.
Fang, Y., Zhang, B., Wei, Y., & Li, S. (2013). Effects of specific mechanical energy on soy protein aggregation during extrusion process studied by size exclusion chromatography coupled with multi-angle laser light scattering. Journal of Food Engineering, 115(2), 220-225.
Folch, J., Lees, M., & Stanley, G. H. S. (1957). A simple method for the isolation and purification of total lipides from animal tissues. Journal of Biological Chemistry, 226(1), 497-509.
Gujska, E., & Khan, K. (1991). High temperature extrusion effects on protein solubility and distribution in navy and pinto beans. Journal of Food Science, 56(4), 1013-1016.
Hermanson, G. T. (2013). Chapter 2 - Functional Targets for Bioconjugation. In Bioconjugate
Techniques (Third edition) (pp. 127-228). Boston: Academic Press.
Holay, S. H., & Harper, J. M. (1982). Influenece of the extrusion shear environment on plant protein texturization. Journal of Food Science, 47(6), 1869-1874.
Version postprint
ACCEPTED MANUSCRIPT
Hood-Niefer, S. D., & Tyler, R. T. (2010). Effect of protein, moisture content and barrel temperature on the physicochemical characteristics of pea flour extrudates. Food Research
International, 43(2), 659-663.
Kirby, A. R., Ollett, A. L., Parker, R., & Smith, A. C. (1988). An experimental study of screw configuration effects in the twin-screw extrusion-cooking of maize grits. Journal of Food Engineering,
8(4), 247-272.
Kristiawan, M., Chaunier, L., Della Valle, G., Ndiaye, A., & Vergnes, B. (2016). Modeling of starchy melts expansion by extrusion. Trends in Food Science & Technology, 48, 13-26.
Laleg, K., Cassan, D., Barron, C., Prabhasankar, P., & Micard, V. (2016). Structural, culinary, nutritional and anti-nutritional properties of high protein, gluten Free, 100% legume Pasta. Plos One,
11(9), 1-19.
Laleg, K., Barron, C., Cordelle, S., Schlich, P., Walrand, S., & Micard, V. (2017). How the structure, nutritional and sensory attributes of pasta made from legume flour is affected by the proportion of legume protein. LWT - Food Science and Technology, 79, 471-478.
Logié, N., Della Valle, G., Rolland-Sabaté, A., Descamps, N., & Soulestin, J. (2018). How does temperature govern mechanisms of starch changes during extrusion? Carbohydrate Polymers,
184, 57-65.
Mercier, C., & Feillet, P. (1975). Modification of carbohydrate components by extrusion-cooking of cereal products. Cereal Chemistry, 52(3), 283-297.
Leterme, P., Monmart, T., & Baudart, E. (1990). Amino acid composition of pea (Pisum sativum) proteins and protein profile of pea flour. Journal of the Science of Food and Agriculture,
53(1), 107-110.
Li, C., Kowalski, R. J., Li, L., & Ganjyal, G. M. (2016). Extrusion expansion characteristics of samples of select varieties of whole yellow and green dry pea flours. Cereal Chemistry Journal, 94(3), 385-391.
Li, C. J., & Ganjyal, G. M. (2017). Chemical composition, pasting, and thermal properties of 22 different varieties of peas and lentils. Cereal Chemistry, 94(3), 392-399.
Maskus, H., & Arntfield, S. (2015). Extrusion processing and evaluation of an expanded, puffed pea snack product. Journal of Nutrition & Food Sciences, 5(4), 378.
Mession, J. L., Sok, N., Assifaoui, A., & Saurel, R. (2013). Thermal denaturation of pea globulins (Pisum sativum L.)-Molecular interactions leading to heat-induced protein aggregation.
Journal of Agricultural and Food Chemistry, 61(6), 1196-1204.
Meuser, F., van Lengerich, B., & Reimers, H. (1984). Kochextrusion von stärken. Vergleich experimenteller ergebnisse zwischen laborextrudern und produktionsextrudern mittels systemanalyse.
Version postprint
ACCEPTED MANUSCRIPT
Meuser, F., & Wiedmann, W. (1989). Extrusion plant design. In C. Mercier, P. Linko, & J. M. Harper (Eds.), Extrusion cooking (pp. 91-155). St. Paul, Minnesota, USA: American Association of Cereal Chemists, Inc.
Morel, M. H., Dehlon, P., Autran, J. C., Leygue, J. P., & Bar-L'Helgouac'h, C. (2000). Effects of temperature, sonication time, and power settings on size distribution and extractability of total wheat flour proteins as determined by size-exclusion high-performance liquid chromatography. Cereal
Chemistry, 77(5), 685-691.
Paton, D., & Spratt, W. A. (1984). Component interactions in the extrusion cooking process: Influence of process conditions on the functional viscosity of the wheat flour system. Journal of Food
Science, 49(5), 1380-1385.
Petitot, M., Barron, C., Morel, M. H., & Micard, V. (2010). Impact of legume flour addition on pasta structure: Consequences on its in vitro starch digestibility. Food Biophysics, 5(4), 284-299.
Pommet, M., Redl, A., Morel, M.-H., Domenek, S., & Guilbert, S. (2003). Thermoplastic processing of protein-based bioplastics: chemical engineering aspects of mixing, extrusion and hot molding. Macromolecular Symposia, 197(1), 207-218.
Ralet, M. C., Della Valle, G., & Thibault, J. F. (1993). Raw and extruded fibre from pea hulls. Part I: Composition and physico-chemical properties. Carbohydrate Polymers, 20(1), 17-23.
Redl, A., Morel, M. H., Bonicel, J., Vergnes, B., & Guilbert, S. (1999). Extrusion of wheat gluten plasticized with glycerol: Influence of process conditions on flow behavior, rheological properties, and molecular size distribution. Cereal Chemistry, 76(3), 361-370.
Stanley, W. D. (1989). Protein reactions during extrusion processing. In C. Mercier, P. Linko, & J. M. Harper (Eds.), Extrusion cooking (pp. 321-341). St. Paul, Minnesota, USA: American Association of Cereal Chemists, Inc.
Tollier, M. T., & Robin, J. P. (1979). Adaptation de la méthode à l’orcinol sulfurique au dosage automatique des glucides neutres totaux: conditions d’application aux extraits d’origine végétale. Annales de Technologie Agricole, 28, 1-15.
Tolstoguzov, V. B. (2016). Creation of fibrous structures by spinneretless spinning. In J. M. V. Blanshard, & J. R. Mitchell (Eds.), Food structure: its creation and evaluation (pp; 181-196). London, UK: Elsevier Science.
Vergnes, B., Della Valle, G., & Delamare, L. (1998). A global computer software for polymer flows in corotating twin screw extruders. Polymer Engineering and Science, 38(11), 1781-1792.
Figure captions
Fig. 1. Domaine of extrusion variables: moisture content (MC), product temperature (T) and specific mechanical energy (SME)
(a) Variation of T with SME. Data dispersion is due to differences in die configuration, imposed die temperature, and total mass flow rate.
Version postprint
ACCEPTED MANUSCRIPT
(b) Variation of SME with filling ratio for specified screw configuration. The filling ratio is total mass flow rate (Q) divided by screw speed (N)
The symbols refer to measured data, and the solid lines represent data fitting using Eqs.:
𝑇 = 𝑚 × 𝑆𝑀𝐸 + 𝑏 (Fig. 1a), and 𝑆𝑀𝐸 = 𝑏1× (𝑄/𝑁)𝑏2 (Fig. 1b). The fitting equations are shown in the Appendix (Table A1)
Fig. 2. Macro structure of pea extrudates
(a) Variation of density (ρ*) with product temperature
(b) Relation between sectional expansion index (SEI) and density
The symbols refer to measured data, and the solid lines represent data fitting using Eqs.: 𝜌∗=
𝑎/ (1 + 𝑒𝑥𝑝 (−𝑘 × (𝑇 − 𝑇𝑐))) (Fig. 2a), and 𝑆𝐸𝐼 = 𝑏1× 𝜌∗(𝑏2) (Fig. 2b). The fitting equations are shown
in the Appendix (Table A1)
Fig. 3. SE-HPLC elution profile of SDS-soluble proteins of pea flour and extrudates (C2 and C12) at different extrusion temperature
Fig. 4. Variation of protein transformation with product temperature (a) Protein solubility in buffers (SDS and DTE)
(b) SDS-soluble protein fractions
The open symbols refer to measured data of flour while the closed ones for extrudates. The solid lines represent data fitting using Eq. 3a: 𝑆𝑜𝑙.= 𝑎/(1 + 𝑒𝑥𝑝(−𝑘 ×(𝑇 − 𝑇𝑐))).
Sol. indicates either soluble proteins in specified reagents (Fig. 4a) or SDS-soluble protein fractions (Fig. 4b). Ti is the temperature at the onset of solubility change. The fitting equation is shown in the
Appendix (Table A1)
Fig. 5. Amorphous extruded samples
(a) Absence of crystallinity peaks in WAXS spectrum (b) Absence of DSC gelatinisation enthalpy
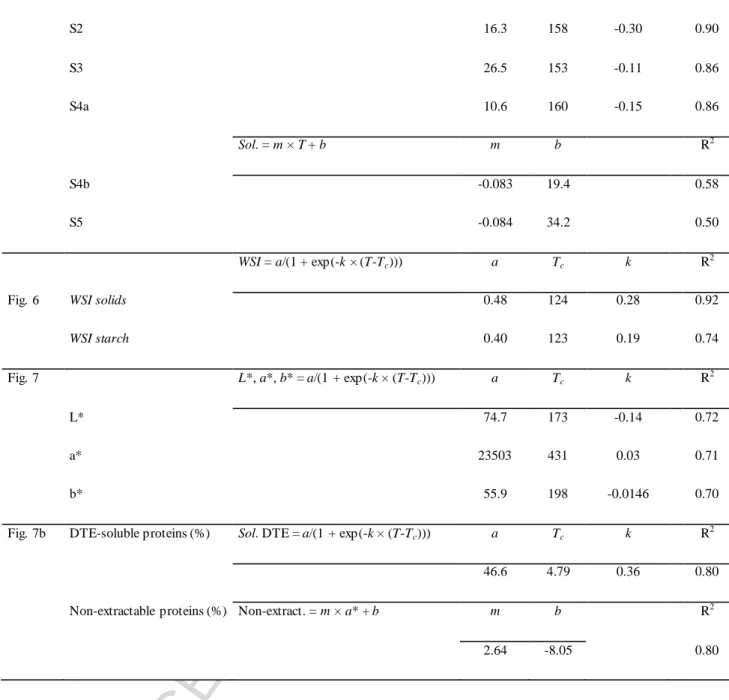
Fig. 6. Variation of water solubility index (WSI) of pea extrudates with product temperature. WSI of solids and WSI of starch are fitted with different curves using Eq.: 𝑊𝑆𝐼 = 𝑎/ (1 + 𝑒𝑥𝑝(−𝑘 × (𝑇 − 𝑇𝑐))). Ti is the temperature of the onset of WSI change. The fitting parameters are shown in the
Appendix (Table A1)
Version postprint
ACCEPTED MANUSCRIPT
(a) Variation of extrudate color with product temperature(b) Variation of protein solubility in buffers with extrudate color
The symbols refer to measured data, and the solid lines represent data fitting using Eqs.: 𝐿∗,𝑎∗, 𝑏∗ =
𝑎/ (1 + 𝑒𝑥𝑝 (−𝑘 × (𝑇 − 𝑇𝑐))) (Fig. 7a), and 𝑆𝑜𝑙. 𝐷𝑇𝐸 = 𝑎/ (1 + 𝑒𝑥𝑝(−𝑘 × (𝑇 − 𝑇𝑐))) and 𝑛𝑜𝑛 − 𝑒𝑥𝑡𝑟𝑎𝑐. = 𝑚 × 𝑎∗+ 𝑏 (Fig. 7b). Sol. DTE indicates DTE-soluble proteins while non-extrac. refers to non-extractable proteins. The fitting equations are shown in the Appendix (Table A1)
Fig. 8. CSLM images of cell wall of foams, extruded at close T values (138°C +/- 2°C). Proteins were stained as green with fuchsin acid. Starch was stained red with PPA.
The morphology of cell wall changed from dispersed small protein aggregates embedding some swelled starches (Fig. 8a) to a bi-continuous matrix between large protein aggregates and amorphous starch (Fig. 8b).
Version postprint
ACCEPTED MANUSCRIPT
Fig. 1. D11 C12 R² = 0.86 0 300 600 900 1200 1500 0 2 4 6 8 10 S M E (k J /k g ) Q/N (100 kg/h/rpm) MC 19% MC 21% MC 26% MC >= 26% screw configuration A screw configuration B R² = 0.74 110 120 130 140 150 160 170 0 200 400 600 800 1000 1200 P rod u c t t e m p e ra tu re T ( C) SME (kJ/kg) MC 19% MC 21% MC 26% MC >= 26% screw configuration A screw configuration B D11 (a) (b) C1Version postprint
ACCEPTED MANUSCRIPT
Fig. 2. D11 C12 0 150 300 450 600 750 900 1050 1200 100 120 140 160 180 D e ns it y *(k g/ m 3) Product temperature T ( C) MC 19% MC 21% MC 26% MC >= 26% R2= 0.77 screw configuration A (a) C12 D11 R² = 0.91 0 2 4 6 8 10 12 14 16 18 0 200 400 600 800 1000 1200 SEI Density * (kg/m3) (b) screw configuration BVersion postprint
ACCEPTED MANUSCRIPT
Fig. 3. 0.00 0.05 0.10 0.15 0.20 0 5 10 15 20 25 30 A b sorban ce ( A .U.)Molecular weight Mw(kDa) Pea flour C12; T 136°C C2; T 158°C S1 S2 S3 S4a S5 S4b 1024 91 41 31 24 9
Version postprint
ACCEPTED MANUSCRIPT
Fig. 4. 0 10 20 30 40 50 60 70 80 90 100 100 120 140 160 180 200 P ro tein solu b ility ( % ) Product temperature ( C) SDS DTE Non-extractable Ti T i R2= 0.83 R2= 0.75 R2= 0.81 Ti 0 0 5 10 15 20 25 30 100 120 140 160 180 200 S DS -solu b le p ro tein fr ac tion s (% ) Product temperature ( C) S1 S2 S3 S4a Ti Ti Ti R2= 0.86 R2= 0.90 R2= 0.86 (b) (a) D11 C12 C12 D11 R2= 0.70Version postprint
ACCEPTED MANUSCRIPT
Fig. 5. 0 3 6 9 12 15 18 21 0 5 10 15 20 25 30 No rmaliz ed int ensit y Scattering angle (2) Pea flour E2 E4 D6 C12 D11 C1 (a) 50 60 70 90 100 Temperature ( C) 80 0.22 0.20 0.18 0.16 0.14 0.12 0.10 He a t flow ( W /g) C1 D6 E4 D11 E2 Pea flour (b)Version postprint
ACCEPTED MANUSCRIPT
Fig. 6. 0% 10% 20% 30% 40% 50% 60% 100 110 120 130 140 150 160 170 WSI Product temperature T ( C) WSI solids, flourWSI solids, extrudates WSI starch, flour WSI starch, extrudates
R2=0.92 R2=0.74 Ti Ti C12 D11