HAL Id: inserm-00343477
https://www.hal.inserm.fr/inserm-00343477
Submitted on 1 Dec 2008
HAL is a multi-disciplinary open access
archive for the deposit and dissemination of
sci-entific research documents, whether they are
pub-lished or not. The documents may come from
teaching and research institutions in France or
abroad, or from public or private research centers.
L’archive ouverte pluridisciplinaire HAL, est
destinée au dépôt et à la diffusion de documents
scientifiques de niveau recherche, publiés ou non,
émanant des établissements d’enseignement et de
recherche français ou étrangers, des laboratoires
publics ou privés.
Effects of chronic morphine and morphine withdrawal on
gene expression in rat peripheral blood mononuclear
cells.
Stephane Desjardins, Emilie Belkai, Dominique Crete, Laurie Cordonnier,
Jean-Michel Scherrmann, Florence Noble, Cynthia Marie-Claire
To cite this version:
Stephane Desjardins, Emilie Belkai, Dominique Crete, Laurie Cordonnier, Jean-Michel
Scher-rmann, et al..
Effects of chronic morphine and morphine withdrawal on gene expression in
rat peripheral blood mononuclear cells.. Neuropharmacology, Elsevier, 2008, 55 (8), pp.1347-54.
�10.1016/j.neuropharm.2008.08.027�. �inserm-00343477�
Effects of chronic morphine and morphine withdrawal on gene expression
in rat peripheral blood mononuclear cells
Desjardins Stephane , Belkai Emilie , Crete Dominique , Cordonnier Laurie , Scherrmann Jean-Michel , Noble Florence * ,
Marie-Claire Cynthia
NAVVEC, Neuropsychopharmacologie des addictions. Vuln rabilit et variabilit exp rimentale et clinique é é é é CNRS : UMR7157, INSERM : U705, IFR71, Universit Paris Descartes - Paris Vé , Universit Denis Diderot - Paris VIIé , FR
* Correspondence should be adressed to: Florence Noble <[email protected]>
Abstract
SummaryChronic morphine treatment alters gene expression in brain structures. There are increasing evidences showing a correlation, in gene expression modulation, between blood cells and brain in psychological troubles. To test whether gene expression regulation in blood cells could be found in drug addiction, we investigated gene expression profiles in peripheral blood mononuclear (PBMC) cells of saline and morphine-treated rats. In rats chronically treated with morphine, the behavioural signs of spontaneous withdrawal were observed and a withdrawal score was determined. This score enabled to select the time points at which the animals displayed the mildest and strongest withdrawal signs (12h and 36h after the last injection). Oligonucleotide arrays were used to assess differential gene expression in the PBMCs and quantitative real-time RT-PCR to validate the modulation of several candidate genes 12h and 36h after the last injection. Among the 812 differentially expressed candidates, several genes (Adcy5, Htr2a) and pathways (Map kinases, G-proteins, integrins) have already been described as modulated in the brain of morphine-treated rats. Sixteen out of the twenty four tested candidates were validated at 12h, some of them showed a sustained modulation at 36h while for most of them the modulation evolved as the withdrawal score increased. This study suggests similarities between the gene expression profile in PBMCs and brain of morphine treated rats. Thus, the searching of correlations between the severity of the withdrawal and the PBMCs gene expression pattern by transcriptional analysis of blood cells could be promising for the study of the mechanisms of addiction.
MESH Keywords Analysis of Variance ; Animals ; Behavior, Animal ; drug effects ; Gene Expression Profiling ; Gene Expression Regulation ; drug effects ; Leukocytes, Mononuclear ; drug effects ; metabolism ; Male ; Morphine ; administration & dosage ; pharmacology ; Narcotics ; administration & dosage ; pharmacology ; Oligonucleotide Array Sequence Analysis ; RNA, Messenger ; genetics ; metabolism ; Rats ; Rats, Sprague-Dawley ; Substance Withdrawal Syndrome ; genetics ; metabolism ; Time Factors
Introduction
Opiates are among the most largely used addictive drugs. Abused opiates primarily interact with opioid receptors in the centralμ
nervous system and induce long-term behavioral and cellular alterations. A current challenge in opiate addiction is to understand the molecular alterations underlying the adaptative changes observed. The structure of different classes of opioid receptors, the gene encoding opioid receptors, and the signal transduction pathways triggered by opioids have been investigated extensively on neuronal cells in the last fourth decades. Chronic morphine is associated with differential gene expression in several brain structures (Ammon et al., 2003;
; ; ). Although some of the modifications observed in rodent Beitner-Johnson et al., 1992 Marie-Claire et al., 2004 McClung et al., 2005
models of addiction could be found postmortem in the brain of opiate addicts (Ferrer-Alcon et al., 2000, 2004 Albertson ; et al., 2006), it is difficult to extrapolate all the results obtained from the animal brain to the patients.
Interestingly, in the case of several psychological and neurologic troubles including bipolar disorder, schizophrenia and Parkinson disease, a correlation in gene expression modulation between blood cells and brain has been recently demonstrated (Bowden et al., 2006; ). These results suggest that studies of the transcription level of certain genes in blood cells may give insights into their Du et al., 2006
modulation in the brain. Moreover, in the case of major depressive disorder studies of gene expression modulations showed that peripheral leucocytes exhibit unique changes in the mRNA levels of several genes that are receptive to antidepressant treatment (Iga et al 2008). Therefore, study of gene expression in peripheral blood mononuclear cells (PBMC) may be useful for a better understanding of brain and neurological disease related pathways, and monitoring of therapeutic responses.
On immune cells, opioid receptors with similar pharmacological and biochemical characteristics to neuronal cells have been reported (
; ; ; ; ; ; ;
Bidlack, 2000 Gaveriaux et al., 1995 McCarthy et al., 2001 Sharp et al., 1998 Sharp, 2006 Suzuki et al., 2001a Suzuki et al., 2001b ; ). Moreover, morphine has been shown to interfere with lymphocytic cells functions following Suzuki et al., 2000 Wick et al., 1996
binding to these receptors (Rahim et al., 2002; Roy et al., 2004). Chronic morphine treatment has been shown to alter a number of immune parameters including phagocytosis (Eisenstein and Hilburger, 1998), antibody response in mice (Rahim et al., 2002) and cytokine production in human and mice peripheral blood mononuclear cells (PBMCs) (Pacifici et al., 2000; Peterson et al., 1989). Moreover,
Page /2 12
morphine withdrawal has been shown to alter immune response in mice (Belcheva et al., 2002; Hilburger et al., 1997). Gaveriaux-Ruff et al showed morphine immunosuppressive effects during an escalating dose protocol in mice and these effects were abolished in mu-receptor knockout animals (Gaveriaux-Ruff et al., 1998).
In order to facilitate the interplay between morphine-treated rat models and opiate-dependent patients we chose to work on an easily accessible tissue: PBMCs. To evaluate whether transcriptional profiling of PBMC could serve to identify genes regulated by morphine rats were chronically treated with morphine during five days, and the behavioral signs of spontaneous withdrawal were observed at different times after the last injection to select the time point at which the animals displayed the minimum withdrawal signs for subsequent analyses. High-density oligonucleotide arrays were used to assess global differential gene expression in the PBMCs. The changes in gene expression were also investigated for several transcripts by quantitative PCR 12h and 36h after the last injection when spontaneous withdrawal signs were minimum and maximum respectively. The regulations of the selected genes were also studied 4h before the last injection in order to estimate the influence of the withdrawal on the observed effects. The results showed that chronic morphine regulates gene expression in PBMCs and interestingly among these genes several have previously been found modulated by morphine treatment in rat brain.
Materials and Methods
Animals and drugs
Male Sprague-Dawley rats (Janvier, Le Genest-Saint-Isle, France) weighing 180 250 g at the beginning of the experiments were–
housed four per cage. Animals were maintained under standard laboratory conditions (21 1 C, 55 60 relative humidity, 12h light/dark± ° – %
cycle, food and water ad libitum) for 3 to 5 days before the beginning of the experiments. Care and treatments of animals conformed to the ethical standards and guidelines promulgated by the European Communities Council Directive (86/609/EEC). All efforts were made to minimize animal suffering and to use only the number of animals necessary to produce reliable scientific data. Morphine chlorhydrate (Francopia, France) was dissolved in saline (0.9 NaCl). Morphine and saline solutions (0.1mL per 100 g of body weight) were injected%
intraperitoneally.
Animal Treatments
Dependence was induced in rats by repeated intraperitoneal injections of morphine twice daily at 08.00 AM and 19.00 PM. Morphine doses were progressively increased from 10 to 40 mg kg injection: first day 2 10 mg kg , second day 2 20 mg kg , third day 2 30 mg−1 × −1 × −1 ×
kg , fourth and fifth days 2 40 mg kg . Control group was treated with saline following the same procedure.−1 × −1
Behavioral studies
Spontaneous withdrawal syndromes were observed for 15 min in circular plexiglass observation boxes (30 cm wide; 40 cm high) 12h, 18h and 36h after the last morphine injection. Two classes of withdrawal signs were measured: counted signs and observed signs. The number of bouts of teeth chattering, wet dog shakes, mastication and tremor were counted and the sum is a score for each counted signs. Ptosis, defecation, abnormal posture were observed over periods of 3 min, with one point being given for the presence of each sign during each period. The number of periods showing the sign was then counted (maximum score 5). Global withdrawal score was calculated as the sum of scores for all signs. Body weight was measured during the treatment and before observation period.
PBMC isolation and RNA extraction
PBMC isolation was carried out at 3 time-points: 4h before the last injection, 12h and 36h after the last injection on three independent animal groups. Animals were anaesthetized using pentobarbital (100 mg kg ) at the mentioned time points and blood was collected by−1
intracardiac ponction (8 10 mL per animal). Rat PBMCs were isolated from whole blood by density gradient centrifugation on–
Ficoll-Paque Plus lymphocyte separation medium (GE Healthcare Life Science, France). The layer with PBMCs was removed and® washed twice with saline 0.9 and the recovered cells were used directly for total RNA extraction. Total RNA was isolated with Rneasy%
Micro Kits (Qiagen, Courtaboeuf, France), following the manufacturer s protocol. Each RNA sample was prepared from PBMCs’
individually isolated from one animal whole blood. Quantification of total RNA was assessed by spectrophotometry using a Nanodrop® instrument (Nyxor, France).
Microarray target preparation and Affymetrix hybridization
The quality of the RNA samples was determined by electrophoresis using RNA labs chips (Agilent ). Synthesis of cDNA, synthesis® and biotinylation of cRNA, fragmentation and hybridization were all performed according to the manufacturer s instructions (Affymetrix,’
Santa Clara, CA, USA) at the Affymetrix genopole facility (CHU Saint-Louis, Paris). Briefly, double-stranded cDNA was synthesized from total RNA samples using a Superscript Choice Kit with a T7-dt24 primer incorporing a T7 RNA polymerase promoter. Biotinylated cRNA was prepared by in vitro transcription using Enzo Bioarray High Yield RNA Transcript Labeling kit and then fragmented. The fragmented and biotin-labeled cRNA samples were hybridized on Affymetrix Rat Genome RAE230_2.0 Genechips (containing 31,000®
probe sets) according to the manufacturer s instructions. Scanned images of the arrays were converted to numerical data by GCOS’
software (Affymetrix) and outputted to tab delimited text files containing Affymetrix ProbeSet ID, signals, present or absent detection® calls, and detection -values for each feature on the array. Comparison analyses were conducted using Dchip software 3.1 (P www.dchip.org ).
Microarray analysis
DNA-Chip analyzer (DChip) version 2006 (Li and Wong, 2001) was used to analyze Affymetrix data. A comparison between the five hybridizations with morphine treatment and the five controls generated a change of P-value. The average percentage of probe sets that were called as present was 60.7 among the different hybridizations except for one of the morphine array (53.5 ), this array was then% %
excluded from the subsequent study. Multiple comparisons of four morphine-treated against five control chips were therefore performed. To identify potentially regulated transcripts we chose a cut-off of 50 fold change (treated vs.Control Assay Signal Ratio) and p<0.05.%
Results are displayed as mean of fold induction and/or reduction. The selected transcripts after the Dchip analysis were characterized using NetAffix Analysis center (™ https://www.affymetrix.com) and FatiGO (+ http://www.fatigo.org) (Al-Shahrour et al., 2006 Al-Shahrour et; ). We used online tools that are specifically designed to assist investigators to classify the functional roles of the identified al., 2005
differentially expressed genes. The FatiGO utilizes the Gene Ontology (GO) database provided by the GO consortium (+
) and other databases as KEGG pathway. We compared overexpressed or underexpressed gene lists with rat http://www.geneontology.org/
RAE 230.2 array list. Then a Fisher s exact test was used to check for significant over representation of GO terms in one of the sets.’
Multiple test correction to account for the multiple hypothesis tested (one for each GO term) was applied (FDR adjusted test).
Reverse transcription and Real-Time PCR
Independent batches of RNA were obtained from PBMCs of morphine and saline-treated rats. Total RNAs were reverse transcribed in a final volume of 20 L containing 1X RT-PCR buffer (Invitrogen , France), 500 M each deoxynucleotide triphosphate, 20 U of RNasinμ ® μ
RNase inhibitor (Promega, France), 10 mM DTT, 100 U of Superscript II RNase H reverse transcriptase (Invitrogen, France), 1.5 M− μ
random hexamers (Amersham-Pharmacia , France), and 1 g of total RNA. Samples were incubated at 20 C for 10 min and 42 C for 30® μ ° °
min, and reverse transcriptase was inactivated by heating at 99 C for 5 min. PCR primers were chosen with the assistance of Oligo 6.42°
software (MedProbe, Norway). The primer nucleotide sequences used in this study are listed in Table I. Fluorescent PCR analysis was performed using a LightCycler instrument (Roche Diagnostics, France). The cDNAs were diluted 40-fold and 5 L were added to the® μ
PCR reaction mix to yield a total volume of 10 L. The PCR reagents were obtained from the FastStart DNA Master SYBR Green I kitμ
(Roche Diagnostics, France). The reaction buffer contained 4 mM MgCl and 0.5 M of each primer. Amplification protocols consisted of2 μ
35 40 cycles of denaturation at 94 C (5 s), annealing at 64 C (5 s), and extension at 72 C (10 s). cDNAs from a naive rat blood were used– ° ° °
to generate an external standard curve for each gene. We also quantified transcripts of the gene coding for the Ribosomal Protein Large, P0 (Rplp0), a component of the 60S subunit of ribosomes, as the endogenous RNA control and normalized each sample on the basis of its RPLP0 content.
Statistical analysis
All series of data were analyzed with GraphPad Prism 4.0 software. For behavioral experiment, three independent experiments were® performed, 15 morphine-treated rats and 15 control rats were compared at each time-point. Data were analyzed by two-way ANOVA with Bonferonni post-test. For body weight study three independent experiments were performed, 28 treated and placebo rats were compared at each time-point. Data were analyzed by two-way repeated measures ANOVA with Bonferonni post-test. For real-time quantitative RT-PCR results, three additional experiments at 4h, 12h and 36h were carried out and the RNAs from 12 14 morphine-treated rats and− + + –
10 12 control rats were compared. Data were analyzed using Student s test between groups at each time point. Differences with <0.05– ’ p between experimental groups at each point were considered statistically significant.
Results
Behavioral experiment
Physical dependence was induced in male Sprague-Dawley rats by repeated i.p injections of morphine twice daily and the withdrawal signs were monitored in order to determine the time points for the transcriptional studies. The weight gain was monitored every 12h throughout morphine treatment and withdrawal, as shown on figure 1a. A significant increase of 18 was observed in control rats and the%
weight of rats treated with morphine increased by 13 during the five days of morphine treatment. This difference was not statistically%
significant. The weight of the control group continued to increase during 4 days after the last injection of saline; while morphine withdrawal induced a significant reduction on weight gain in rats treated with the alkaloid. A maximum difference was observed in body weights of control versus morphine-treated rats 36h after the last injection (p<0.001) (Figure 1a).
Page /4 12
Morphine-withdrawn animals showed behavioral signs of opiate withdrawal, including wet dog shakes, teeth chattering, diarrhea, mastication, abnormal posture and ptosis. The calculated global withdrawal scores are presented in figure 1b. Withdrawal signs were observed at 12h, 18h and 36h after the last injection and global withdrawal scores of morphine-treated animals were significant (p<0.001) at each time-point. Twelve hours after the last morphine injection, all the withdrawal signs were already present but the global withdrawal score was less important than those calculated at 18h and 36h after the last injection. The 12h and 36h time points displaying the minimum and maximum withdrawal scores were therefore selected for the subsequent studies.
Regulation of gene expression in the PBMCs
The Affymetrix GeneChip Rat Genome RAE 230 2.0 was used to identify genes differentially regulated in the PBMCs of rats at ® +
12h after the last morphine injection. To obtain a set of differentially expressed genes and global gene expression profiling, we used a combinaison of P-value (P<0.05) and fold change value (>1.5 or <0.66). Comparison of chronic morphine with control condition revealed 812 (596 up-regulated and 215 down-regulated) differentially expressed (50 fold or more) gene transcripts in PBMCs of treated rats. Of%
the 812 significantly modulated candidates, only 394 were annotated and represented 276 distinct genes, whereas the others (51.5 ) were%
transcripted loci with various levels of matches to known genes. A selective list of the genes modulated in this study is presented in Table . We used NetAffix Analysis Center and FatiGO to identify the signalling pathways and genes families regulated by chronic
II ™ +
morphine (Figure 2). The results revealed several genes families that have been previously described as modulated by chronic morphine in the brain. We found that 7 of the 276 annoted genes regulated belong to the G-protein coupled receptor protein signalling pathway, these%
include G-protein coupled receptors and G-protein coupled protein. Signal transduction pathways were also represented such as mitogen activated protein kinase pathway and cAMP pathway. Other regulated genes have a role in immunity and defense process interleukin 1 receptor, type I (Illr1), interferon beta 1 (Ifnb1), and a role in pro-apoptotic Tissue inhibitor of metalloproteinase 3 (Timp3), Bcl2 modifying factor (Bmf), guanine nucleotide binding protein, alpha q (Gnaq), NCK-associated protein 1 (Nckap1), and anti-apoptotic pathways Sphingosine kinase 1 (Sphk1), Chemokine (C-C motif) ligand 2 (Ccl2), Fibroblast growth factor 8 (Fgf8) . Three[ ]
5-hydroxytryptamine receptors 6, 7 and 2a (Htr6, Htr7 and Htr2a), and calcium channels were also identified.
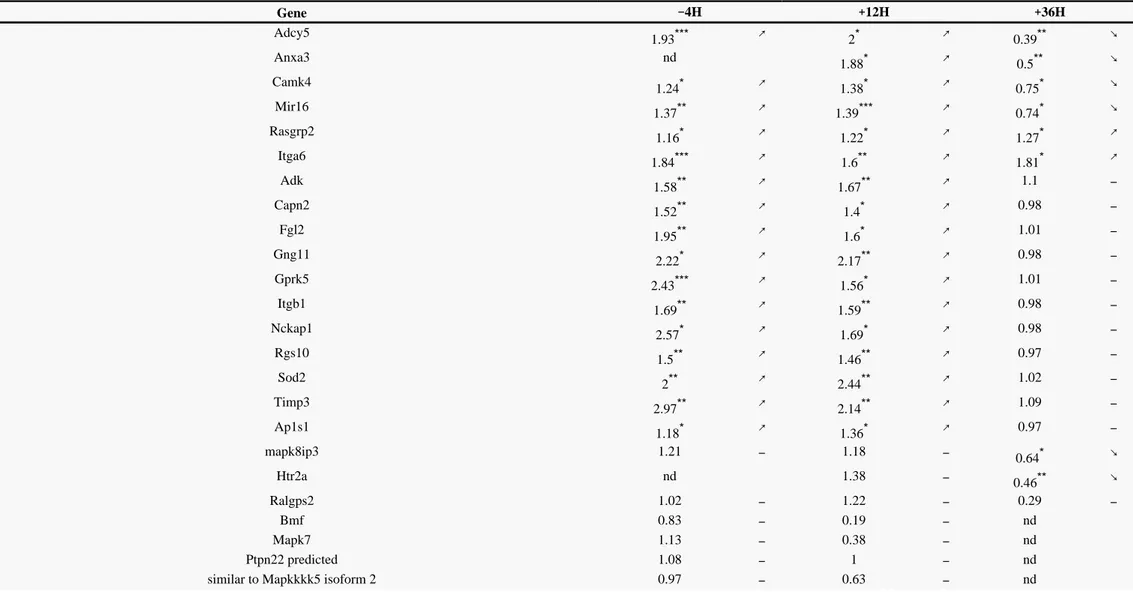
Validation of differentially regulated genes by quantitative RT-PCR at 12h
In order to validate the regulation of 24 selected genes we performed quantitative real-time RT-PCR on samples collected at the same time-point (12h) as for the array analysis (minimum withdrawal). We chose genes of the G protein pathway (Gprk5, Gng11), genes of the Mapk pathway (similar to mitogen-activated protein kinase kinase kinase kinase 5 isoform 2), mitogen-activated protein kinase 7 (Mapk7) and genes known to be modulated in the brain by morphine treatment (Adcy5, Adenosine kinase, Htr2a). Since morphine promotes cells apoptosis, we also chose to confirm the regulation of genes implicated in this process such as Bmf, Nckap1, Timp3, and also genes implicated in cell adhesion such as Integrin beta 1 (Itgb1) and integrin alpha 6 (Itga6). Out of the 18 tested genes 12 were validated by Q-RT-PCR (Table III). Furthermore, the fold-changes obtained were similar to those calculated in the array experiments (Table II and ). We also tested 6 genes that belong to the tested families and almost fulfill the criteria detailed in the material and methods table III
section: regulator of G-protein signalling 10 (Rgs10) (1.46), membrane interacting protein of Rgs16 (Mir16) (1.39), mitogen-activated protein kinase 8 interacting protein 3 (Mapk8ip3) (1,35), adaptor-related protein complex 1, sigma 1 subunit (Ap1s1) (1.36), calpain 2 (Capn2) (1.4), RAS, guanyl releasing protein 2 (Rasgrp2) (1.22). We found that the regulations of Rgs10, Mir16, Capn2, Rasgrp2, were verified by quantitative real-time RT-PCR at 12h (Table III).
Regulation of differentially regulated genes by quantitative RT-PCR at 36h
In order to compare the expression levels at the minimum and maximum withdrawal scores in our model, we carried out an additional independent experiment at 36h to analyze the differential expression levels between morphine-treated and control rats of 18 genes confirmed or not at 12h. Four groups of genes could be distinguished according to their pattern of regulation at 12h and 36h. Four genes+ +
(Adcy5, Mir 16, Camk4, and Anxa3) were significantly up-regulated at 12h but significantly down-regulated at 36h. A group with Itga6 and Rasgrp2 showed a sustained up-regulation at 12h and 36h. A group with Adk, Nckap1, Gng11, Gprk5, Rgs10, Capn2, Fgl2, Sod2, Timp3, Ap1s1, and Itgb1 showed a significant up-regulation at 12h but no modulation at 36h. And a fourth group composed of Mapk8ip3 and Htr2A was not significantly modulated at 12h but significantly regulated at 36h.
Regulation of the validated genes during chronic morphine treatment
In order to know how the validated genes were being expressed before the onset of the withdrawal process, quantitative real time PCR was performed on PBMCs of rat sacrificed on day 5. For all the tested genes the regulations observed 4h before the last morphine injection confirmed those obtained 12 hours after the last morphine injection (Table III). Furthermore, the fold changes observed at 4h were very−
similar to those obtained at 12h. In addition no significant regulation was found at 4h for the 7 genes that were not modulated at 12H.+ − +
The aim of this study was to identify differentially expressed genes in blood cells of morphine-dependent rats in spontaneous withdrawal situation. The large majority of studies carried out to date have used opioid receptor antagonist-precipitated withdrawal syndrome. However, this experimental approach greatly differs from the clinical setting where the opiate withdrawal syndrome occurs as a result of drug intake cessation. To better mimic these conditions, spontaneous withdrawal was evaluated. We observed classical signs used in behavioral studies and found low levels of withdrawal scores. Indeed spontaneous withdrawal induces milder behavioral modulation than the naloxone-precipitated one. As expected, the severity of opiate withdrawal varied as a function of the time interval between the last morphine administration and testing. In order to study the modifications in gene expressions in morphine-dependent rats and to minimize the transcriptional effects of withdrawal, the 12h time point was selected for microarray analysis. At this time point, withdrawal+
symptoms and loss of weight were at their minimum. At 36h, the withdrawal signs were maximum, and this time point was therefore selected for comparison with the 12h results. An additional time point (4h before the last injection) was chosen in order to assess the modulation of the selected candidate genes before the beginning of the withdrawal process.
Several studies have demonstrated characteristic blood genomic profiles for different brain disorders and neurologic diseases (Du et al. ; ; ). A study of gene expression in PBMCs from schizophrenic patients suggested a correlation , 2006 Tang et al., 2005 Tang et al., 2004
between the gene expression modulations patterns in PBMCs and the severity of the schizophrenic syndrome (Bowden et al., 2006). In the case of migraine suffering patients differential gene expression modulations were found in platelets as compared to control patients (
). Tang and coworkers also found a specific gene expression pattern in PBMCs from Tourette syndrome patients (
Hershey et al., 2004 Tang
). Moreover in the case of depression the low level of expression of alpha2a adrenergic receptors observed in the platelets of , 2005
et al.
depressive patients could be increase after a treatment with an antidepressive compound (Garcia-Sevilla et al., 2004). These results suggest a correlation between the gene expression regulations in the brain and the blood cells in these pathologies. The identification of an easily accessible tissue (blood) where modifications of gene expression following chronic morphine treatment could give insight to those occurring in the CNS would facilitate clinical research on the mechanisms of addiction in humans (Sullivan et al., 2006). In this study, we used PBMCs as a model to study blood expression profile following morphine treatment.
Our results describe the regulation of various genes and pathways in PBMCs of rats treated with morphine. 17 out the 24 tested genes were validated by quantitative real-time PCR at 12h. Interestingly the modulations observed on the last day of the morphine treatment+
were similar to those obtained at the 12h time point of the spontaneous withdrawal but evolved as the withdrawal state worsens. Among+
the regulated pathways in PBMCs some have been previously identified in vitro in transcription studies. Stefano et al have showed a regulation of apoptosis and cell adhesion genes in human peripheral blood leukocytes after acute morphine treatment (Stefano et al., 2005). In addition morphine has been shown to modulate immune responses (Eisenstein and Hilburger, 1998).
Interestingly, among the genes found regulated in PBMCs several have been previously reported to be involved in responses to morphine in different brain regions. The two major transcription pathways (Mapk and G protein coupled receptor) reported to be regulated by morphine treatment in brain (Asensio et al., 2006 Fan et al., 2002 Traynor and Neubig, 2005; ; ) were also found regulated in PBMCs. Opioid receptor activations lead to physiological responses via coupling to inhibitory guanine nucleotide-binding regulatory protein (Gold ), modulating several effectors, such as adenylyl cyclases, and voltage-gated Ca channels. In the present study, modulations , 2003
et al. 2+
of genes belonging to two major components of the development of opiate addiction were found in the PBMCs: the G-protein coupled receptor signalling (Gprk5, gng11, Rgs 10, Mir 16) and the cAMP signalling (Adcy5) pathways. Adcy5 has been shown to play an important role for the development of morphine behavioral effects (Kim et al., 2006). Nestler et al have shown that decreased activation of ERK1/2 might be relevant in modulating long lasting forms of synaptic plasticity in opiate addiction (Nestler, 2001). In the present study we observed an increase in the expression of several mitogen-activated protein kinases (Mapk7, similar to Mapkkkk5). Mapk pathway has been shown to be activated in various regions of rat brain by opioid receptors coupled to G-proteins (Schulz et al., 2004).
Electrophysiological studies have suggested a functional relationship between the opioid and serotoninergic systems in the rat prefrontal cortex involving the and Htr2a receptors (μ Marek, 2003). Moreover, an implication of Htr2a receptors in the dopamine release, locomotor response and behavioural sensitization to morphine has been demonstrated (Auclair et al., 2004). The present results showing a regulation of the serotonin receptor Htr2a by morphine treatment are consistent with these findings. Integrins are transmembrane receptors allowing the interactions of cells with the extracellular matrix (Uings and Farrow, 2000). They are involved in several cellular functions including the modulation of G-protein-coupled receptors signalling (Berg et al., 2007). In this study we found that morphine treatment upregulated two integrins genes (Itgb1 and Itga6) in rat PBMCs. Moreover, the severity of the withdrawal symptoms did not affect the expression of these two genes. Interestingly, Itgb1 has been recently shown to regulate opioid receptor signalling in sensory neurons (Berg
). , 2007 et al.
In conclusion, our data show that chronic morphine treatment induces transcriptional modifications in PBMCs that evolve with the withdrawal state of the animals. This suggests that PBMC gene expression patterns could be indicative of the disease stage. For some of the modulated genes the PBMC regulations confirmed previously reported brain modulations. In order to better characterize the correlations suggested here, a study of the modulation of the differentially regulated genes obtained in PBMCs, in brain structures involved
Page /6 12
in addiction, is currently carried out. This approach could help to identify important diagnostic/prognostic markers as well as potential therapeutic targets and mechanistic pathways.
Ackowledgements:
This work was supported by the Consortium national de recherche en genomique (CNRG) and the Mission Interministerielle de Lutte contre la Drogue et la Toxicomanie (MILDT).
References:
List of references
Al-Shahrour F, Minguez P , Tarraga J , Montaner D , Alloza E , Vaquerizas JM, Conde L , Blaschke C , Vera J , Dopazo J 2006; Babelomics: a systems biology perspective in the functional annotation of genome-scale experiments. Nucleic Acids Res. 34: W472- 476
Al-Shahrour F, Minguez P , Vaquerizas JM, Conde L , Dopazo J 2005; BABELOMICS: a suite of web tools for functional annotation and analysis of groups of genes in high-throughput experiments. Nucleic Acids Res. 33: W460- 464
Albertson DN, Schmidt CJ, Kapatos G , Bannon MJ2006; Distinctive profiles of gene expression in the human nucleus accumbens associated with cocaine and heroin abuse. Neuropsychopharmacology. 31: 2304- 2312
Ammon S, Mayer P , Riechert U , Tischmeyer H , Hollt V 2003; Microarray analysis of genes expressed in the frontal cortex of rats chronically treated with morphine and after naloxone precipitated withdrawal. Brain Res Mol Brain Res. 112: 113- 125
Asensio VJ, Miralles A , Garcia-Sevilla JA2006; Stimulation of mitogen-activated protein kinase kinases (MEK1/2) by mu-, delta- and kappa-opioid receptor agonists in the rat brain: regulation by chronic morphine and opioid withdrawal. Eur J Pharmacol. 539: 49- 56
Auclair A, Drouin C , Cotecchia S , Glowinski J , Tassin JP2004; 5-HT2A and alpha 1b-adrenergic receptors entirely mediate dopamine release, locomotor response and behavioural sensitization to opiates and psychostimulants. Eur J Neurosci. 20: 3073- 3084
Beitner-Johnson D, Guitart X , Nestler EJ1992; Neurofilament proteins and the mesolimbic dopamine system: common regulation by chronic morphine and chronic cocaine in the rat ventral tegmental area. J Neurosci. 12: 2165- 2176
Belcheva MM, Haas PD, Tan Y , Heaton VM, Coscia CJ2002; The fibroblast growth factor receptor is at the site of convergence between mu-opioid receptor and growth factor signaling pathways in rat C6 glioma cells. J Pharmacol Exp Ther. 303: 909- 918
Berg KA, Zardeneta G , Hargreaves KM, Clarke WP, Milam SB2007; Integrins regulate opioid receptor signaling in trigeminal ganglion neurons. Neuroscience. 144: 889-897
Bidlack JM2000; Detection and function of opioid receptors on cells from the immune system. Clin Diagn Lab Immunol. 7: 719- 723
Bowden NA, Weidenhofer J , Scott RJ, Schall U , Todd J , Michie PT, Tooney PA2006; Preliminary investigation of gene expression profiles in peripheral blood lymphocytes in schizophrenia. Schizophr Res. 82: 175- 183
Du X, Tang Y , Xu H , Lit L , Walker W, Ashwood P , Gregg JP, Sharp FR2006; Genomic profiles for human peripheral blood T cells, B cells, natural killer cells, monocytes, and polymorphonuclear cells: comparisons to ischemic stroke, migraine, and Tourette syndrome. Genomics. 87: 693- 703
Eisenstein TK, Hilburger ME1998; Opioid modulation of immune responses: effects on phagocyte and lymphoid cell populations. J Neuroimmunol. 83: 36- 44
Fan X, Zhang J , Zhang X , Yue W , Ma L 2002; Acute and chronic morphine treatments and morphine withdrawal differentially regulate GRK2 and GRK5 gene expression in rat brain. Neuropharmacology. 43: 809- 816
Ferrer-Alcon M, Garcia-Sevilla JA, Jaquet PE, La Harpe R , Riederer BM, Walzer C , Guimon J 2000; Regulation of nonphosphorylated and phosphorylated forms of neurofilament proteins in the prefrontal cortex of human opioid addicts. J Neurosci Res. 61: 338- 349
Ferrer-Alcon M, La Harpe R , Garcia-Sevilla JA2004; Decreased immunodensities of mu -opioid receptors, receptor kinases GRK 2/6 and beta -arrestin-2 in postmortem[ ] [ ] brains of opiate addicts. Molecular Brain Research. 121: 114- 122
Garcia-Sevilla JA, Ventayol P , Perez V , Rubovszky G , Puigdemont D , Ferrer-Alcon M, Andreoli A , Guimon J , Alvarez E 2004; Regulation of platelet alpha 2A-adrenoceptors, Gi proteins and receptor kinases in major depression: effects of mirtazapine treatment. Neuropsychopharmacology. 29: 580- 588
Gaveriaux-Ruff C, Matthes HW, Peluso J , Kieffer BL1998; Abolition of morphine-immunosuppression in mice lacking the mu-opioid receptor gene. Proc Natl Acad Sci U S A. 95: 6326- 6330
Gaveriaux C, Peluso J , Simonin F , Laforet J , Kieffer B 1995; Identification of kappa- and delta-opioid receptor transcripts in immune cells. FEES Lett. 369: 272- 276 Gold SJ, Han MH, Herman AE, Ni YG, Pudiak CM, Aghajanian GK, Liu RJ, Potts BW, Mumby SM, Nestler EJ2003; Regulation of RGS proteins by chronic morphine in rat locus coeruleus. Eur J Neurosci. 17: 971- 980
Hershey AD, Tang Y , Powers SW, Kabbouche MA, Gilbert DL, Glauser TA, Sharp FR2004; Genomic abnormalities in patients with migraine and chronic migraine: preliminary blood gene expression suggests platelet abnormalities. Headache. 44: 994- 1004
Hilburger ME, Adler MW, Rogers TJ, Eisenstein TK1997; Morphine alters macrophage and lymphocyte populations in the spleen and peritoneal cavity. J Neuroimmunol. 80: 106- 114
Kim KS, Lee KW, Lee KW, Im JY, Yoo JY, Kim SW, Lee JK, Nestler EJ, Han PL2006; Adenylyl cyclase type 5 (ACS) is an essential mediator of morphine action. Proc Natl Acad Sci U S A. 103: 3908- 3913
Li C, Wong WH2001; Model-based analysis of oligonucleotide arrays: expression index computation and outlier detection. Proc Natl Acad Sci U S A. 98: 31- 36 Marek GJ2003; Behavioral evidence for mu-opioid and 5-HT2A receptor interactions. Eur J Pharmacol. 474: 77- 83
Marie-Claire C, Courtin C , Roques BP, Noble F 2004; Cytoskeletal genes regulation by chronic morphine treatment in rat striatum. Neuropsychopharmacology. 29: 2208-2215
McCarthy L, Wetzel M , Sliker JK, Eisenstein TK, Rogers TJ2001; Opioids, opioid receptors, and the immune response. Drug Alcohol Depend. 62: 111- 123
McClung CA, Nestler EJ, Zachariou V 2005; Regulation of gene expression by chronic morphine and morphine withdrawal in the locus ceruleus and ventral tegmental area. J Neurosci. 25: 6005- 6015
Nestler EJ2001; Molecular basis of long-term plasticity underlying addiction. Nat Rev Neurosci. 2: 119- 128
Pacifici R, di Carlo S , Bacosi A , Pichini S , Zuccaro P 2000; Pharmacokinetics and cytokine production in heroin and morphine-treated mice. Int J Immunopharmacol. 22: 603- 614
Peterson PK, Gekker G , Brummitt C , Pentel P , Bullock M , Simpson M , Hitt J , Sharp B 1989; Suppression of human peripheral blood mononuclear cell function by methadone and morphine. J Infect Dis. 159: 480- 487
Rahim RT, Adler MW , Meissler JJ Jr , Cowan A , Rogers TJ , Geller EB , Eisenstein TK 2002; Abrupt or precipitated withdrawal from morphine induces immunosuppression. J Neuroimmunol. 127: 88- 95
Roy S, Wang J , Gupta S , Charboneau R , Loh HH, Barke RA2004; Chronic morphine treatment differentiates T helper cells to Th2 effector cells by modulating transcription factors GATA 3 and T-bet. Journal of Neuroimmunology. 147: 78- 81
Schulz R, Eisinger DA, Wehmeyer A 2004; Opioid control of MAP kinase cascade. European Journal of Pharmacology. 500: 487- 497
Sharp BM2006; Multiple opioid receptors on immune cells modulate intracellular signaling. Brain Behav Immun. 20: 9- 14
Sharp BM, Roy S , Bidlack JM1998; Evidence for opioid receptors on cells involved in host defense and the immune system. J Neuroimmunol. 83: 45- 56
Stefano GB, Burrill JD, Labur S , Blake J , Cadet P 2005; Regulation of various genes in human leukocytes acutely exposed to morphine: expression microarray analysis. Med Sci Monit. 11: MS35- 42
Sullivan PF, Fan C , Perou CM2006; Evaluating the comparability of gene expression in blood and brain. Am J Med Genet B Neuropsychiatr Genet. 141: 261- 268
Suzuki S, Chuang LF, Doi RH, Bidlack JM, Chuang RY2001a; Kappa-opioid receptors on lymphocytes of a human lymphocytic cell line: morphine-induced up-regulation
as evidenced by competitive RT-PCR and indirect immunofluorescence. Int Immunopharmacology. 1: 1733- 1742
Suzuki S, Chuang TK, Chuang LF, Doi RH, Chuang RY2001b; Morphine upregulates kappa-opioid receptors of human lymphocytes. Adv Exp Med Biol. 493: 81- 87
Suzuki S, Miyagi T , Chuang TK, Chuang LF, Doi RH, Chuang RY2000; Morphine upregulates mu opioid receptors of human and monkey lymphocytes. Biochem Biophys Res Commun. 279: 621- 628
Tang Y, Gilbert DL, Glauser TA, Hershey AD, Sharp FR2005; Blood gene expression profiling of neurologic diseases: a pilot microarray study. Arch Neurol. 62: 210- 215
Tang Y, Schapiro MB, Franz DN, Patterson BJ, Mickey FJ , Schorry EK, Hopkin RJ, Wylie M , Narayan T , Glauser TA, Gilbert DL, Hershey AD, Sharp FR2004; Blood expression profiles for tuberous sclerosis complex 2, neurofibromatosis type 1, and Down s syndrome’ . Ann Neurol. 56: 808- 814
Traynor JR, Neubig RR2005; Regulators of G prtein signaling and drugs of abuse. Mol Interv. 5: 30- 41
Uings IJ, Farrow SN2000; Cell receptors and cell signalling. J Clin Pathol. 53: 295- 299
Wick MJ, Minnerath SR, Roy S , Ramakrishnan S , Loh HH1996; Differential expression of opioid receptor genes in human lymphoid cell lines and peripheral blood lymphocytes. J Neuroimmunol. 64: 29- 36
Figure 1
a) Evolution of weight variation as compared to weight before the first injection, n 15 rats per treatment. Body weight of each rat was=
measured before the injection (twice daily from 5 days) or the observation (from 12h to 96h after the last injection). Three independent+
experiments were achieved. Results are expressed as mean .SEM. p<0.05, p<0.01, ± * ** *** p < 0.001, NS: non significant Two-way repeated measure ANOVA. b) Evolution of global withdrawal score. Mean SEM of opiate withdrawal score (n 15 rats per treatment) at 12h, 18h± = + +
Page /8 12
Figure 2
812 gene transcripts were identified, 596 up-regulated and 215 down-regulated genes under morphine treatment. Only 276 were identified as distinct gene. Data were presented according to Gene ontology classification of the biological processes most frequently involved by the 276 genes. The percentage distribution of up- and down-regulated genes with GO annotation in each category of biological process was shown. Each asterisk ( ) represent a significant differential regulation in the category compared (p<0.05 by Fisher).*
Table I
Primer sequences used for SYBR Green-based real-time quantitative polymerase chain reaction.
Gene gene forward primer (sense) gene reverse primer (antisense)
Adcy5 5 ATGGGTCTGCTTTTCCACT 3′ ′ 5 GGAGGTGTGAGGAGAGAATG 3′ ′
Adk 5 TGAGCGTTCCTGCCTTGA 3′ ′ 5 CCCTCTACGGTAATAATG 3′ ′
Anxa3 5 CTGTGGAGGAGATGATTGAAGA 3′ ′ 5 TCGTACAGCACTCCAGCA 3′ ′
Ap1s1 5 CTCCAGCCCTACATACAAAC 3′ ′ 5 CCCTAAAGCCTTCAGTGG 3′ ′
Bmf 5 GAGCCAAGTAGTCAGTTACCAC 3′ ′ 5 GTCCAATCCAGTCCAGTCAT 3′ ′
Camk4 5 CATCCTACACCCTCCACAAGTCT 3′ ′ 5 ACAAGGCTGGTCCCCCTC 3′ ′
Capn2 5 CAGCAAGCCCTCTTAGACT 3′ ′ 5 TCTGAGCCCTGTTCTCC 3′ ′
Fgl2 5 TATCGCTTTTTGGCTGAACA 3′ ′ 5 AGAGGCTGAAGACATTTGCT 3′ ′
Gng11 5 TCCAGAAGACAAGAATCCC 3′ ′ 5 ATTTCCCTCCAGAGTTCCT 3′ ′
Gprk5 5 ACTTGGAAGCAGAACTTGTAAC 3′ ′ 5 TGGGGGAACAGTATCCTATC 3′ ′
Htr2a 5 CAGGCGAGTCACAGGATAG 3′ ′ 5 CACAGCAGTAAAAGACAGCA 3′ ′
Itga6 5 GAAGTGAGGACCCTTGCTGATG 3′ ′ 5 CGAACCTGTGCCTTAGTGACAA 3′ ′
Itgb1 5 AAAGCAAATGCCAAATCTTGTG 3′ ′ 5 TTCCTTCTTGTAAAAATGTCGTA 3′ ′
Mapk7 5 CCCGCTGACATTGAGTCT 3′ ′ 5 GTGGGTCTCAGGGTTCTTG 3′ ′
Mapk8ip3 5 TGGAGAGCAACTGACAAGA 3′ ′ 5 AGTGCCCCTGAAGAGTAAG 3′ ′
Mir16 5 AAAGGAATCCAGGTTGTTAGTT 3′ ′ 5 CAAGGTGGGACTCGTAGTAAT 3′ ′
Nckap1 5 GGAAGCAGACTCAGTTTCTC 3′ ′ 5 CAGCAGGGTCCAAGGTAG 3′ ′
Ptpn22_predicted 5 CAAGCAAGCCTACAGAATG 3′ ′ 5 TGGTCCTTTGGGTTTTG 3′ ′
Ralgps2 5 GAAGGCAAAAAACCCACAGT 3′ ′ 5 CCACCACAGACACATTCTTA 3′ ′
Rasgrp2 predicted 5 GAAGCCTTTGATGACTCTGG 3′ ′ 5 GGGATTGCTGATAGAAGTGG 3′ ′
similar to Mapkkkk5 isoform 2 5 CTCACAGCAATCTCTACATCC 3′ ′ 5 CATTCGTCGTCTTGTCACT 3′ ′
Rgs10 5 GGCGGACTGAGGAAGAG 3′ ′ 5 CACAACAAAGCAATGACATC 3′ ′
RPLP0 5 GGGGCCACCTGGAGAACAAC 3′ ′ 5 GCA GCA GCT GGC ACC TTA TTG 3′ ′
SOD2 5 GGCTTGGCTTCAATAAGGAG 3′ ′ 5 ATCCCCAGCAGTGGAATA 3′ ′
Timp3 5 GAAGCCTCTGAAAGTCTCTG 3′ ′ 5 CCCACCTCTCCACAAAGT 3′ ′
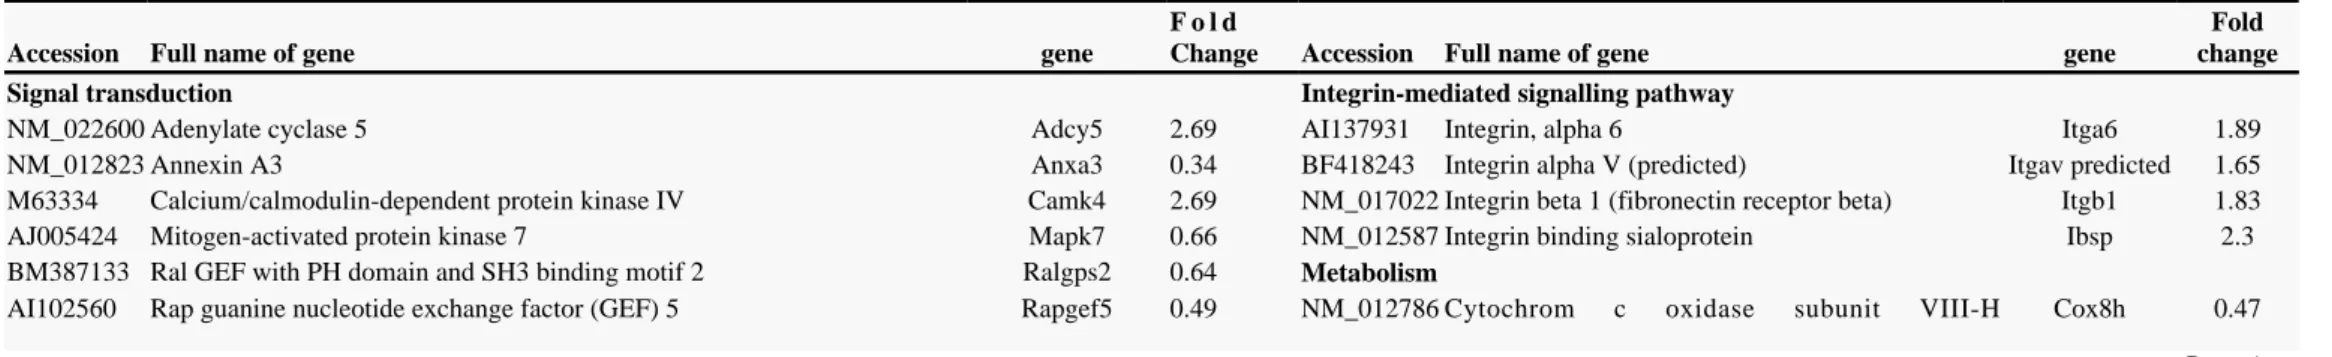
Table II
Affymetrix data at 12h of selective genes. Fold changes compare PBMC s treated rats to PBMC s saline rats. In bracket, fold change of different probe sets on the array’ ’
Accession Full name of gene gene
F o l d
Change Accession Full name of gene gene
Fold change
Signal transduction Integrin-mediated signalling pathway
NM_022600 Adenylate cyclase 5 Adcy5 2.69 AI137931 Integrin, alpha 6 Itga6 1.89
NM_012823 Annexin A3 Anxa3 0.34 BF418243 Integrin alpha V (predicted) Itgav predicted 1.65
M63334 Calcium/calmodulin-dependent protein kinase IV Camk4 2.69 NM_017022 Integrin beta 1 (fibronectin receptor beta) Itgb1 1.83 AJ005424 Mitogen-activated protein kinase 7 Mapk7 0.66 NM_012587 Integrin binding sialoprotein Ibsp 2.3 BM387133 Ral GEF with PH domain and SH3 binding motif 2 Ralgps2 0.64 Metabolism
Page /10 12
(heart/muscle)
BI279720 RAS-like, family 12 (predicted) Rasl12 predicted 0.64 M58041 Cytochrome P450, family 2, subfamily c, polypeptide 70
Cyp2c70 0.33 AI577569 RAS protein-specific guanine nucleotide-releasing factor 1 Rasgrf1 3.97 NM_031509 Glutathione S-transferase A3 Gsta3 2.57 AA945062 Rho GTPase activating protein 8 Arhgap8 0.38 NM_012796 Glutathione S-transferase, theta 2 Gstt2 1.61 BF396580 Rho GTPase activating protein 5 similar to mitogen-activated Arhgap5 Similar 0.39 U48220 Cytochrome P450, family 2, subfamily d,
polypeptide 22
Cyp2d22 1.88 BI291366 protein kinase kinase kinase kinase 5 isoform 2 (predicted) Mapkkkk5
isoform 2
2.23 Cell differenciation
G-protein coupled receptor protein signaling pathway NM_019242 Interferon-related developmental regulator 1 Ifrd1 1.55 NM_017254 5-hydroxytryptamine (serotonin) receptor 2A Htr2a 1.74 NM_012731 Neurotrophic tyrosine kinase, receptor, type 2 Ntrk2 1.62 L03202 5-hydroxytryptamine (serotonin) receptor 6 Htr6 0.64 AB049572 sphingosine kinase 1 Sphk1 1.73 X69663 5-hydroxytryptamine (serotonin) receptor 7 Htr7 1.67 Inflammatory
BG379920 Adenosine A3 receptor Eaf2/Adora3 1.6 NM_013123 Interleukin 1 receptor, type 1 II1r1 1.78
NM_012768 Dopamine receptor D5 Drd5 1.8 Transcription
AI012890 G protein-coupled receptor 43 Gpr43 2.5 BE096021 Jun D proto-oncogene Jund 4.5
BF404188 G protein-coupled receptor 137B (predicted) Gpr137b 2.01 BG666291 Kruppel-like factor 7 (ubiquitous) (predicted) Klf7 predicted 2.2 NM_030829 G protein-coupled receptor kinase 5 Gprk5 2.08 Immune response
NM_022396 Guanine nucleotide binding protein (G protein), gamma 11 Gng11 1.57 BF403233 RT1 class Ib, locus M3 RT1-M3 2.31 NM_031034 Guanine nucleotide binding protein, alpha 12 Gna12 1.67 BI292055 RT1 class Ib, locus Aw2 RT1-Aw2 0.45 BE117491 Guanine nucleotide binding protein, alpha q polypeptide Gnaq 1.54 NM_031530 chemokine (C C motif) ligand 2– Ccl2 0.18 BI293698 HtrA serine peptidase 3 (predicted) Htra3 predicted 0.56 Others functions
NM_022800 purinergic receptor P2Y, G-protein coupled 12 P2ry12 2.77 BI298352 Adaptor-related protein complex 3, beta 2 subunit (predicted)
Ap3b2 predicted
2.83
Transport U90340 Adenosine kinase Adk 1.82
NM_031760 ATP-binding cassette, sub-family B (MDR/TAP), member 11 Abcb11 1.54 NM_017135 Adenylate kinase 3-like 1 Ak3l1 1.92 NM_080582 ATP-binding cassette, sub-family B (MDR/TAP), member 6 Abcb6 1.77 NM_031518 Cd200 antigen Cd200 0.37
Apoptosis BF565278 DnaJ (Hsp40) homolog, subfamily A, member 4 Dnaja4 2.01
NM_139258 Bcl2 modifying factor Bmf 1.93 BF404861 DnaJ (HSP40) homolog, subfamily C, member 14 Dnajc14 0.43
NM_019127 interferon beta 1, fibroblast Ifnb1 0.51 AF323608 Fibrinogen-like 2 Fgl2 1.85
BM383722 NCK-associated protein 1 Nckap1 2.55 NM_133286 fibroblast growth factor 8 Fgf8 2.38
AI009159 Tissue inhibitor of metalloproteinase 3 (Sorsby fundus dystrophy, pseudoinflammatory)
Timp3 2.93 BE107694 G protein-coupled receptor kinase-interactor2 Git2 1.64
Calcium ion transport BF404562 Gamma-aminobutyric acid A receptor, gamma 2 Gabrg2 1.89 AF361341 Calcium channel, voltage-dependent, gamma subunit 4 Cacng4 1.62 AF090113 Glutamate receptor interacting protein 2 Grip2 2.39 AF394940 Calcium channel, voltage-dependent, L type, alpha 1C subunit Cacna1c 0.66 BM391206 Histone 1, H2bh Hist1h2bh 1.59 AF290212 Calcium channel, voltage-dependent, T type, alpha 1G subunit Cacna1g 2.3 X00336 Interferon-alpha 1 Ifna1 0.58 NM_031601 Calcium channel, voltage-dependent, T type, alpha 1H subunit Cacna1h 1.83 NM_012983 Myosin ID Myo1d 2.91
Cell adhesion AI045505 Myosin X (predicted) Myo10
predicted
0.5 NM_022184 Calcium/calmodulin-dependent serine protein kinase (MAGUK family) Cask 0.58 NM_012604 myosin, heavy polypeptide 3, skeletal muscle,
embryonic
Myh3 1.87
AF065147 CD44 antigen Cd44 1.54 NM_013194 myosin, heavy polypeptide 9, non-muscle Myh9 1.58
NM_031699 Claudin 1 Cldn1 2.14 AA955815 Ribosomal protein S6 kinase, polypeptide 5 (predicted)
Rps6ka5 predicted
Blood coagulation BG671549 Superoxide dismutase 2, mitochondrial Sod2 2.11
NM_022924 Coagulation factor II F2 0.49
NM_021698 Coagulation factor XIII, A1 subunit F13a1 2.35
Table III
Validation and evolution of differentially regulated genes by quantitative RT-PCR at 4h, 12h and 36h of the last morphine injection. Data represent fold change in PBMCs of morphine treated rat (n− + + =
12 14) as compared to saline treated rats (n 10 12).– = –
Gene −4H +12H +36H Adcy5 1.93*** ↗ 2* ↗ 0.39** ↘ Anxa3 nd 1.88* ↗ 0.5** ↘ Camk4 1.24* ↗ 1.38* ↗ 0.75* ↘ Mir16 1.37** ↗ 1.39*** ↗ 0.74* ↘ Rasgrp2 1.16* ↗ 1.22* ↗ 1.27* ↗ Itga6 1.84*** ↗ 1.6** ↗ 1.81* ↗ Adk 1.58** ↗ 1.67** ↗ 1.1 – Capn2 1.52** ↗ 1.4* ↗ 0.98 – Fgl2 1.95** ↗ 1.6* ↗ 1.01 – Gng11 2.22* ↗ 2.17** ↗ 0.98 – Gprk5 2.43*** ↗ 1.56* ↗ 1.01 – Itgb1 1.69** ↗ 1.59** ↗ 0.98 – Nckap1 2.57* ↗ 1.69* ↗ 0.98 – Rgs10 1.5** ↗ 1.46** ↗ 0.97 – Sod2 2** ↗ 2.44** ↗ 1.02 – Timp3 2.97** ↗ 2.14** ↗ 1.09 – Ap1s1 1.18* ↗ 1.36* ↗ 0.97 – mapk8ip3 1.21 – 1.18 – 0.64* ↘ Htr2a nd 1.38 – 0.46** ↘ Ralgps2 1.02 – 1.22 – 0.29 – Bmf 0.83 – 0.19 – nd Mapk7 1.13 – 0.38 – nd Ptpn22 predicted 1.08 – 1 – nd
similar to Mapkkkk5 isoform 2 0.97 – 0.63 – nd
Statistical analysis was done by Student test
*
Page /12 12
**
p<0.01,
***