HAL Id: hal-01266599
https://hal.archives-ouvertes.fr/hal-01266599
Submitted on 3 Feb 2016HAL is a multi-disciplinary open access archive for the deposit and dissemination of sci-entific research documents, whether they are pub-lished or not. The documents may come from teaching and research institutions in France or abroad, or from public or private research centers.
L’archive ouverte pluridisciplinaire HAL, est destinée au dépôt et à la diffusion de documents scientifiques de niveau recherche, publiés ou non, émanant des établissements d’enseignement et de recherche français ou étrangers, des laboratoires publics ou privés.
Deep HDS of FCC gasoline over alumina supported
CoMoS catalyst: Inhibiting effects of carbon monoxide
and water
Florian Pelardy, Antoine Daudin, Elodie Devers, Céline Dupont, Pascal
Raybaud, Sylvette Brunet
To cite this version:
Florian Pelardy, Antoine Daudin, Elodie Devers, Céline Dupont, Pascal Raybaud, et al.. Deep HDS of FCC gasoline over alumina supported CoMoS catalyst: Inhibiting effects of carbon monoxide and water. Applied Catalysis B: Environmental, Elsevier, 2016, 183, pp.317-327. �10.1016/j.apcatb.2015.10.026�. �hal-01266599�
Deep HDS of FCC gasoline over alumina supported CoMoS catalyst: inhibiting
effects of carbon monoxide and water.
Florian Pelardy1, Antoine Daudin2, Elodie Devers2, Céline Dupont2,a, Pascal
Raybaud2 and Sylvette Brunet1*
1
Université de Poitiers, Institut de Chimie des Milieux et Matériaux de Poitiers (IC2MP), UMR 7285 CNRS-, 4 rue Michel Brunet, TSA 71106- 86073 Poitiers Cedex9, France
2
IFP Energies nouvelles, Rond-point de l’échangeur de Solaize, BP 3, 69360 Solaize, France
a
current address : ICB, UMR 6303, Université de Bourgogne CNRS, 21078 Dijon, France
*
Corresponding author: email sylvette.brunet@univ-poitiers.fr (Sylvette Brunet)
Tel: (+33) 5 49 45 36 27 Fax: (+33) 5 49 45 38 97
Abstract
The selective hydrodesulfurization (HDS) of FCC gasoline is a key catalytic process for reducing sulfur content in gasoline. In the present work, we focus on the effect of
H2O amount alone or in mixture with CO on the transformation of a model FCC
gasoline composed of 2-methylthiophene (2MT) and 2,3-dimethylbut-2-ene (23DMB2N) molecules, over an alumina supported CoMoS catalyst. A negative impact of water and CO on the conversion of 2MT and 23DMB2N is found. However the effect in the presence of CO is much stronger. The comparison of Density Functional Theory (DFT) calculations of CO and water adsorption on the S- and M-edge sites of the CoMoS slabs shows a significantly stronger CO adsorption energy than water adsorption energy. When CO and water were introduced simultaneously, the negative impact observed in the transformation of the model feed is mainly due only to the presence of CO. However whatever the oxygenated molecules used and their amount, no impact in the selectivity measured by the ratio between the activity in hydrodesulfurization and in hydrogenation is observed.
Highlights
- weak decrease of the HDS and HYD activity of the gasoline model feed in the presence of water, and partially irreversible
- main inhibiting effect induced by CO rather than water, but completely reversible - higher adsorption energy of CO than water quantified by DFT calculations
Keywords:
Hydrodesulfurization, olefin hydrogenation, FCC gasoline, carbon monoxide, CoMoS/Al2O3,
1 Introduction
European Union will impose to incorporate renewables energies (including biofuels) with an energetic yield of 10% in 2020, into transportation sector [1]. This means that, in the coming years, the hydrotreatment process of petroleum would have to process feeds containing oxygenated compounds from vegetable oils or lignocellulosic biomass since liquids from theses starting materials present a high oxygen content (between 20-40%) (containing acid, ester, alcohol functions …) [2-5]. Oxygenates conversion leads to the
formation of by-products such as CO, CO2 or H2O [6]. Until now, oxygenated compounds
present in the flow such as CO (often up to 100 ppm) and H2O come from gas recycle used in
hydrotreating processes or from the feed itself. For example, those compounds can be
provided by H2 production unit such as steam reforming or partial oxidation processes [6].
Now, the development of methods for producing fuels from renewable resources could increase the amount of these kinds of products. Indeed, lignocellulosic biomass requires a gasification or pyrolysis to convert respectively into syn gas or liquid. The syngas can then be converted by Fischer-Tropsch process to obtain high quality paraffinic fuel. To enhance the liquid biomass as fuel, it is essential to achieve a deep deoxygenation, to stabilize and make them compatible with the current petroleum fuels. One of the most economical solutions for refiners could be the co-processing of biomass derived feedstocks with FCC gasoline in a
conventional hydrotreating unit to carry out deep hydrodesulfurization and
hydrodeoxygenation simultaneously. However, it appears today that the oxygenated compounds present in these renewable feedstocks could be too refractory to be treated simultaneously under operating conditions of FCC gasoline. Moreover, their decomposition is
an additional source of carbon oxides (CO, CO2) and H2O which may impact
hydrodesulfurization and hydrogenation reactions. However, reliable data are very scarce in the literature and need to be more understood. The implementation of such a process of
co-treatment (hydrodeoxygenation-hydrodesulfurization) therefore requires knowledge of the complex interactions that exist between the sulfur compounds, olefins and oxygenates. It is thus important, by using model molecules, to identify the reactions involved in order to acquire the scientific knowledge necessary for the understanding of systems consisting of actual expenses. In fact the final gasoline products must contain no more than 10 ppm of sulfur as imposed by European legislation regulation and whatever the composition of the initial feed [1].
Recently, various published works reported the impact of oxygenated model molecules on the hydrodesulfurization of sulfur compounds from straight run gas oil. Results showed that depending on the composition of the feed and oxygenates, inhibiting effect could be observed on the HDS activity of conventional catalysts. For example, Pinheiro et al [7] showed that under industrial operating conditions (T= 623 K, P=4 MPa), oxygenated model compounds (such as 2-propanol, cyclopentanone, anisole, and guaiacol) were totally converted and their decomposition leading only to water as by-products, which did not inhibit
catalytic CoMoS/Al2O3 performances on the transformation of a standard straight-run gas oil.
On contrary, oxygenated compounds leading to CO and/or CO2 formations (for example
carboxylic acid and ester such as propanoic acid and ethyldecanoate) had a strong inhibiting
effect whatever the hydrotreatment reactions (hydrodesulfurization (HDS),
hydrodenitrogenation (HDN), and hydrogenation of aromatics (HDA)). This could be due to competitive adsorptions not only directly by the oxygenated reactants themselves but also by
CO and/or CO2 with molecules to be treated contained in SRGO feedstocks. Moreover, these
results are consistent with the interpretation proposed in previous works [8-10] claiming that the inhibitions obtained in the presence of acid and ester compounds are due to the reaction
products CO and CO2. With that respect density functional theory (DFT) studies have also
shown that CO must be considered as a much stronger inhibitor than guaiacol [11], alcohol or carboxylic acid [12-14]. If we considered the impact of oxygenates model molecules on the
transformation of model sulfur compounds, Philippe et al [10] demonstrated that the real inhibitor was CO and also the carboxylic acid function (using decanoic acid as model molecule) itself more than phenolic compounds (guaiacol and phenol) on the HDS of DBT and 46DMDBT attributed to competitive adsorptions. In HDS of a model feed representative of FCC gasoline under various operating conditions (T=523 K, P = 15 kPa), Pelardy et al [15] confirmed the strong impact of CO in the HDS of 2-methylthiophene and the hydrogenation of 2,3-dimethylbut-2-ene in mixture representative of sulfur compounds and alkenes in FCC gasoline. The authors explained these results by the higher adsorption energy than other compounds (sulfur and alkenes) determined by density functional theory (DFT) calculations. CO adsorbed on mixed CoMoS sites on S-edge and M-edge explains the loss in HYD and HDS activities. If various works reported that water has no effect on? the catalytic activity in HDS of gas oils [7,8,10], when CO and water were present in mixture, two supplementary reactions can occur : Water Gas Shift (WGS) and Reverse Water Gas Shift (RWGS) [9,10]. In
this case, Pinheiro et al. [9] reported that the inhibition was due to the amount of CO or CO2
introduced whatever the distribution of CO, CO2, or CH4 products obtained by water gas shift
or methanation reactions. Philippe and coworkers [10] showed that only CO was the real contaminant in the sulfur model molecules (DBT and 46DMDBT) transformations.
Finally, the successful hydrotreatment of oxygenated compounds into refinery processes required the limitation of inhibiting compounds formation by a selective catalytic liquefaction of biomass and/or by the development of a catalyst specific to selective oxygen removal, which will favor the hydrogenation/hydrogenolysis reactions instead of the decarboxylation or decarbonylation reaction. Recent theoretical (DFT) and experimental
works have thus highlighted the impact of the nature of the sulfide active phases, either MoS2,
NiMoS or NiSx, on the hydrodeoxygenation and decarbonylation pathways [12,13]. An
alternative is also to use a catalyst non sensitive to CO or CO2. As reported recently by
presence of CO during the HDO of 2-ethylphenol a model compound of lignocellulosic materials.
The present paper focuses on the effect of CO and H2O, main by-products of biomass
transformation, on the HDS of a model FCC gasoline under conditions close to deep
hydrotreating of gasoline over a CoMoS/Al2O3 catalyst. The model molecules chosen were
2-methylthiophene and 2,3-dimethylbut-2ene as previously studied [15,16,17,18]. The effect of water alone and in mixture with CO was studied in the transformation of the two model molecules separately and in mixture. The interpretation of the experimental results was carried out with the help of theoretical calculations (DFT) of water adsorption on CoMoS edge sites.
2 Experimental
2.1 Catalyst and chemicals
A commercial CoMo catalyst was used, containing 3 wt% CoO and 10 wt% MoO3
supported on alumina, provided by IFPEN. The catalyst has been crushed and sieved to a
250-315 µm size range and sulfided in situ under H2S/H2 flow (10 mol% H2S) for 10 h at 673
K at atmospheric pressure.
2-methylthiophene (98% purity) has been purchased from Alfa Aesar, 2,3-dimethylbut-2-ene (98% purity) from Acros Organics, o-xylene (>99% purity) from Fluka and n-heptane (>99% purity) from Carlo Erba. Chemicals have been used without further purification.
Catalytic activity measurements were carried out in a fixed bed reactor at 523 K under
a total pressure of 2 MPa with a ratio H2/feed of 360 NL/L.
Three different types of feeds were studied [15]:
(i) a thiophenic feed containing 0.3 wt% of 2MT in n-heptane (corresponding to 1000 wt ppm of sulfur or a partial pressure of 3 kPa),
(ii) an olefinic feed containing 20 wt% of 23DMB2N (corresponding to a partial
pressure of 150 kPa) diluted in n-heptane with an additional 1000 wt ppm of H2S (2 kPa)
(corresponding to a 2MT total conversion)
(iii) a model feed FCC gasoline containing 0.3 wt% of 2MT, 20 wt% of 23DMB2N, and 30 wt% of o-xylene (representing aromatics) diluted in n-heptane.
The various feeds were injected in the reactor by a HPLC Gilson pump (307 series,
pump's head: 5 cm3). The water was injected separately in the reactor using another HPLC
Gilson pump (307 series, pump's head: 5 cm3) and CO by a gas flowmeter.
In these experimental conditions, all the components are in the gas phase.
The impact of water alone and of a mixture of water and CO (H2O/CO molar ratio
from 106 to 352) on the transformation of the model feeds has been evaluated according to the experimental procedure describe below. Each model feed has been studied on separate experiments including different steps [15]:
Step 1: Transformation of the model feed alone (up to a conversion close to 30%), Step 2: Transformation of the model feed in the presence of various amount of
oxygenated compounds (H2O or CO/H2O mixture), at the same contact time of the
step 1,
Step 3: Change of contact time (keeping constant the amount of oxygenated compounds) to reach the reference conversions (Step 1) in order to investigate an eventual modification of the products selectivity,
Step 4: Come back to the initial conditions used at Step 1 in order to investigate the catalyst deactivation and the modification of the selectivity.
The different partial pressures of the reactants were calculated for each feed (Table 1). O-xylene and n-heptane were not converted under these experimental conditions. The amounts of water and CO added to the various feeds are reported on Table 2. More particularly, the partial pressures of CO and water in the global feed and the corresponding amounts of CO in hydrogen and of water in the liquid feeds are given. When CO and / or water were added, the
partial pressures of 2MT, alkenes and the ratio H2/feed were kept constant.
2.3 Products analysis
The reaction products has been analysed on-line to the fixed bed unit by means of Varian gas chromatograph equipped with an automatic sampling valve as described in our previous works [15,16,17]. Desulfurized products, resulting from the transformation of 2-methylthiophene are designated as HDS products. The selectivity of the reaction was calculated by the ratio between hydrodesulfurization (HDS) and olefin hydrogenation (HYD) rate constants, assuming ideal plug flow reactor in gas phase and first order reactions, as defined by Dos Santos et al. [19]. HDS and HYD activities were measured after stabilization of HDS and HYD products formation, respectively and under conditions where a linear relationship between conversion and residence time has been obtained (for a yield in HDS products around 30% and a yield in hydrogenation products around of 30% - all yields and conversions are expressed in molar fraction). The residence time is defined as the ratio between the catalyst weight and the mass liquid feed flow rate. Regarding the transformation of the 2-methylthiophene, HDS products (mainly pentanes and pentenes) are the main
1). The transformation of the 2,3-dimethylbut-2-ene (23DMB2N) leads to the formation of isomerization products (mainly 2,3-dimethylbut-1-ene, 23DMB1N) and hydrogenation
products (mainly 2,3-dimethylbutane, 23DMB) as described previously (Scheme 2). The
double bond isomerization of 23DMB2N to 23DMB1N is known to be very fast on transition metal sulfide catalysts, compared to HYD reaction so that the mixture composed of
23DMB2N and 23DMB1N is considered as the main reactant [17,18]. The hydrogenation
activity has been measured with the formation of 23DMB which was the main hydrogenation product. Skeletal isomers and their hydrogenated products have been obtained with a yield of less than 1%. To obtain the desired conversion, the residence time has been modified by changing the amount of catalyst used (between 0,075 g and 0,5 g) or the volumic feed flow rate (0.05 to 8 mL/min). The catalyst activity (±2%) in hydrodesulfurization corresponding also to the transformation of 2MT is defined as the number of moles of HDS products formed by hour and by gram of catalyst and the catalyst activity (±2%) in hydrogenation is defined as the number of moles of 23DMB formed by hour and by gram of catalyst.
Carbon monoxide, carbon dioxide and methane have been analyzed online by a Varian 3800 chromatograph equipped with an automatic sampling valve, two Porapack columns 1mx1/8"x2mm, a methanizer and a flame ionization detector. A backflush procedure has
allowed the elimination of H2S and any other organic compounds (which could poison the
methanizer Ni catalyst). Under these experimental conditions and whatever the composition of the model feed, the carbon monoxide has not been converted when it is introduced alone in the reactor. In all cases molar balance were closed to 100%.
2.4 DFT calculations
Similar DFT calculations were carried out for H2O as previously described for CO
adsorption on CoMoS systems [15]. Periodic density functional theory calculations have been performed using the VASP code [20,21]. General gradient approximation with PW91 [22,23]
for the exchange correlation functional and the projector augmented-wave (PAW) [24] have been used. The cut-off energy for the plane-wave basis was fixed to 500 eV and the Brillouin
zone integration is performed on a (3×3×1) Monkhorst-Pack k-point mesh. The geometry
optimization has been completed when forces become smaller than 0.05 eV.Å-1.
Periodic supercells of CoMoS have been modeled according to the theoretical analysis by Krebs et al. [25] The supercells represent the M-edge and S-edge with two promoter edge contents (50% and 100%) and various sulfur coverages corresponding to the most stable states as a function of sulfo-reductive conditions given by the chemical potential of sulfur [25]. In particular, the fully (100% Co) and partially (50% Co) promoted M-edge and the fully (100% Co) promoted S-edge will be considered here. DFT calculations have shown that the edge structures of the CoMoS active phase are not modified in presence of water and in sulfo-reductive conditions. [26].
So the competitive adsorption of H2O with 2MT and 23DMB1N was carried out using the
same approach as proposed in previous works by Krebs et al. [27] and Pelardy et al. [15] Equations developed in this thermodynamical model have enabled to take into account
experimental conditions, in particular the temperature, the p(H2S)/p(H2) ratio and the partial
pressures of reactants (2MT, 23DMB1N) and water. Then the evolution of the edge energy in
presence of the adsorbed molecules has been calculated as a function of the p(H2S)/p(H2)
ratio. Hence the edge energy in the presence of adsorbed H2O is defined by:
N O H G O H edge ads edge ) ( ) ( 2 =
σ
+∆ 2σ
(1) where ) ( ) ( ) ( ln ) ( ) ( 2 2 2 2 2 2 O H G O H G O H G P P RT O H E O HG trans rot vib
o O H ads ads +∆ +∆ +∆ + ∆ = ∆ , and
edge
σ
corresponds to the edge energy without any adsorbed molecule with N the number ofedge metallic atoms.
The same definition has been developed for
σ
edge(
23
DMB
1
N
)
andσ
edge( MT
2
)
.To calculate the partition functions of the Gibbs free energy of the adsorbed and gas phase molecules, we have used rigorously the same methodology and approximations as in our previous theoretical works [15,27]
Finally, the adsorption selectivity has been described by the selectivity index, ∆σedge ,
defined as the difference of the edge energies of two adsorbed molecules, A and B: ∆σedge
(A-B) = σedge(A)-σedge(B). ∆σedge is expressed in eV per edge atom and a negative value of
∆σedge(A-B) indicates a selective adsorption of molecule A to the detriment of molecule B.
2.5 Characterizations.
XRD analyses were carried out on a PANalytical EMPYREAN powder diffractometer using
CuKα radiation source (Kα1 = 1.5406 Å and Kα2 = 1.5444 Å) in order to reveal the
crystallographic structure of each sample. These patterns were collected with a 0.033° step and 120 s dwell time at each step between 20 and 140°. Phase identification was performed by comparison with the ICDD database reference files.
The morphology was evaluated by Transmission Electronic Microscopy (TEM), using a
JEOL 2100 instrument (operated at 200 kV with a LaB6 source and equipped with a Gatan
Ultra scan camera).
XPS spectra were recorded using a KRATOS AXIS Ultra spectrometer equipped with a
(150w) Al Ka monochromatic source (hυ = 1486.6 eV). Catalysts were packed in shlenk
under argon to avoid sulfate formation. They were identified with reference samples drawn from the Handbook of X-ray photoelectron spectroscopy [28], NIST X-ray Photoelectron Spectroscopy Database (NIST Standard Reference Database 20, Web Version 3.4). The calibration has been made with the carbon peak of contamination identified at 284.6 eV. For
each catalyst, the metal and sulfur peaks have been identified according to their binding energies [29]. The elemental surface composition of the catalysts, and therefore, the sulfur/metal atomic ratio (S/Me) and the active phase evolution after reaction were determined from the area of the metal and sulfur peaks (the uncertainty of the value is around 20%).
The carbon analysis of the CoMoS/Al2O3 catalyst was carried out with an elementary
analyzer (NA2100 analyser, CE instruments).
3 Results
3.1 Influence of H2O on 2MT and 23DMB2N alone or in mixture
The effect of water on the conversion of 2MT and alkenes alone and on the model feed has been studied for various partial pressures in the range of 75 to 462 kPa. An inhibiting effect of water on the transformation of each model molecule (2MT and 23DMB2N) measured separately or with the model feed is clearly showed Fig. 1. The loss of activity measured by the ratio between the activity in the presence of water (A) and the activity
without water (A0) is around the same for the two model molecules transformation measured
alone or separately. This inhibiting effect of water continues to rise when the amount of water introduced increases (Fig. 2).
3.2 Influence of H2O and CO in 2MT and 23DMB2N transformation alone or in mixture
When CO and H2O were injected simultaneously, side reactions should be considered. Under
deep HDS operating conditions (523K, 2MPa) and in presence of CoMoS/Al2O3 catalyst, the
transformation of CO alone or in the presence of water could involve different reactions as
reported below: methanation of CO or CO2 (equation (1) and (3)) and water gas shift reaction
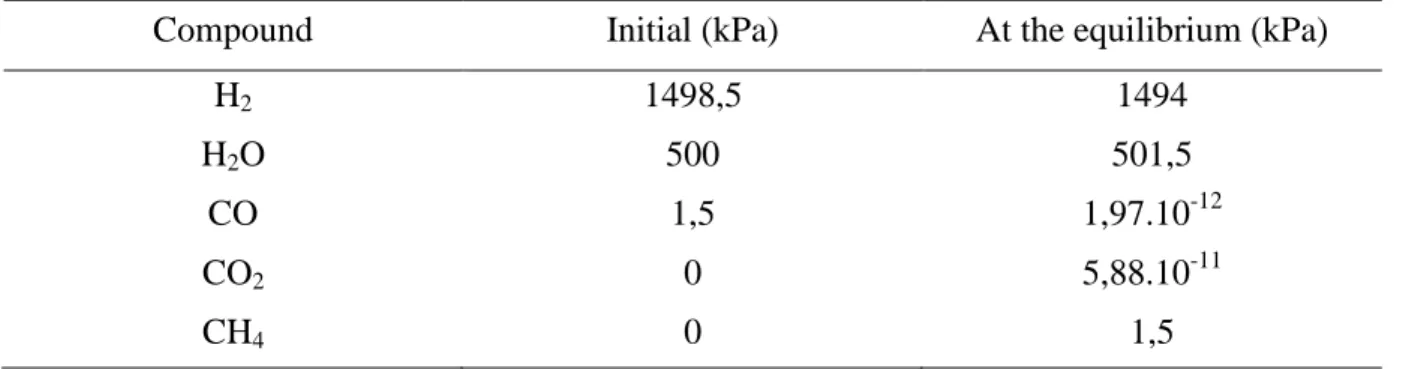
CO + 3H2 CH4 + H2O (2) Keq(250°C) = 1.1 109 CO + H2O CO2 + H2 (3) Keq(250°C) = 89 CO2 + H2 CH4 + 2H2O (1) Keq(250°C)= 1.3 107
The water gas shift (WGS) and methanation reactions from CO or CO2 are
thermodynamically favoured. Under these operating conditions the composition at the equilibrium state could be calculated considering the initial amount of water and CO respectively equal to 500 kPa and 1.5 kPa which was representative of the range studied in
this work. As reported in Table 3, CO and CO2 should be totally converted in methane.
Under our experimental conditions, no transformation of CO was observed without catalyst
whatever the H2O/CO ratio (from 52 to 1027). In the presence of a CoMoS/Al2O3 catalyst, the
transformation of CO depends on the H2O/CO ratio and the residence time. Thus, the
conversion of carbon oxides by water gas shift or methanation in these operating conditions is clearly kinetically controlled.
The molar conversion of CO by WGS increases from 10% to 41% when the residence time
increases from 163 to 981s for a H2O/CO ratio of 52. Moreover the conversion depends also
on the H2O/CO ratio. For a same contact time (163s), the formation of CO2 observed was
equal to 10% for H2O/CO ratio of 52 and multiplied around 3 for H2O/CO ratio of 309 (Fig.
3).
The impact of a mixture of CO and H2O were then measured for the transformation of the
model feed with H2O/CO ratio ranging from 106 and 352. These ratios were obtained with a
and 462 kPa. It can be seen that the conversion of 2MT and olefins decreased when the
H2O/CO ratio increased (Fig.4). It should be remembered that H2O/CO ratio equal to 0
corresponds to a partial pressure of CO alone of 1.31 kPa. In the same time, the conversion of
CO into CO2 from 0 to 25% can be noticed for the higher H2O/CO ratios (Fig.5). These
results showed that an excess of water (corresponding to an increase of H2O/CO ratio)
favored the transformation of CO into CO2 involving the water gas shift reaction. No
modification of the kHDS/kHYD selectivity was found whatever the H2O/CO ratios (Fig.6). For
various initial 2MT conversions, the kHDS/kHYD selectivity remains constant whatever the
H2O/CO ratios. Indeed, for 2MT conversions of 18,9%, and 40%, the kHDS/kHYD selectivity is
equal to 4.1 and 9 respectively. As pointed out previously [15], the kHDS/kHYD selectivity
decreases principally with the increase of 2MT conversion, no matter the amount of CO and
H2O added.
3.3 Catalyst deactivation and characterizations.
The effect of the presence of water alone or in mixture with CO on the catalyst deactivation for the transformation of 2MT and alkenes alone and in mixture has been studied. The effect of water on deactivation was not the same depending on the model molecules. Considering 2MT alone, the effect of water was totally reversible. No catalyst deactivation was observed in the presence of water after the transformation of 2MT. Indeed, whatever the partial pressure of water, the same conversion (step 4 of the procedure) of 2MT that the initial conversion (step 1) was recovered. However the water effect was not totally reversible considering the alkene. Surprisingly, regarding the transformation of the alkenes alone, the presence of water above 200 kPa seems to prevent catalyst deactivation (Table 4). Indeed,
without water a catalyst deactivation (X/X0 = 37%) was noticed after 30 hours of reaction. In
the presence of partial pressures of water higher than 200 kPa, the relative loss of conversion is only 20% (respectively 18 and 22% for 200 kPa and 389 kPa of water after step 2). This
can be explained by a decrease in the carbon content on the surface of the catalyst when the partial pressure of water increases. Indeed, the amount of carbon measured after 30 hours without water was equal to 2.7 wt%. This value decreases to 1.2 wt% for the higher partial pressure of water. Water seems to prevent the coke formation at the catalyst surface and reduces the deactivation phenomena.
Considering now the model feed of FCC gasoline (combining 2MT and alkenes in mixture) the presence of water was partially reversible for the transformation of 2MT and reduced the
deactivation for the transformation of the alkenes (Table 5). Indeed the ratio (XR/X0) between
the return point conversion (step 4) and the initial conversion (step 1) was found between 0.8 and 0.9 for 2MT transformation. Considering the alkene, it rises from 0.7 with water partial pressure equal to 139 kPa to almost 1 for partial pressure higher than 200 kPa.
Finally, the effect of water and CO in mixture was also not totally reversible on the model
feed transformation as reported Fig.7. XR/X0 ratio decreased when H2O/CO ratio increased.
The inhibiting effect of water and CO introduced simultaneously appears as more reversible
for the transformation of 2MT than for olefins, and this regardless of the H2O / CO ratio. For
example, for an initial 2MT conversion of 40% and 5% for olefins, the XR/X0 ratio is always
greater for 2MT compared to olefins. Indeed, for a H2O/ CO ratio equal to 106, XR/X0 ratio is
equal to 0.93 and 0.66 respectively for the 2MT and olefins. This trend is valid throughout the domain of conversions considered.
Detailed characterizations of the active phases of freshly sulfided and used catalysts were undertook by TEM and XPS to point out possible modification after catalytic evaluation (Fig.8). The length and stacking of the slabs were estimated from five hundred particles for each TEM image. Average length (L), average stacking (S) and standard deviations (σ) were reported in Table 6. No difference on the size of slabs was noticed between the freshly sulfided and the used catalyst after the transformation of the model feed (without addition of
oxygenate compounds). Conversely a significant decreasing was observed after the
introduction of 462 kPa of water. However, the slabs stacking does not change significantly.
XPS analysis of CoMoS/Al2O3 catalyst showed the formation of MoS2, CoMoS and Co9S8
phases according to the chemical analysis presented on Fig.9 and Fig.10 respectively after the
transformation of the model feed alone or in the presence of added water. Various Co9S8
(778.4 eV), CoMoS (779.1 eV) and MoS2 were well identified (Mo3d5/2 : 229,4 eV; S2p3/2 :
162,2 eV) in all cases after the transformation of the model feed alone and with added water.
Quantitative analysis of XPS is given Table 7 which resumes the S/Mo and Co/Mo atomic
ratios as well as the promotion by cobalt (PCo), the sulfidation rate of molybdenum (SMo) and the global sulfidation rate (GS). The presence of water does not induce the formation of additional sulfate since the sulfate content is zero for all three catalysts. Furthermore, the MoS2 phase is always formed successfully in all cases since the S/M ratio is always 2,1. However, we notice a significant decrease of the promotion rate by cobalt for both used catalysts as well as a decrease of the global sulfidation rate, independently of water addition to the reaction media.
The addition of water does not strongly modify the catalyst properties which is coherent with the fact that water does not increase the catalyst deactivation.
3.4 DFT calculations
H2O adsorption was calculated on both edges of the CoMoS active phase for different
promoter and sulfur contents around the most stable configurations of each edge and is compared to results obtained previously with CO [15]. To study inhibition effect towards HDS and HYD, 2-methylthiophene (2MT) and 2,3-dimethylbut-1-ene (23DMB1N) are used as model molecules , such as in experiments. For these two reactant model molecules, we use previous adsorption data reported in Ref. [27].
3.4.1 Adsorption on CoMoS M-edge
The edge energy variation related to the adsorption of water is shown in Fig. 11 and compared to the edge energies in presence of adsorbed 23DMB1N (isomer reagent during 23DMB2N transformation), 2MT and CO as previously reported in Refs. [27,15]. Despite a higher partial pressure of water, the effect of water is much less pronounced than that of CO. This is due to the difference in adsorption energy. Indeed, in its most stable adsorption states, CO exhibits adsorption energies between -2.05 eV and -1.88 eV whereas the energy of the most stable
state associated with the adsorption of H2O (configuration 4A in Fig.11) is two times less
exothermic (-0.86 eV). In agreement with the very low adsorption energy (-0.04 eV), configuration 4B corresponds to a water molecule located far away from the Co site (weakly interacting through H-bonding). In this case, the M-edge site is preferentially covered by S species at a S-coverage of 50 % (instead of 25 % in the case of 2MT or 23DBM1N). As shown in Ref. 15, this was not the case for CO which is strongly adsorbed on Co edge sites even at high sulfiding conditions.
The selectivity index between 2MT and water thus varies between 0.06 and -0.16 eV/atom at the M-edge (Table 8). It is therefore generally higher than for CO (between -0.13 to -0.34 eV/atom). In the range of chemical potential corresponding to the HDS conditions, the selectivity index varies between -0.06 and -0.01 eV/edge atom. So it is weakly in favor of
water. However, the inhibition effect of H2O on thiophene HDS on the M-edge is weak
(although it is not null) but is significantly lower than the inhibition effect of CO.
3.4.2 Adsorption on CoMoS S-edge
The water adsorption on the S edge of the CoMoS nanocrystallite was also considered. The adsorption modes (4C and 4D) of water on the S edge are shown in Fig. 12. As already
notice that in presence of water, the S-coverage switches from 62.5% to 37.5% without going through the 50%S as usually reported in absence of water [25]. As for the M-edge, the adsorption energies are significantly lower for water (-0.69 eV for 4C and +0.35 for 4D) than for CO (from -1.77 to -0.83 eV). For the 4D configuration, the endothermic value also means that the S-edge will preferentially desorb water.
According to previous DFT studies, the adsorption selectivity between 2MT and 23DMB1N is greater for the S-edge [25]. Considering the variation of edge energy in presence of water, shown in Figure 12, the selectivity index between water and 2MT is always positive and varies between 0.10 and 0.13 eV per metal atom of the S edge (Table 8). Therefore water is expected to exhibit no inhibiting effect on the HDS of 2MT on this edge. However, the selectivity index between water and the 23DMB1N is negative but still low (between -0.09 and -0.04 eV/atom). Water has a weak inhibiting effect on the hydrogenation of olefin on this edge. However, this effect will remain modest for the model feed because the inhibiting effect of 2MT on 23DMB1N is much higher (selectivity index of between -0.20 and -0.16 eV/atom according to [25]).
As conclusion summary, DFT calculations suggest that a significant partial pressure of water (even higher than that of CO) should not lead to inhibition effect for 2MT on the S edge and have a very weak inhibiting effect on the M edge. Regarding 23DMB1N, the molecule can be weakly inhibited by water on both the M-edge and S-edge. However, if one considers a mixture of 2MT, 23DMB1N and water, the selectivity index shows that the main inhibiting effect on 23DMB1N HYD, should be assigned to 2MT and not to water. Hence, the HDS/HYD selectivity is expected not to be modified by the presence of water.
4 Discussion
The presence of oxygenates decreases the conversion of olefins and 2MT, these molecules being considered alone or in mixture. However, significant differences were
identified depending on the oxygenated compounds and the model molecules (2MT or 23DMB2N) and if these molecules are considered alone or in mixture. Water has a negative impact on the transformation of model molecules, this inhibiting effect is the same as the olefin and 2MT are considered alone or in mixture. According to DFT calculations, the negative impact of water on 2MT HDS is mainly due to the competitive adsorption on the M-edge. On the S-edge, 2MT is more strongly stabilized in the configuration illustrated in Fig. 13 b) and 2MT HDS is thus not impacted by water on this edge. Considering olefin, the study by Krebs et al. [27] showed that olefin adsorption is rather constrained on the S-edge at the cost of a local edge restructuration (Fig. 13 a) leading to a weak exothermic process. So one may deduce from the combination of the present experimental results that olefin HYD is thus inhibited by water on the M-edge in a rather similar way as for 2MT on the same edge. However 2MT HDS continues to occur on the S-edge.
Nevertheless, whatever the conditions, the impact of H2O is considerably lower than
the one observed with CO [15]. Indeed, in the range of studied partial pressures of CO (from
0.16 to 2 kPa) and of H2O (from 75 to 389 kPa), the same effect on the activity for the
transformation of the model molecules alone or in mixture can be observed, however the partial pressure of CO and water applied are really different. For the transformation of 2MT and alkenes alone, partial pressures of water applied are respectively 750 times higher than partial pressures of CO for 2MT (Fig.14) and 100 times higher for alkenes (Fig.15. This trend is also confirmed during processing model molecules mixture. Partial pressures of water applied are respectively 300 times higher than partial pressures of CO for 2MT (Fig.16) and 500 times higher for alkenes (Fig.17).
These differences observed in the inhibition effects caused by water and CO are well rationalized by the DFT calculated selectivity indices on the S-edge and M-edge which are significantly more negative between CO and 2MT (or 23DMB1N) than between water and
2MT (or 23DMB1N). Fig. 13c recalls the stable adsorption configuration found for CO in Ref. [15].
If we now consider the competition for the edge site between 2MT and 23DMB1N, the DFT calculated selectivity indices show that on the S-edge, 2MT is far more strongly stabilized (Fig. 13 b) than olefin (Fig. 13 a) while it is only weakly more stabilized on the M-edge. This also explains that the effect of water on the model feed does not impact the HDS/HYD selectivity, since the inhibiting effect of water on olefin is screened by the stronger inhibiting effect of 2MT on olefin HYD itself on the S-edge. On the M-edge, 2MT and olefin are both weakly inhibited by water, which does not modify strongly the HDS/HYD selectivity.
Finally, the simultaneous presence of water and CO has also a negative impact on the conversion of the two model molecules. The negative effect observed corresponds to the
remaining partial pressure of CO until a H2O/CO ratio of 200. The water gas shift reaction
between CO and water, leading to the formation of CO2 was observed. However, CO2 and
water do not have a direct negative impact in the transformation of 2MT and olefins since the
inhibiting effect is mainly due to unconverted CO partial pressure. Beyond a H2O/CO ratio of
200, the inhibition is greater than the one obtained in the presence of CO alone. Indeed, the conversion of olefin and 2MT in these conditions are lower than those measured in the presence of CO alone. This could also be due to the quantity of water which becomes very important and may also contribute to the inhibition of the adsorption of olefin and 2MT on the M-edge. Although a high conversion of 60 % of CO is observed under these conditions, water inhibits the model molecules transformation, even if the water adsorption constant on to the surface is much lower than of the CO one. However, no significant modification of the surface characterized by XPS and TEM was noticed after water treatment. These inhibiting effects of CO and water on HDS and HYD reactions rates are the result mainly of competitive
adsorption between the adsorption of reactants from models FCC gasoline feedstocks
(23DMB2N and 2MT) and oxygenate molecules (CO and H2O).
Overall, the CO is the most strongly adsorbed compound relative to 2MT, olefin and water as rationalized by the DFT calculations of the adsorption energies of the three molecules on the CoMoS edges.
5 Conclusion
This combined theoretical and experimental study has illustrated mutual inhibiting effects between different sulfur, olefin and oxygen model compounds. Indeed, mutual competitive adsorption between 2MT and 23DMB2N has been demonstrated experimentally. It was confirmed by DFT calculations of the so-called selectivity index. In particular, water competes with 2MT and olefin on the M-edge, whereas water does not compete with 2MT on the S-edge. A stronger inhibiting effect of CO on the hydrodesulfurization (HDS) reaction of 2MT and hydrogenation of 23DMB2N (HYD) compounds was demonstrated even at very low CO partial pressure added. These effects are also due to competitive adsorption between oxygenated compounds and FCC gasoline model molecules. The significant stronger
inhibiting effects revealed by CO with respect to H2O is attributed to the more negative
selectivity index quantified by DFT calculations. When CO and water were introduced at the same time, the negative impact was only due to the presence of CO and was not changed for
H2O/CO ratios lower than 200. Beyond that value, a slight impact of water was noticed for
high amount of water. Finally, under these operating conditions, the presence of CO and water alone or in mixture does not affect the selectivity HDS/HYD, which is the key parameter for FCC gasoline hydroprocessing. If we consider that CO and water could be the result of gas impurities or by-product of renewable resources conversion in HDS processes, CO should be identified as the main inhibitor for CoMoS catalyst since water impact the catalyst activity only at high amount.
References
[1] Directive 2009/30/CE L140/16
[2] G.W. Huber, A. Corma, Angew. Chem. Int. Ed. 46 (2007) 7184 – 7201 [3] G.W. Huber, S. Iborra, A. Corma, Chem. Rev. 106 (2006) 4044-4098 [4] D. Mohan, C.U. Pittman, P. Steele, Energy Fuels 20 (2006) 849-889.
[5]L. Ingram, D. Mohan, M. Bricka, P. Steele, D. Strobel, D. Crocker, B. Mitchell, J. Mohammad, K. Cantrell, C. Pittman, Energy Fuels 22 (2008) 614-625.
[6] P. Ghosh, A.T. Andrews, R.J. Quann, T.R. Halbert, Energy Fuels 23 (2009) 5743-5759 [7] A. Pinheiro, D. Hudebine, N. Dupassieux, C. Geantet, Energy Fuels 25 (2011) 804-812. [8] M.Philippe, F. Richard, D. Hudebine, S. Brunet, Appl. Catal. A Gen. 383 (2010) 14-23. [9] A. Pinheiro, D. Hudebine, N. Dupassieux, C. Geantet, Energy and Fuels 25 (2011) 804 – 812.
[10] M.Philippe, F. Richard, D. Hudebine, S. Brunet, Appl. Catal. B Environmental.132– 133 (2013) 493– 498
[11] M. Badawi, J.F. Paul, S. Cristol, E. Payen. Catalysis Communications 12 (2011) 901– 905
[12] C. Dupont, R. Lemeur, A. Daudin, P. Raybaud, J. Catal. 279 (2011) 276–286
[13] M. Ruinart de Brimont, C. Dupont, A. Daudin, C. Geantet, P. Raybaud. J. Catal. 286 (2012) 153–164
[14] C. Bouvier, Y. Romero, F. Richard, S. Brunet, Green Chemistry 14 (2011) 2441–2451. [15] F. Pelardy, C. Dupont, C. Fontaine, E. Devers, A. Daudin, F. Bertoncini, P. Raybaud, S. Brunet, Appl. Catal. B: Environmental 97 (2010) 323–332.
[16] S. Brunet, D. Mey, G. Pérot, C. Bouchy and F. Diehl, Appl. Catal. A: Gen., 218(2), 2005, 143-172
[17] D. Mey, S. Brunet, C. Canaff, G. Pérot, C. Bouchy, F. Diehl, F. Maugé. J. Catal. 227 (2004) 436-447.
[18] A. Daudin, S. Brunet, G. Pérot, P. Raybaud, C. Bouchy, J. Catal. 248 (2007) 111-119 [19]N. Dos Santos, H. Dulot, N. Marchal, M. Vrinat, Appl Catal A Gen 352 (2009) 114-123 [20] G. Kresse, J. Hafner, Phys. Rev. B 47 (1993) 558–561.
[21] G. Kresse, J. Furthmüller, Phys. Rev. B 54 (1996) 11169–11186. [22] J. P. Perdew, Y. Wang, Phys. Rev. B 45 (1992) 13244-13249.
[23] P. Perdew, J. A. Chevary, S. H. Vosko, K. A. Jackson, M. R. Pederson, D. J. Singh, C. Fiolhais, Phys. Rev. B 46 (1992) 6671-6687.
[24] G. Kresse, D. Joubert, Phys. Rev. B 59 (1999) 1758–1775.
[25] E. Krebs , B. Silvi, P. Raybaud. Catal. Today 130 (2008) 160–169 [26] M. Badawi, J.F. Paul et al. J. Catal. 282 (2011) 155–164
[27] E. Krebs, B. Silvi, A. Daudin, P. Raybaud. J. Catal. 260 (2008) 276–287
[28] C.D. Wagner, W.M. Riggs, L.E. Davis, J.F. Moulder, in: G.E. Muilenberg (Ed.),
Handbook of X-ray Photoelectron Spectroscopy, Perkin-Elmer Corporation
(PhysicalElectronics), 1979
[29]A.D. Gandubert, C. Legens, D. Guillaume, S. Rebours, E. Payen, Oil Gas Sci. Technol.– Rev. IFP 62 (2007) 79.
Acknowledgements
Table 1. Partial pressures (kPa) of the different compounds for the sulfidation step and the transformation of the different feeds
Pressure (kPa) Sulfidation Olefinic
feed Thiophenic feed (1000 ppm S) Model FCC gasoline (1000 ppm S) Polefin 0 150 0 150 PH2S 10 2 0 0 P2MT 0 0 3 3 Po-xyl 0 0 0 190 PH2 90 1343 1360 1314 PnC7 0 507 637 346 PTOT 100 2000 2000 2000
Table 2: Amount of CO and water added in the various feeds a) partial pressure from the
global feed in inlet gas phase under reaction conditions, b) corresponding concentration in H2
inlet flow for CO and in nlet liquid feed flow for water
CO H2O MPa a) ppm b) MPa a) ppm b) Olefinic feed 0-0.0023 479 0-0.389 994 Thiophenic feed 0-0.002 411 0-0.272 710 Model FCC gasoline 0-0.0013 277 0-0.472 1518
Table 3: Initial partial pressures of H2, H2O, CO, CO2 and CH4 and thermodynamic
equilibrium composition calculated (T=523 K, P=2 MPa )
Compound Initial (kPa) At the equilibrium (kPa)
H2 1498,5 1494
H2O 500 501,5
CO 1,5 1,97.10-12
CO2 0 5,88.10-11
Table 4 : Transformation of alkenes alone. X/X0 ratio (X : conversion in the presence of
various amount of water step 2, after 30 hours ; X0 : conversion of alkenes without water in the
feed step 1), amount of carbon and sulfur as a function of the partial pressure of water. (T =
250°C, P = 2 MPa, CoMo/Al2O3, H2/charge = 360 NL/L)
(a) Without water, the ratio X and X0 are determined during step 1, respectively at 30 hours and 10 hours of time on stream [15].
PH2O (kPa) 0(a) 100 200 389
X/X0 (%) 37 40 18 22
C (wt%) 2.7 1.6 1.2 1,2
Table 5: Transformation of the model feed. Effect of the amount of water. XR/X0 ratio (XRr:
conversion at step 4 in the procedure, X0: initial conversion-step 1 of the procedure (T =
250°C, P = 2 MPa, CoMo/Al2O3, H2/charge = 360 NL/L)
PH2O (kPa) 139 261 462
XR/X0 (2MT) 0.79 0.89 0.81
Table 6: Average lenght (L), average stacking (S) and standard deviations (σ) of a
CoMo/Al2O3 after the sulfidation step, after the transformation of the model feed without and
with 462 kPa of water.
CoMo/Al2O3 L (Å) σ (Å) Stacking
Sulfided 34 12 1.7
After the model feed transformation 31 10 1.6
After the model feed transformation
Table 7: XPS analysis of fresh and used CoMoS catalysts - S/Mo, Co/Mo atomic ratios, promotion by cobalt (PCo %), sulfidation rate of molydenum (SMo %) and global sulfidation rate (GS) determined (*: atomic)
CoMo/Al2O3 Sulfates (%)* S/Mo (atom.) Co/Mo (atom.) PCo (%)* SMo (%)* GS (%)* Freshly sulfided 0 2.15 0.66 35 76 88
After the model feed transformation 0 2.15 0.70 22 71 75
After the model feed transformation + 462 kPa of water
Table 8: Interval of the selectivity index values (∆σedge in eV/edge) between the oxygen
molecules (CO or H2O) and 2MT or 23DMB1N for M and S edges of the CoMoS active
phase. To be consistent with ref. [15] and the present experimental conditions, the following
parameters are used: P (23DBM1N) = 150 kPa, P(2MT) = 3 kPa, P(H2O) = 15 kPa, and
P(CO) = 1.31 kPa at T = 525 K over the full range of ∆µS.
Edge H2O-2MT CO-2MT H2O-23DMB1N CO-23DMB1N
M -0.16 to +0.06 -0.33 to -0.13 -0.22 to +0.02 -0.42 to -0.18
Scheme 1. Reaction pathway of the 2-methylthiophene hydrodesulfurization 2MT: 2-methylthiophene, 2MTHT: 2-methyltetrahydrothiophene,
P13DN: pent-1,3-diene, P1N: pent-1-ene, P2N: pent-2-ene, nP : n-pentane
S S + H2 + H2 + H2 + 2H2 + 2H2 - H2S - H2S nP P1N P2N 2MTHT 2MT + P13DN
Scheme 2. Reaction pathway of the dimethylbut-2-ene hydrogenation 23DMB2N: 2,3-dimethylbut-2-ene, 23DMB1N: 2,3-dimethylbut-1-ene, 23DMB: 2,3-dimethylbutane
23DMB2N 23DMB1N
Fig. 1: Impact of the water partial pressure in the HDS (2MT) and HYD (alkenes) activities.
2MT ( , full line) and 23DMB2N ( , full line) transformation alone and with 2MT ( ,
dotted line) and 23DMB2N ( , dotted line) transformation in mixture. (T = 523K, P = 2 MPa,
Fig. 2: Effect of the partial pressure of water in the loss of activities (measured by A/A0 ratio,
A: activity at various partial pressure of water, A0: initial activity). 2MT ( ) and 23DMB2N
( ) transformation alone; and 2MT ( ) and 23DMB2N ( ) transformation in mixture. (T =
Fig.3: Transformation of CO alone into CO2 versus the residence time of CO. Effect of the
Fig.4: Transformation of the model feed: Effect of the H2O/CO ratio a) 2MT conversion, b)
alkenes conversion. (T = 523°K, P = 2 MPa, PCO = 1.31 kPa, CoMoS/Al2O3, residence time =
Fig.5: Transformation of the model feed: Effect of the H2O/CO ratio on the transformation of
CO into CO2. (T = 523°K, P = 2 MPa, PCO = 1.31 kPa, CoMoS/Al2O3, residence time = 3s,
Fig.6: Transformation of a model FCC gasoline. Effect of different H2O/CO molar ratio and
initial conversion of 2MT (C0, 2MT) on the kHDS/kHYD ratio (C0,2MT = 18,9%: , C0,2MT =
41% (T = 523°K , P = 2MPa, H2/feed = 360 NL/L, CoMo/Al2O3).
0 5 10 15 0 100 200 300 400 k H D S /k H Y D H2O/CO
Fig. 7: XRr/X0 ratio (XR : conversion measured after stopped water, X0 : initial conversion as a
function of H2O/CO ratio on the transformation of 2MT and alkenes
(23DMB2N+23DMB1N) in mixture (T = 523°K, P = 2 MPa, PCO = 1,31 kPa, CoMo/Al2O3,
Fig.8: TEM analysis of CoMoS/Al2O3 a) freshly sulfided b) after the transformation of the
model feed c) after the transformation of the model feed in the presence de 462 kPa of water (scale : 5 nm)
Fig.9: XPS spectra of CoMoS/Al2O3 after the transformation of the model feed (a): sulfur
element, (b) molybdenum element, (c): cobalt element c) a) b) S 2p1/2 S 2p3/2 MoS2 3d5/2 S 2s Mo5+ 3d 5/2 MoS2 3d3/2 MoO3 3d5/2 MoO3 3d3/2 Mo5+ 3d 3/2 CoMoS 2p3/2 CoO 2p1/2 CoMoS 2p1/2 Co9S8 2p3/2 Co9S8 2p1/2 CoO 2p3/2
Fig.10: XPS spectra of CoMoS/Al2O3 after the transformation of the model feed in the
presence of 462 kPa of water (a): sulfur element, (b) molybdenum element, (c): cobalt element c) a) b) S 2p1/2 S 2p3/2 MoS2 3d5/2 S 2s Mo5+ 3d 5/2 MoS2 3d3/2 MoO3 3d5/2 MoO3 3d3/2 Mo5+ 3d 3/2 CoMoS 2p3/2 CoO 2p1/2 CoMoS 2p1/2 Co9S8 2p3/2 Co9S8 2p1/2 CoO 2p3/2
Fig. 11: Evolution of the edge energy as a function of the sulfur chemical potential (∆µS) for
the 4 relevant molecules adsorbed on CoMoS M-edge. Partial pressures and temperature are chosen in agreement with experimental conditions: P (23DBM1N) = 150 kPa, P(2MT) = 3
kPa, P(H2O) = 15 kPa , P(CO) = 1.31 kPa. The p(H2S)/p(H2) axis is determined for T = 525
K. Dashed lines correspond to the partially promoted M-edge (Co/Mo = 0.5), full lines to the fully promoted one. Structure 4A (resp. 4B) corresponds to water adsorbed on the partial Co promotion with 25.0% of sulfur (resp. on the fully promoted edge with a S content of 50%). The description of structures 1A-1C and 2A-2C is given in Ref. [27]. Energetic data for CO are taken from [15].
(For interpretation of the references to colour in this figure legend, the reader is referred to the web version of the article.)
Fig.12: Evolution of the edge energy as a function of the sulfur chemical potential (∆µS) for
the 4 relevant molecules adsorbed on CoMoS S-edge for the same conditions as in Fig. 8. Structure 4C (resp. 4D) correspond to water adsorbed on the fully promoted S-edge with a S content of 37.5% (resp. 62.5%). Structures 1D-1F and 2D-2F are given in Ref. [27]. Energetic data for CO are taken from [15].
(For interpretation of the references to colour in this figure legend, the reader is referred to the web version of the article.)
Fig. 13: Adsorption configurations of 23DMB1N (configuration 1D), 2MT (configuration 2D), and CO on CoMoS S-edge with 100% Co and 37.5% S as it is in HDS conditions. (adapted from [15] and [27]).
Fig. 14 Transformation of 2 MT alone. Comparison of the effect of CO and water. (T =
Fig 15 Transformation of alkenes alone. Comparison of the effect of CO and water. (T =
Fig 16 Transformation of the model feed. HDS activity – 2MT transformation. Comparison of
Fig 17: Transformation of the model feed. HYD activity – alkenes transformation.
Comparison of the effect of CO and water. (T = 523°K, P = 2 MPa, CoMo/Al2O3, H2/charge =