HAL Id: hal-00296344
https://hal.archives-ouvertes.fr/hal-00296344
Submitted on 2 Oct 2007
HAL is a multi-disciplinary open access
archive for the deposit and dissemination of
sci-entific research documents, whether they are
pub-lished or not. The documents may come from
teaching and research institutions in France or
abroad, or from public or private research centers.
L’archive ouverte pluridisciplinaire HAL, est
destinée au dépôt et à la diffusion de documents
scientifiques de niveau recherche, publiés ou non,
émanant des établissements d’enseignement et de
recherche français ou étrangers, des laboratoires
publics ou privés.
Nitrate aerosols today and in 2030: a global simulation
including aerosols and tropospheric ozone
S. E. Bauer, D. Koch, N. Unger, S. M. Metzger, D. T. Shindell, D. G. Streets
To cite this version:
S. E. Bauer, D. Koch, N. Unger, S. M. Metzger, D. T. Shindell, et al.. Nitrate aerosols today and
in 2030: a global simulation including aerosols and tropospheric ozone. Atmospheric Chemistry and
Physics, European Geosciences Union, 2007, 7 (19), pp.5043-5059. �hal-00296344�
www.atmos-chem-phys.net/7/5043/2007/ © Author(s) 2007. This work is licensed under a Creative Commons License.
Chemistry
and Physics
Nitrate aerosols today and in 2030: a global simulation including
aerosols and tropospheric ozone
S. E. Bauer1,2, D. Koch1,2, N. Unger3, S. M. Metzger4, D. T. Shindell2, and D. G. Streets5
1The Earth Institute at Columbia University, NY, USA 2NASA Goddard Institute for Space Studies, NY, USA 3University of Vermont, Burlington, USA
4Max-Planck Institute for Chemistry, Mainz, Germany 5Argonne National Laboratory, Argonne, IL, USA
Received: 5 April 2007 – Published in Atmos. Chem. Phys. Discuss.: 26 April 2007 Revised: 18 July 2007 – Accepted: 8 August 2007 – Published: 2 October 2007
Abstract. Nitrate aerosols are expected to become more
im-portant in the future atmosphere due to the expected increase in nitrate precursor emissions and the decline of ammonium-sulphate aerosols in wide regions of this planet. The GISS climate model is used in this study, including atmospheric gas- and aerosol phase chemistry to investigate current and future (2030, following the SRES A1B emission scenario) atmospheric compositions. A set of sensitivity experiments was carried out to quantify the individual impact of emission-and physical climate change on nitrate aerosol formation. We found that future nitrate aerosol loads depend most strongly on changes that may occur in the ammonia sources. Further-more, microphysical processes that lead to aerosol mixing play a very important role in sulphate and nitrate aerosol for-mation. The role of nitrate aerosols as climate change driver is analyzed and set in perspective to other aerosol and ozone forcings under pre-industrial, present day and future condi-tions. In the near future, year 2030, ammonium nitrate ra-diative forcing is about −0.14 W/m2and contributes roughly 10% of the net aerosol and ozone forcing. The present day nitrate and pre-industrial nitrate forcings are −0.11 and
−0.05 W/m2, respectively. The steady increase of nitrate aerosols since industrialization increases its role as a non greenhouse gas forcing agent. However, this impact is still small compared to greenhouse gas forcings, therefore the main role nitrate will play in the future atmosphere is as an air pollutant, with annual mean near surface air concentrations, in the fine particle mode, rising above 3 µg/m3in China and therefore reaching pollution levels, like sulphate aerosols.
Correspondence to: S. E. Bauer
(sbauer@giss.nasa.gov)
1 Introduction
Nitrate aerosols are chemically formed in the atmosphere and their main precursor species are ammonia and nitric acid. Ammonia and nitric oxides, which is a precursor of nitric acid, have a long list of anthropogenic and natural sources. The major identified sources of ammonia include excreta from domestic and wild animals, synthetic fertilizers, oceans, biomass burning, crops, human populations and pets, soils, industrial processes and fossil fuels (Bouwman et al., 1997). Typical sources of nitric oxides are fossil fuel combustion, soils, biomass burning and lightning.
A series of modeling studies (Adams et al., 2001; Met-zger et al., 2002b,a; Liao et al., 2003; Rodriguez and Dabdub, 2004; Feng and Penner, 2007) identified nitrate and ammo-nium as significant anthropogenic sources of aerosol load and their radiative effects (Adams et al., 2001; Jacobson, 2001; Liao et al., 2004), but currently most global aerosol models still exclude ammonium-nitrate when the direct aerosol ra-diative forcing is studied (Schulz et al., 2006; Textor et al., 2006; Kinne et al., 2006). Even so, global model stud-ies (Adams et al., 2001; Liao et al., 2006; Liao and Sein-feld, 2005) have demonstrated that rapid increases in nitro-gen emissions could produce enough nitrate aerosol to off-set the expected decline in sulphate forcing by 2100, for the extreme IPCC A2 scenario. Furthermore, recent studies in-dicate that the condensation of nitric acid on aerosol par-ticles may enhance aerosol activation to cloud droplets by contributing soluble material to the particle surface and ele-vating the water uptake and growth of aerosol particles (Kul-mala et al., 1995, 1998; Goodman et al., 2000). Thus full consideration of aerosol composition including hygroscopic components like nitrate and ammonium could be important in the calculation of aerosol indirect forcing.
The formation of nitrate and ammonium aerosol also affects tropospheric chemistry. Nitrate and ammonium aerosols provide additional particle surfaces for scattering in-coming ultraviolet solar radiation (Liao et al., 2003) and will thus perturb photochemical oxidant production by altering photolysis frequencies. Moreover, nitrate aerosol is formed through heterogeneous reactions of nitrogen radicals such as N2O5, NO3, and HNO3on aerosol surfaces (Dentener et al., 1996; Jacob, 2000; Bauer et al., 2004, 2007). These het-erogeneous chemical processes can alter tropospheric chem-istry; for example the global tropospheric ozone mass can be reduced by 5% through the interactions of gas-phase species with mineral dust aerosols. Meanwhile, insoluble atmo-spheric mineral dust lifetime and load are reduced as coating by hydrophilic air pollution increases its precipitation scav-enging (Bauer and Koch, 2005; Bauer et al., 2007). In or-der to study the effects of nitrate and ammonium aerosol on radiative processes and gas-phase chemistry, one must first consider the partitioning of semi-volatile nitrate and ammo-nium between the gas and aerosol phases. Several equilib-rium models (EQMs) were developed to predict the phase equilibrium behavior of multicomponent aerosols and their gas-phase precursors in the atmosphere – all involving at least the NH3/HNO3/NH4NO3 gas-aerosol system. State-of-the-art EQMs include ADDEM (Topping et al., 2005a,b), AIM (Clegg et al., 1992; Clegg and Pitzer, 1992; Clegg et al., 1998b,a), EQSAM (Metzger et al., 2002b), EQSAM2 (Met-zger et al., 2006; Trebs et al., 2005), EQSAM3 (Met(Met-zger and Lelieveld, 2007), EQUISOLV (Jacobson et al., 1996), EQUISOLVII (Jacobson, 1999),GFEMN (Ansari and Pandis, 1999), ISORROPIA (Nenes et al., 1998; Pilinis et al., 2000), MARS-A (Binkowski and Shankar, 1995), MESA (Zaveri et al., 2005), SCAPE (Kim et al., 1993a,b; Kim and Seinfeld, 1995), SCAPE2 (Meng et al., 1995), UHAERO (Amundson et al., 2006), older EQMs include EQUIL (Bassett and Se-infeld, 1983), KEQUIL (Bassett and SeSe-infeld, 1984), MARS (Saxena et al., 1986), and SEQUILIB (Pilinis and Seinfeld, 1987). Some of these models have been compared in Zhang et al. (2000); Amundson et al. (2006); Metzger et al. (2006); Metzger and Lelieveld (2007).
However, the problem with most of these models is that they are extremely computationally expensive. Since the GISS Genereral Circulation Model (GCM) is designed for long climate applications, computational efficiency is cru-cial. Therefore, we have chosen the efficient gas/aerosol partitioning model EQSAM (Equilibrium Simplified Aerosol Model). The approach used for EQSAM is based on the re-lationship between activity coefficients and relative humidity (Metzger et al., 2002b, 2006). This relationship allows pa-rameterization of the relevant nonideal solution properties, which is sufficiently accurate for global modeling (Metzger et al., 2002a). Although EQSAM chemistry is parameter-ized, the thermodynamic framework is based on the same assumptions used by other equilibrium models.
In this study the GISS GCM is employed, including cou-pled gas and aerosol phase chemistry modules. A brief sum-mary of nitrate chemistry is given in Sect. 2. The GCM, the emission scenario and the model set up are described in Sect. 3. Current day nitrate concentrations to observations are presented in Sect. 4, followed by a comparison of present day and future nitrate and sulphate distributions in Sect. 5 . The sensitivity studies, regarding the impact of changes in individual emission sources and physical climate change are presented in Sect. 6. And the radiative forcing contri-butions of the single aerosols and ozone under past, present and future conditions are shown in Sect. 7. Conclusions are presented in Sect. 8.
2 Nitrate chemistry
The formation of ammonium nitrate aerosol depends on the thermodynamic state of its precursor and depends strongly on the environmental conditions. Gaseous ammonia and ni-tric acid react in the atmosphere to form aerosol ammonium nitrate, NH4NO3.
NH3(g) + HNO3(g) ⇋ NH4NO3(s) (1)
Ammonium nitrate is formed in areas characterized by high ammonia and nitric acid conditions and low sulphate condi-tions. Depending on the ambient relative humidity (RH), am-monium nitrate may exist as a solid or as an aqueous solution of NH+4 and NO−3. Equilibrium concentrations of gaseous NH3and HNO3, and the resulting concentration of NH4NO3 is calculated by thermodynamical principals, requiring the ambient RH and temperature. At low temperatures the equi-librium of the system shifts towards the aerosol phase. At low RH conditions NH4NO3is solid, and at RH conditions above the deliquescence, NH4NO3will be found in the aque-ous state.
NH3(g) + HNO3(g) ⇋ NH+4(aq) + NO−3(aq) (2)
For a given temperature the solution of the equilibrium equa-tion requires the calculaequa-tion of the corresponding molalities. These concentrations depend not only on the aerosol nitrate and ammonium but also on the amount of water in the aerosol phase. Therefore calculations of the aerosol solution compo-sition requires estimation of the aerosol water content. The presence of water allows NH4NO3 to dissolve in the liquid aerosol particles and increases its aerosol concentration. Am-monium and nitrate will exist in the aerosol phase only if there is enough ammonia and nitric acid present to saturate the gas phase.
Sulfuric acid plays an important role in nitrate aerosol for-mation. Sulfuric acid possesses an extremely low vapor pres-sure. Furthermore (NH4)2SO4 is the preferred form of sul-phate, so each mole of sulphate will remove 2 moles of am-monia from the gas phase.
Therefore two regimes are important for nitrate formation: the ammonia-rich and the ammonia-poor case.
Ammonia-poor: In this case there is insufficient NH3 to neutralize the available sulphate. Thus the aerosol phase will be acidic. The vapor pressure of NH3 will be low, and the sulphate will tend to drive the nitrate to the gas phase. Since the NH3partial pressure will be low, the NH3-HNO3partial pressure product will also be low so ammonium nitrate levels will be low or zero.
NH3+H2SO4(g) ⇋ (NH4)HSO4 (3)
NH3+(NH4)H2SO4(g) ⇋ (NH4)2SO4 (4)
Ammonia-rich: In this case there is excess ammonia, so that
the aerosol phase will be neutralized to a large extent. The ammonia that does not react with sulphate will be available to react with nitrate to produce NH4NO3.
Competition between sulphate and nitrate for available ammonia results in rather complicated system behavior. The reduction of sulphate results in partial replacement of re-duced aerosol mass by available nitric acid. The sulphate decrease frees up ammonia to react with nitric acid and to transfer it to the aerosol phase.
Heterogeneous reactions of gaseous species with coarse aerosol species, like mineral dust and sea salt particles, have an important impact on nitrate aerosol formation. For exam-ple the reaction of nitric acid with calcium carbonate can take place when alkaline material is present in the mineral dust: CaCO3+HNO3→Ca2+NO−3 +HCO
−
3 (5)
Once HNO3 is formed, it is most likely captured by coarse mode sea-salt and dust particles, leading to a depletion of aerosol nitrate in the fine mode. During the night when am-monia is present in excess, ammonium nitrate can be formed; however, since this salt is thermodynamically not stable, it can evaporate during the day whereby the aerosol precursor gases NH3and HNO3are likely to condense on preexisting and larger aerosol particles (e.g. Wexler and Seinfeld, 1990). As a consequence, some anthropogenic air pollutants may not be confined to the fine aerosol mode but rather interact with larger particles which might be of natural origin such as sea salt and mineral dust aerosol.
3 Model description
The Goddard Institute for Space Studies (GISS) general circulation model (GCM) version modelE (Schmidt et al., 2006; Hansen et al., 2005) is employed for this study, with fully interactive tropospheric chemistry and aerosol modules. We use 23 vertical layers (model top in the mesosphere at 0.01 mb) and 4◦
×5◦horizontal resolution. The tropospheric
gas-phase mechanism (Shindell et al., 2003) represents back-ground HOx-NOx-Ox- CO-CH4chemistry as well as perox-yacetylnitrates, hydrocarbon families, and isoprene based on
32 species and 77 reactions. Methane concentrations are prescribed according to the used scenario. The thermody-namic gas-aerosol equilibrium model (EQSAM2) (Metzger et al., 2002b,a, 2006) is implemented in the climate model to simulate ammonium nitrate aerosols. We use the latest version EQSAM2, to calculate the gas/liquid/solid partition-ing of the H2SO4/HSO−4/SO2−4 HNO3/NO−3 – NH3/NH+4 -HCL/CL−– Na+Ca2+– Mg2+– K+– H
2O system. Further aerosol modules applied in this study include sulphate (Koch et al., 1999; Koch and Hansen, 2005), carbonaceous aerosols (Koch et al., 2006, 2007a), sea salt (Koch and Hansen, 2005), mineral dust (Miller et al., 2006) and heterogeneous sulphate and nitrate production on mineral dust surfaces (Bauer and Koch, 2005; Bauer et al., 2007, 2004).
Aerosols are represented in a bulk scheme. Aerosol mass is carried in the model for fine mode sulfate and nitrate using one bin for each component, assuming a log-normal size dis-tribution and an effective radius of 0.2 and 0.3 µm, respec-tively. Black and organic aerosols are each carried in two different bins, assuming the same size per specie of 0.1 µm for BC and 0.3 µm for OC, but different solubility, in order to account for aerosol aging. Two size bins are used to represent sea salt aerosols, with effective radii of 0.44 and 5 µm. Min-eral dust aerosols are tracked in four size bins, spanning over the range of 0.1 to 10 µm, with effective radii of, 0.46, 1.47, 2.94 and 5.88 µm. The sulphate and nitrate coating amounts, that are deposited on the dust surfaces by condensation of the precursor species HNO3, O3, H2SO4onto the dust surfaces are tracked in the model for each dust size bin.
The aerosols are approximated as externally mixed for ra-diative calculations. The rara-diative effect of nitrate and sul-phate material that is present in the coarse mode, due to it’s attachment to mineral dust particles, can be assumed negli-gible, because the optical properties of the mixed particle are nearly identical to an uncoated mineral dust particle (Bauer et al., 2007). The effect of humidity on sulphate, nitrate and OC aerosol sizes substantially increases the aerosol op-tical depths ((Koch et al., 2006); A. Lacis web data base at http:gacp.giss.nasa.gov/data sets/lacis/database.html.)
The uptake of nitrate or nitric acid into sea salt particles is not considered in this simulation, because our size resolution of two size bins to represent sea salt aerosols is to coarse to calculate an appropriate estimate of the available surface area of sea salt aerosols. Liao et al. (2003) had to expand her sea salt bins into 11 bins to get an reasonable estimate. We are aware that neglecting this surface reaction might underesti-mate nitrate in the coarse fraction of our simulations. How-ever, mineral cations that originate form sea salt and mineral dust (i.e. Na+, Ca2+, Mg2+, K+) influence nitrate formation
Table 1. Anthropogenic and natural trace gas emissions. 2000 2030 1 [%] NOx[Tg N/yr] natural 16.3 16.5 +1 anthropogenic 29.9 53.5 +79 NH3[TgN/yr] natural 14.4 14.4 – anthropogenic 39.7 58.1 +46 SO2[Tg S/yr] natural 11.8 11.9 +1 anthropogenic 72.1 96.0 +33 CO [Tg/yr] 846.0 1031.5 +22 BC [Tg/yr] industrial 4.5 3.6 −19 biomass 3.7 3.4 −9 OC [Tg/yr] industrial 11.4 7.3 −36 biomass 30.6 27.8 −9 terpene 16.6 16.6 – 3.1 Emissions Anthropogenic emissions
For present day conditions, the trace gas emissions are based on the anthropogenic emissions for 1995 from the Emissions Database for Global Atmospheric Research (EDGAR3.2) (Olivier and Berdowski, 2001). The 2030 future scenario is based on the A1B projection of the IPCC SRES model (Nakicenovic et al., 2000). The A1B scenario features rapid economic growth with a balance between fossil fuel inten-sive and renewable energy sources. The EDGAR3.2 and the future projection provide emissions for carbon-monoxide (CO), Nitrogen Oxides (NOx), non-methane volatile or-ganic compounds (NMVOC), methane (CH4), sulfur dioxide (SO2) and ammonia (NH3) (Bouwman et al., 1997). Black (BC) and organic carbon (OC) emissions for present day conditions are Bond et al. (2004) with the A1B future from Streets et al. (2004).
Natural emission
The emissions of the natural aerosols, sea salt and mineral dust, as well as dimethylsulfide (DMS) are calculated inter-actively in the model, depending on the wind speed and the surface conditions. In the current simulation 1748 Tg mineral dust and 1859 Tg sea salt are emitted under present climate conditions, with negligible change for future climate condi-tions. Gaseous emissions of dimethylsulfide (DMS) and iso-prene are parameterized after Koch et al. (2007b) and Guen-ther et al. (1995). Natural NOxemissions from lightning are parameterized as described in Price et al. (1997). Biomass
burning emissions are included in the EDGAR inventory and the A1B projection are given by Streets et al. (2004). Natural OM emissions are assumed to be derived from terpene emis-sions (Guenther et al., 1995), with a 10% production rate. 3.1.1 Emission distributions
Anthropogenic emission fluxes are expected to be signif-icantly altered within the next 30 years. Projected emis-sion increases for NH3, NOx, SO2, VOCs, CO, and de-creases for BC and OC between the present and 2030 are presented in Table 1 and the horizontal distributions are given in Fig. 1. The pattern for each individual precursor species can look very different, because different activities are asso-ciated with individual sources, for example, transportation, biomass burning, agriculture, etc., which are expected to evolve differently in different countries. For example ammo-nia (NH3) emissions and biomass burning emissions have an-thropogenic and natural contributions. The natural contribu-tions from oceanic, and untreated land sources are assumed to stay unchanged, whereas emissions related to industry, hu-mans, fertilizers, crops, domestic animals, fossil fuel and bio fuel change between 2000 and 2030. The largest source of NH3 emissions is associated with livestock husbandry and the agricultural use of fertilizers. The largest increase in NH3 sources is predicted to occur in India and Asia. The only area where small decreases are expected is Northern Europe. A similar pattern in the predicted change of NOx, SO2and VOCs can be found in Fig. 1, because these emissions are mostly associated with energy consumption that can be split up in sources, like transportation, power plants, residential and biomass burning. This may lead to a general decrease of emissions in Europe, Japan, Australia and most of North America, except Mexico. Largest increases are expected for India, Asia, Coastal Africa and South and Middle America.
The carbonaceous emissions, black and organic carbon also may shift. Technology implementation and fuel switch-ing may lead to less carbonaceous emissions in the United States of America, Europe, India and Asia (Streets et al., 2004). Reduced biomass burning may lead to less emissions in Sub-Sahara Africa.
Table 1 gives the global annual emission fluxes for the years 2000 and 2030 and the percentage change between those years. Although there are large decreases in cur-rent industrial countries, the annual trace gas emissions are expected to increase globally (see Table 1) for all non-carbonaceous species. The largest percent increase is as-sumed to be NOxemissions, which increase by 79% in our inventory. Carbonaceous emissions are the only emissions that are expected to decrease globally.
3.2 Model experimental setup
The model simulation duration is 6 years and the average over the last 5 years are presented in this paper. Present
NH3 [2000] NH3 [2030−2000] NOx [2000] NOx [2030−2000]
SO2 [2000] SO2 [2030−2000] VOC [2000] VOC [2030−2000]
BC [2000] BC [2030−2000] OC [2000] OC [2030−2000]
0.0 0.2 0.4 0.6 0.8 1.0 1.5 3.0 −5.0 −2.0 −0.5 −0.1 0.0 0.2 1.0 0.0 0.2 0.4 0.6 0.8 1.0 1.5 3.0 −5.0 −2.0 −0.5 −0.1 0.0 0.2 1.0
Fig. 1. Annual mean emission flux [g/m2/yr] for the year 2000 and the difference between the year 2030 and 2000, of NH3, NOx, SO2,
VOC, black carbon, and organic carbon.
day and future climate conditions are driven by sea surface temperature and sea ice conditions from a transient model run using the coupled atmosphere-ocean mode Russell et al. (2000). That simulation assumes an 0.5% increase of CO2 concentrations and leads to an increase in global mean sea surface temperature of 0.78◦C and to a slightly more humid
environment. The model configuration in this study, except for the part involving nitrate and dust aerosols, is similar as in Unger et al. (2006), where the physical climate change is discussed in greater detail.
Two experiments are carried out under current climate conditions: A baseline experiment (CTR-00) using current emission levels and an experiment using current climate but future emissions (E30-00). In order to understand future ni-trate concentrations, a series of sensitivity studies is carried out where either the climate or only one emission species is altered. Several experiments are run for future climate con-ditions: A baseline experiment, using the appropriate future emissions (CTR-30), three experiments where one of the fol-lowing emissions, SO2 (SO2-00), NOx (NOx-00) or NH3 (NH3-00) was set respectively to its 2000 values, and one experiment where no heterogeneous interactions on mineral dust surfaces took place (HET-30).
4 Current aerosol evalulation
Evaluating a coarse GCM simulation of nitrate aerosols with observations is a fairly difficult task, because the complex chemistry and the short lifetime of nitrate aerosols can lead to large gradients in concentrations in small areas, that can-not be represented within a coarse resolution model, where one single grid box covers the domain of 400×500 km. Nev-ertheless, to demonstrate that our model is able to represent the general characteristics of present day ammonium-nitrate concentrations, the following data sets are used for evalu-ation: Surface measurements of the European EMEP, the North American IMPROVE and the global Prospero (Pros-pero, 1995) network, and vertical profiles from various mea-surement campaigns around the world, carried out between 1994 until 2004.
Figure 2 presents the models annual mean surface nitrate mass overlaid by the observations from the EMEP and IM-PROVE networks and from D. Savoie and J. Prospero (per-sonal communication, November 1999). If not otherwise no-ticed, the total nitrate aerosol mass, thus the sum of ammo-nium nitrate and nitrate aerosol is compared to the bulk ni-trate mass observations. In Fig. 2 it is clearly visible, that the model underestimates nitrate especially in the remote ar-eas when heterogeneous dust chemistry is not included in the
0.0
0.2
0.3
0.4
0.6
0.7
0.9
1.0
1.2
1.4
Fig. 2. Annual mean surface concentrations of total nitrate aerosol mass. The filled circles show measurements as observed by the EMEP,
IMPROVE and the Prospero network. The upper panel shows fine mode ammonium-nitrate aerosol only, the middle panel the sum of fine and coarse mode nitrate, and the lower panel shows fine and coarse mode nitrate, but excluding the observations. Units are in [µg m−3].
model simulation. Overall the simulation matches the obser-vations on the global scale, but the model underestimates the observations in certain regions. Unfortunately, we only had two surface observations off the coast of China available, to
evaluate East Asian air pollution. The model shows a pollu-tion plume over North East China, but much smaller concen-trations downwind of this area, therefore we conclude that the entire East Asian nitrate mass is underestimated in the
Vysokoe J F MAM J J A S ON D 0.0 0.5 1.0 1.5 2.0 N O 3 Aliartos J F MAM J J A S ON D 0.0 0.5 1.0 1.5 2.0 Greece J F MAM J J A S ON D 0.0 0.5 1.0 1.5 2.0 Montelibretti J F MAM J J A S ON D 0.0 0.5 1.0 1.5 2.0 Leovo J F MAM J J A S ON D 0.0 0.5 1.0 1.5 2.0 N O 3 Witteveen J F MAM J J A S ON D 0.0 0.5 1.0 1.5 2.0 N O 3 Eibergen J F MAM J J A S ON D Month 0.0 0.5 1.0 1.5 2.0 N O 3 Birkenes J F MAM J J A S ON D 0.0 0.5 1.0 1.5 2.0 Diabla Gora J F MAM J J A S ON D 0.0 0.5 1.0 1.5 2.0 Aspvreten J F MAM J J A S ON D 0.0 0.5 1.0 1.5 2.0 Svityaz J F MAM J J A S ON D 0.0 0.5 1.0 1.5 2.0 Rava*Russkaya J F MAM J J A S ON D Month 0.0 0.5 1.0 1.5 2.0 Month
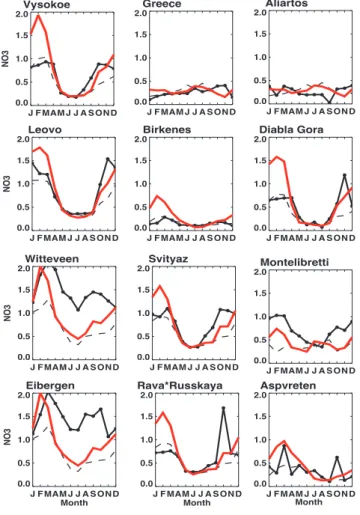
Fig. 3. Monthly mean total nitrate concentrations (red line),
mod-elled fine mode nitrate only (dashed line) and observations from the EMEP network (black dashed line), shown for a selection of repre-sentative stations. Values are shown for the year 2000 in [µg m−3].
model. This conclusion is confirmed by the comparison with aircraft data (see Fig. 5) from the ACE ASIA (Huebert et al., 2003) measurement campaign, where the model underesti-mates the observed values by an order of magnitude in the planetary boundary layer. These very large differences be-tween measurement and simulations can only be explained by dramatic underestimation of the emission data in East Asia. Similar results were seen by a multi-model compar-ison to CO observations (Shindell et al., 2006). Hence we suggest that there may be a general bias in Asian emissions spanning over multiple species.
A much smaller difference of about 0.2 µg/m3 appears over the South Pacific. We speculate that in this region, surface reactions between nitrate and sea salt particles are of importance, a reaction that is missing in this model run. The dense European network shows large gradients in nitrate mass that the model has difficulties to represent, but overall the model represents European nitrate mass very well, except
ME J F MAM J J A S O N D 0.0 0.5 1.0 1.5 2.0 N O 3 MN J F MAM J J A S O N D 0.0 0.5 1.0 1.5 2.0 N O 3 NJ J F MAM J J A S O N D 0.0 0.5 1.0 1.5 2.0 FL J F MAM J J A S O N D 0.0 0.5 1.0 1.5 2.0 N O 3 AK J F MAM J J A S O N D Month 0.0 0.5 1.0 1.5 2.0 N O 3 WV J F MAM J J A S O N D Month 0.0 0.5 1.0 1.5 2.0 TN J F MAM J J A S O N D 0.0 0.5 1.0 1.5 2.0 VT J F MAM J J A S O N D 0.0 0.5 1.0 1.5 2.0 KY J F MAM J J A S O N D 0.0 0.5 1.0 1.5 2.0 VA J F MAM J J A S O N D 0.0 0.5 1.0 1.5 2.0 AL J F MAM J J A S O N D 0.0 0.5 1.0 1.5 2.0 AR J F MAM J J A S O N D Month 0.0 0.5 1.0 1.5 2.0
Fig. 4. Monthly mean total nitrate concentrations (red line),
mod-elled fine mode nitrate only (dashed line) and observations from the IMPROVE network (black dashed line), shown for a selection of representative IMPROVE stations. Values are shown for the year 2000 in [µg m−3].
some high pollution measurements that exceed 1.5 µg/m3on an annual average.
Figures 4 and 3 show the annual cycle of measured and observed nitrate mass. The tendency to underestimate North American nitrate mass, as seen in Fig. 2 seems to be caused in the winter. The model shows at several European stations too high nitrate concentrations in the winter month, caused by corse mode nitrate. Possibly, too much Saharan dust is transported in the model to Europe in that season.
Figure 5 presents aircraft campaign data, compared to the model average for the month the campaign took place. Over-all the model follows nicely the vertical distribution of nitrate in the atmosphere. Including heterogeneous dust chemistry improves the performance of the model, although it leads occasionally to overprediction of nitrate between 3–8 km height. It is interesting to note how strongly nitrate aerosols are effected by these heterogeneous reactions, especially in
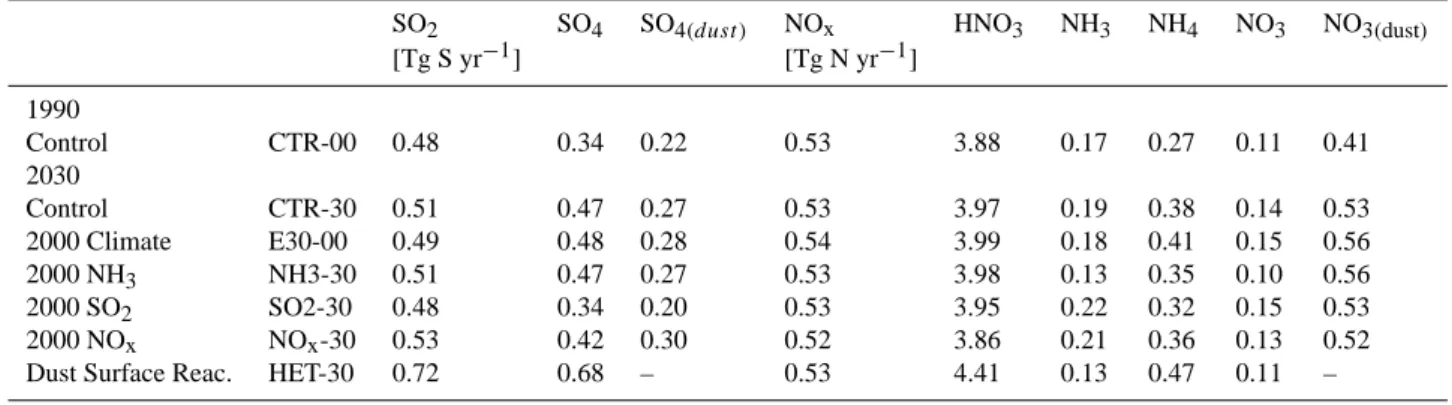
Table 2. Annual mean aerosol and trace gas burden.
SO2 SO4 SO4(dust ) NOx HNO3 NH3 NH4 NO3 NO3(dust)
[Tg S yr−1] [Tg N yr−1] 1990 Control CTR-00 0.48 0.34 0.22 0.53 3.88 0.17 0.27 0.11 0.41 2030 Control CTR-30 0.51 0.47 0.27 0.53 3.97 0.19 0.38 0.14 0.53 2000 Climate E30-00 0.49 0.48 0.28 0.54 3.99 0.18 0.41 0.15 0.56 2000 NH3 NH3-30 0.51 0.47 0.27 0.53 3.98 0.13 0.35 0.10 0.56 2000 SO2 SO2-30 0.48 0.34 0.20 0.53 3.95 0.22 0.32 0.15 0.53 2000 NOx NOx-30 0.53 0.42 0.30 0.52 3.86 0.21 0.36 0.13 0.52
Dust Surface Reac. HET-30 0.72 0.68 – 0.53 4.41 0.13 0.47 0.11 –
the regions of the PEM tropics campaign (South Pacific) and ACE ASIA (East Asia).
5 Current and future atmospheric composition
Future nitrate aerosol concentrations are influenced by cli-mate and emission changes. The clicli-mate change due to CO2 increases as simulated in the GISS model between the years 2000 and 2030 is described in detail by Unger et al. (2006), which used with the same model version as employed in this study. In summary, the 2030 atmosphere is warmer and more humid, with an increase of 0.78◦C in global annual mean
sur-face air temperature. A large sursur-face air temperature warm-ing exceedwarm-ing 2◦C occurs over the South and North Polar
regions, central North America and central Asia. 5.1 Atmospheric composition
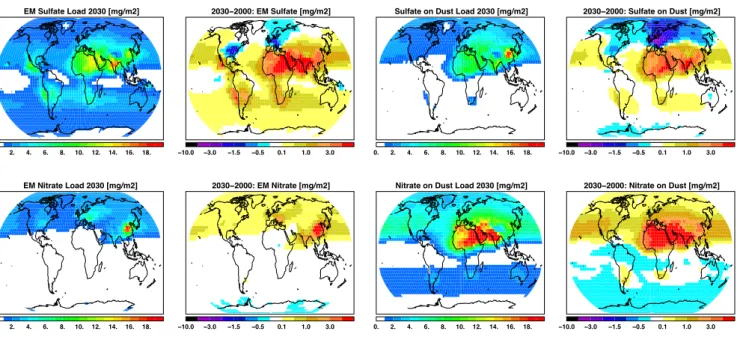
As discussed in Sect. 2 sulfuric acid competes with nitrate for ammonia. Therefore we discuss the change in future sul-phate first before referring to nitrate. Figure 6 shows maps of the difference between 2000 and 2030 in near surface con-centrations. The changes in near surface SO2concentrations follow closely the changes in SO2 emissions (see Fig. 1), and carry forward into the changes seen in the near surface ammonium and sulphate distributions. Sulphate concentra-tions decrease in Europe and the United States and increase elsewhere. The changes between 2000 and 2030 in column burden of fine mode sulphate and sulphate that has formed on dust surfaces (see Fig. 8) shows a similar pattern as pre-sented for the near surface concentrations. The global mean fine mode sulphate burden increases from 0.34 to 0.47 [Tg S yr−1], between 2000 and 2030 and sulphate on dust from 0.22 to 0.27 [Tg S yr−1] (see Table 2). This will lead to an overall increase of 24% in total sulphate mass present in the atmosphere.
The changes in near surface concentrations (Fig. 6) of am-bient NOxand nitric acid, reflect the changes in NOx
emis-sions (Fig. 1). The changes in ambient near surface ammonia concentrations are more complex. Increased NH3in China and India, and smaller increases in Europe, USA and Aus-tralia, colocate with the changes in its emissions. However NH3decreases, occurring in Arabia, Central and East Africa and South America, collocate with increased SO2emissions, which in turn leads to enhanced sulphate formation, whereby more ammonia is removed from the ambient air. The changes in the near surface nitrate aerosol concentrations generally reflect the discussed changes in ambient ammonia and NOy concentrations. This causes a large increase in near surface nitrate aerosols in China of 3 µg m−3, a moderate increase of 1 µg m−3in Europe and India, and a slight decrease in Cen-tral U.S. The atmospheric load of fine mode nitrate aerosols has similar horizontal distributions in 2000 and 2030, al-though the concentrations in the already most polluted re-gions increase even more. The most dramatic increase in the column burden of nitrate aerosols is projected to take place in East China. The global mean load of fine mode nitrate increases from 0.11 to 0.14 [Tg N yr−1], and the mass of ni-trate that is attached on mineral dust from 0.41 to 0.53 [Tg N yr−1]. Overall this would be an increase of 22% of nitrate material in our atmosphere within a time period of 30 years.
6 Sensitivity studies
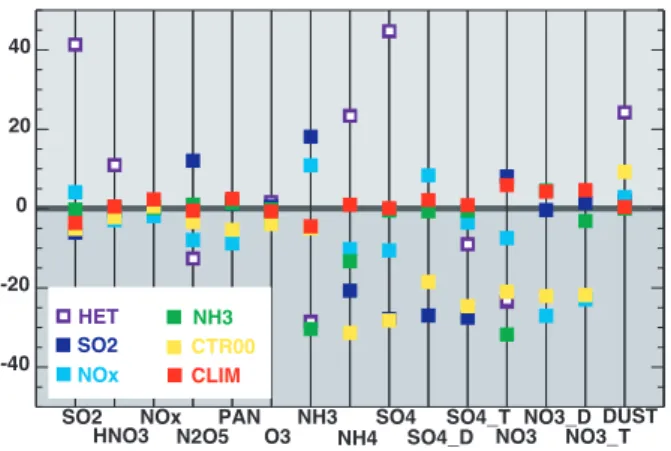
A series of sensitivity studies are carried out, as described in Sect. 3. The results are summarized in Fig. 9 where the percentage changes in tropospheric burdens of SO2, HNO3, NOx, PAN (peroxyacytyl nitrate), tropospheric ozone, NH3 and NH4, pure sulphate, pure nitrate, dust, sulphate on dust (named SO4 D), nitrate on dust (NO3 D), total nitrate (NO3 T) and total sulphate (SO4 T), are displayed compared to the base experiment CTR-30.
Present day simulation (CTR-00): Here we compare
the two base-line experiments for the years 2000 and 2030. These are the same two experiments as already described in detail in Sect. 5. Generally, all trace gas and aerosol burdens
INTEX−A 2004 0.1 1.0 10.0 100.01000.0 JUL 0 2 4 6 8 10 12 14 INTEX−A 2004 0.1 1.0 10.0 100.01000.0 AUG 0 2 4 6 8 10 12 14 TRACE−P 2001 0.1 1.0 10.0 100.01000.0 MAR 0 2 4 6 8 10 12 14 TRACE−P 2001 0.1 1.0 10.0 100.01000.0 APR 0 2 4 6 8 10 12 14 PEM−WEST−B 1994 0.1 1.0 10.0 100.01000.0 FEB 0 2 4 6 8 10 12 14 PEM−WEST−B 1994 0.1 1.0 10.0 100.01000.0 MAR 0 2 4 6 8 10 12 14 PEM TropicsB 1999 0.1 1.0 10.0 100.01000.0 MAR 0 2 4 6 8 10 12 14 PEM TropicsB 1999 0.1 1.0 10.0 100.01000.0 APR 0 2 4 6 8 10 12 14 ACE ASIA 2001 0.1 1.0 10.0 100.01000.0 APR 0 2 4 6 8 10 12 14
Fig. 5. Vertical profiles of nitrate concentrations in [pptv] as
ob-served during various field campaigns by the DC8 air plane (black line), compared to the models total (fine and coarse mode) nitrate (red line) and its fine mode fraction (black dotted line) only. The ti-tle shows the name and the year or the campaign, and the subtiti-tle the month. INTEX-A covers Eastern US (Singh et al., 2006), TRACE-P the North Hemispheric Western Pacific (Jacob et al., 2003), PEM-WEST-B the Western Pacific (Hoell et al., 1997), PEM-Tropics the Southern Pacific (Raper et al., 2001) and ACE-ASIA East Asia and the Northern Pacific (Huebert et al., 2003). The model date are in-terpolated to the flight tracks and then the monthly mean vertical profiles are calculated.
show smaller amounts under present day condition compared to the future. However, the percentage change in airborne NOxand ozone are rather small and near surface ozone con-centrations are reduced by 10%. The only tracer with larger amount is mineral dust. This is because our simulated dust solubility depends on pollution coating on its surface. In a less polluted atmosphere, solubility will be smaller and there-fore the overall dust burden larger. Changes in ammonium, sulphate and nitrate are substantial, between 20–30%.
Future emissions, present day climate (CLIM): In this
ex-periment the model was run under physical climate condi-tions of the year 2000 but using the anthropogenic gas and aerosol emissions for the year 2030. In comparison to all
2030−2000: Sulfate 2030−2000: SO2
2030−2000: NOx 2030−2000: HNO3
2030−2000: NH4 2030−2000: NH3
−1.0 −0.5 −0.3 −0.2 −0.2 −0.1 −0.1 −0.0 0.0 0.1 0.1 0.2 0.3 0.5 2030−2000: Nitrate
Fig. 6. Difference between the years 2030 and 2000 in near surface
concentrations, in [µg/m3], of SO2, NOx, HNO3, NH4, NH3and
fine mode nitrate.
the other sensitivity experiments, this case shows the lowest impact on the atmospheric composition. The global mean nitrate aerosol burden is increased by 6% compared to the CTR-2030 experiment. This is caused by a slight increase in ammonium oxidation, due to enhanced OH as humidity is increased. However, the overall signal is small and the largest percentage change is seen in nitrate aerosol concen-trations, which especially increase in Europe, North America and China.
Future simulation with 2000 SO2emissions (SO2): In this experiment the future climate, 2030, was simulated as in the CTR-30 experiment, but the SO2emissions of the year 2000 are used, instead of its future projection. This experiment has a large impact on sulphate formation. Sulphates get re-duced by roughly 30%, which leads to an overall increase in nitrate aerosol of about 8%, because relatively smaller sul-phate concentrations leads to favorable reaction of ammonia with nitric acid to form ammonium nitrate instead of reaction with sulphate.
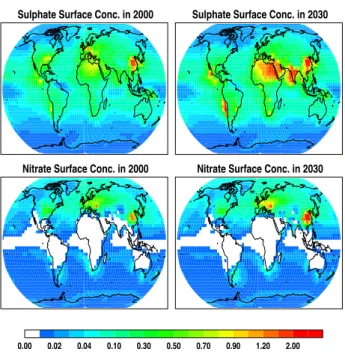
Sulphate Surface Conc. in 2000 Sulphate Surface Conc. in 2030
0.00 0.02 0.04 0.10 0.30 0.50 0.70 0.90 1.20 2.00 Nitrate Surface Conc. in 2000 Nitrate Surface Conc. in 2030
Fig. 7. Annual mean near surface concentrations of fine mode
sul-phate (upper panel) aerosols and nitrate (lower panel) for the year 2000, and 2030. Units are in [µg/m3].
Future simulation with 2000 NOxemissions (NOx): Here the future was simulated but with the NOxemissions fixed to present day emission levels. The year 2000 NOx emis-sions are 33% smaller than the predicted NOxemissions of the year 2030. Employing the lower NOx emissions in this sensitivity test leads consequently to smaller ambient NOx (−2%), HNO3(−3%), N2O5(−8%) and PAN (−9%) con-centrations. Near surface ozone concentration is decreased by −5%, but the overall ozone burden is just slightly re-duced, as most of the ozone mass is located in the upper tro-posphere. The overall impact on fine mode nitrate aerosol is a decrease of about 7% of its burden, and the nitrate material that is mixed with mineral dust particles is reduced by 23%. Most likely the reduced amount of nitrogen containing gases, especially the reduced ambient concentrations of nitric acid over the Sahara and the Arabian and Chinese deserts (which reflects the NOx emission changes as displayed in Fig. 1), leads to this strong effect on the development of nitrate coat-ings on mineral dust particles. However, the formation of sul-phate coatings is enhanced in this simulation, which might be caused by more free reactive mineral dust surfaces, due to the reduced amount of nitrate coatings. More sulphate coating, in turn leads to more oxidation of SO2and reduced concen-trations of externally mixed ammonium-sulphate.
Future simulation with 2000 NH3emissions (NH3): This time the future was simulated but neglecting the expected changes in ammonia emissions. Ammonia emissions have hardly any impact on the sulphate and the ozone cycle, but impact significantly nitrate production. Less NH3emissions
leads logically to less ambient NH3, NH4and consequently to less ammonium-nitrate aerosol, which is reduced by 30% relative to the CTR-30.
Excluding heterogeneous reactions on mineral dust sur-faces (HET): All simulations, baseline experiments and the
other sensitivity experiments, include the heterogeneous for-mation of nitrate and sulphate coatings on mineral dust surfaces. This reaction pathway impacts the formation of ammonium-sulfate and ammonium-nitrate aerosols, as well as the solubility of mineral dust (Bauer et al., 2007; Bauer and Koch, 2005; Bauer et al., 2004). In the sensitivity ex-periment HET no such heterogeneous reactions took place. The experiment emissions and physical climate are identi-cal to the baseline experiment CTR-30. Neglecting the ox-idation of SO2on dust, leads to larger ambient SO2(40%), ammonium-sulphate (45%) and mineral dust (25%) burden. Nitric acid is an important precursor gas for nitrate formation but also reacts with the mineral dust surfaces. Globally it is increased by 10% between CTR-30 and HET, but locally in the Northern African and Arabic regions the increase is much larger (up to 60% over India). Therefore the induced amounts of nitric acid in HET simulation would lead to increased ammonium nitrate aerosol formation. However, externally mixed ammonium nitrate mass is reduced in HET, especially in the Northern Hemisphere background atmosphere. This is caused by increased externally mixed sulphate concentra-tions in HET. Sulphate can be neutralized by ammonia, the residual amount of ammonia might neutralize nitric acid to form ammonium nitrate. In HET the higher sulphate con-centration leads to less free ammonia (−30%) and therefore a reduced nitrate production. This phenomenon was already discussed in Bauer et al. (2007) for current climate condi-tions. Due to the increase of SO2 and NOx sources (see
Fig. 1) at the coasts of Africa, China and the Arabian region, in direct vicinity of desert regions, this effect is much more pronounced in the more polluted, future atmosphere.
7 Radiative forcings
The global mean top of the atmosphere instantaneous radia-tive forcing (hereafter RF) is shown in Fig. 10 for ozone and for sulphate, nitrate, black and organic carbon and dust as a result of their individual contribution as external mixtures. The impact of sulphate and nitrate coatings on the optical properties of the coated dust particles is negligible as usually the shell thickness of the coating nitrate or sulphate material is too thin to significantly change the optical properties of the core dust particle (Bauer et al., 2007). RF are calculated as the sum of the individual short wave and long wave contribu-tions, however only ozone and mineral dust have significant forcing in the long-wave spectrum. Figure 10 shows maps of the forcings for the year 2000 and the changes between 2030 and 2000.
EM Sulfate Load 2030 [mg/m2]
0. 2. 4. 6. 8. 10. 12. 14. 16. 18.
2030−2000: EM Sulfate [mg/m2]
−10.0 −3.0 −1.5 −0.5 0.1 1.0 3.0
Sulfate on Dust Load 2030 [mg/m2]
0. 2. 4. 6. 8. 10. 12. 14. 16. 18. 2030−2000: Sulfate on Dust [mg/m2] −10.0 −3.0 −1.5 −0.5 0.1 1.0 3.0 EM Nitrate Load 2030 [mg/m2] 0. 2. 4. 6. 8. 10. 12. 14. 16. 18. 2030−2000: EM Nitrate [mg/m2] −10.0 −3.0 −1.5 −0.5 0.1 1.0 3.0
Nitrate on Dust Load 2030 [mg/m2]
0. 2. 4. 6. 8. 10. 12. 14. 16. 18.
2030−2000: Nitrate on Dust [mg/m2]
−10.0 −3.0 −1.5 −0.5 0.1 1.0 3.0
Fig. 8. Annual mean total column load for sulphate and nitrate aerosols of the year 2000, and the differences between 2030-2000. The first
two maps show the externally mixed (EM), fine mode, sulphate contribution and the following two maps the coarse mode sulphate mass that is mixed with mineral dust. The second row shows the same maps but for nitrate aerosol. Units are [mg/m2].
Table 3. Radiative forcings in different eras [W/m2].
1750 2000 2030 12000–1750 12030–2000 Sulphate −0.26 −0.45 −0.62 −0.19 −0.17 Nitrate −0.05 −0.11 −0.14 −0.06 −0.03 Black carbon +0.04 +0.33 +0.28 +0.29 −0.05 Organic carbon −0.04 −0.17 −0.14 −0.13 +0.03 Ozone −0.67 −0.40 −0.27 +0.27 +0.13 Dust −0.60 −0.57 −0.52 +0.03 +0.05 All −1.62 −1.37 −1.41 +0.25 −0.04
Nitrate aerosols, like sulphate, have a single scattering albedo close to unity and therefore mainly scatter solar ra-diation, which leads to a cooling of the atmosphere. Ni-trate aerosols lead to forcing signals in areas of high ni-trate burden. This forcing is enhanced for large RH as the particles take up water. Figure 10 shows that nitrate has a stronger negative forcing signal in the Northern Hemisphere, with local maximum values over China and Europe of up to
−1 W/m2. Further increase of the negative forcing is pre-dicted to happen in the next 30 years. All changes appear in the Northern Hemisphere, with again largest contributions over Europe and Asia. Locally the radiative forcing due to nitrate aerosols will be of the order of −4 W/m2over China. Sulphate aerosol predicted changes for the next 30 years show an increase in the tropical regions, especially over India (locally up to −3 W/m2). Due to SO2emission reductions in
the United States and Europe, sulphate forcing decreases in these regions. The future emission scenario we employed in this simulation predicts strong reductions in carbonaceous aerosols (Koch et al., 2007b), which leads to a reduction in absorbing black and scattering organic carbon. The positive radiative forcing of black carbon gets reduced mostly all over the Northern Hemisphere and the African biomass burning region. The reduction in organic carbon leads to a reduced negative forcing. The forcing signal of ozone is more ho-mogeneous because of its longer lifetime, and the increase of the global ozone concentration leads to a positive forc-ing. Ozone RF increases by 0.03 W/m2 in the short wave length and 0.1 W/m2in the long wave length. The changes we see in the mineral dust RF signal is mainly caused by solubility changes of the dust particles. In these simulations pure dust is assumed to be insoluble and nitrate or sulphate
SO2 HNO3 NOx N2O5 PAN O3 NH3 NH4 SO4 SO4_D SO4_T NO3 NO3_D NO3_T DUST -40 -20 0 20 40 HET SO2 NOx NH3 CTR00 CLIM
Fig. 9. Percentage change in gas and aerosol burdens of the
CTR-00, E30-00 (CLIM), SO2-CTR-00, NOx-CTR-00, NH3-00 and HET-30 exper-iment, compared to CTR-30. The global annual mean percentage changes are presented for gaseous: SO2, HNO3, NOx, PAN
(per-oxyacytyl nitrate), tropospheric ozone, NH3and NH4; and aerosols:
fine mode sulphate, coarse mode sulphate (SO4 D), total sulphate (SO4 T), fine mode nitrate (NO3), coarse mode nitrate (NO3 D), total nitrate (NO3 T) and mineral dust.
coatings influence its solubility, which leads to more wet de-position of dust in a more nitrate- and sulphate-polluted fu-ture atmosphere. Mineral dust scatters and absorbs solar ra-diation. Scattering dominates in the short wave spectra and therefore mineral dust changes have a negative short-wave RF of −0.08 W/m2, which is partly counterbalanced by its long wave contribution of 0.04 for RF.
The last map in Fig. 10 shows the net aerosol and ozone forcing. The overall change in RF has a negative sign, with strongest negative RFs over India and China. In these re-gions, the predicted sulphate and nitrate increases and black carbon decreases, all contribute to this large negative forcing. Overall negative RF changes dominate over land whereas the RF change is positive over oceans (mostly caused by the con-tribution of ozone RF), except the North Pacific where the Asian pollution plume contributes to a negative forcing. In the Arctic the forcing between present-day and pre-industrial (PI) is positive (Koch et al., 2007b), however it is projected to decline in the future (Koch et al., 2007a).
The magnitude of the global mean aerosol and ozone top of the atmosphere RFs are given in Table 3 for pre-industrial conditions (e.g. 1750), present day (year 2000) and the near future (2030). The pre-industrial numbers are derived from a run where all anthropogenic emissions where excluded. The run is discussed in detail in Bauer et al. (2007).
Before industrialization began, ozone and aerosols mostly contribute to cooling of this planet, and the largest contribu-tion came from the ozone molecules. According to our sim-ulation, under present day conditions sulphate particles play the leading role in cooling the atmosphere and this role will be even more pronounced in the near future. Nitrate aerosol
plays a smaller role, but it’s contribution has nearly tripled since pre-industrial times. In the near future nitrate will have a RF that is comparable to the RF of organic carbon.
8 Conclusions
The GISS climate model is used to study the role of nitrate aerosols in the changing atmosphere. Future emission pro-jection along the SRES A1B scenario were used to simulate the year 2030. This paper concentrates on the year 2030, the near future, because emission prediction are highly uncertain and uncertainty increases with projection length.
The evaluation of the present day nitrate concentration is difficult, because of the limited number of observational data and the coarse nature of our model. Surface observa-tions are available from the IMPROVE, EMEP and Prospero networks, and vertical profiles from various aircraft cam-paigns from around the world. The overall agreement be-tween model and data sets is good, but the model tends to underestimates nitrate mass by an order of magnitude in East Asia. We conclude that the ammonia emission (Bouwman et al., 1997) and the EDGAR inventory needs updating in that region. The comparison at remote stations showed the importance of the formation of nitrate on mineral dust parti-cles, because when only comparing the simulated fine mode fraction the measurements highly underestimate at the re-mote sites. Unfortunately, the measurement are bulk mass observations and don’t contain information on which mixing state the nitrate was observed.
Fine mode aerosol particles are dangerous air pollutants that have the ability to travel deep into the lungs and lead to serious health problems. The near surface concentrations of fine mode sulphate and nitrate particles show in our present day simulation maximum concentrations of about 1.5 µg/m3 in the most polluted areas like East China and Europe. In the year 2030 simulation, the fine sulphate and nitrate con-centration climb as high as 4 µg/m3in sulphate and 3 µg/m3 in nitrate concentrations. As nitrate pollution was already strongly underestimated in the present day simulation, we assume that the future numbers are underestimated as well. Note that these numbers reflect annual mean concentrations, and actual seasonal and daily maximum concentrations will reach much higher concentration levels.
Future nitrate concentrations result from changes in the physical and chemical state of the future atmosphere. To be able to understand which of the expected changes are most important for nitrate formation, we performed a series of sensitivity studies where one of the future predicted changes were kept at its current day conditions. Through these ex-periments we learned that the physical climate change, e.g. temperature and humidity rise, have only a very small im-pact on future nitrate concentrations. Studying the imim-pact of single emitted gas precursors showed that future nitrate de-pends most strongly on the emission strength of ammonia.
SO4 [2000] SO4 [2030−2000] O3 [2000] O3 [2030−2000]
NO3 [2000] NO3 [2030−2000] DU [2000] DU [2030−2000]
BC [2000] BC [2030−2000] ALL [2000] ALL [2030−2000]
OC [2000] OC [2030−2000]
−3.0 −2.0 −1.0 −0.1 0.1 0.5 1.5 −3.0 −2.0 −1.0 −0.1 0.1 0.5 1.5 −3.0 −2.0 −1.0 −0.1 0.1 0.5 1.5 −3.0 −2.0 −1.0 −0.1 0.1 0.5 1.5
Fig. 10. Top of the atmosphere radiative forcings [W/m2] of each individual aerosol species (fine mode sulphate (SO4) and nitrate (NO3),
black (BC) and organic (OC) carbon, mineral dust (DU) and ozone (O3). The maps entitled “ALL” shows the sum of all aerosols and gases, the net forcing. The forcings are shown for the year 2000 and the differences between 2030 and 2000.
Other changes in emitted gases like NOxand SO2, only play a minor role. In one of the sensitivity experiments the het-erogeneous reactions involving mineral dust particles are ne-glected. That experiment had a very strong impact on future nitrate concentration. And even beyond nitrate, this sensi-tivity experiment changed dramatically the concentrations of SO2, sulphate, N2O5, NH4, NH3and dust. In our simulation most of the aerosols are treated as external mixtures, only ni-trate and sulphates can mix with mineral dust, therefore this is only one step towards the representation of truly mixed and coated aerosol particles. Nevertheless it is interesting to see how important the consideration of mixtures might be, espe-cially for species like sulphates and nitrates that mainly form in the atmosphere out of precursor gases. These precursors are very likely to condense on existing particles in the atmo-sphere and therefore are likely to exist as aerosol mixtures or coatings, especially if the particles have been airborne and
aged for some time and were released or produced in areas where a mix of particles is already present in the air. For ex-ample in China, where urban pollution frequently mixes with dust particles.
Future emission inventories predict a large increase of pol-lution precursors around the Northern coasts of Africa and throughout Arabia. This pollution is very likely to mix with desert dust, as it’s sources are very close to the desert regions, therefore mixing between aerosol species might be getting even more pronounced in the future atmosphere.
In summary, we conclude from our sensitivity studies, that for understanding future ammonium-nitrate concentrations it is important to have good estimates of ammonia emissions and to have measurement data regarding the mixing state of aerosols.
In addition to the role aerosols play as dangerous air pollu-tants, they also interact with the climate system by interacting
with the Earths radiation budget and cloud microphysics. The latter point is not studied in this paper and possibly might have a greater impact on the Earth climate than direct radia-tive forcing. However, in our study we find for present day conditions a direct nitrate radiative forcing of −0.11 W m−2 which lies in between the forcings calculated in other studies:
−0.19 Adams et al. (2001), −0.16 Liao and Seinfeld (2005); Liao et al. (2006), −0.04 Jacobson (2001), −0.02 Myhre et al. (2006). Note that the studies estimating the smaller nitrate radiative forcings considered aerosol mixing. Myhre et al. (2006) who only considered nitrate and sea salt mixing found that the inclusion on sea salt and nitrate particle mix-tures reduced the aerosol optical thickness by 25%. Jacobson (2001) placed 90 % of his nitrate in the coarse mode, based on observational data. In a recent and more detailed study of aerosol thermodynamics Martin et al. (2004) found that burden and radiative forcing of nitrate was about 10–15% those of sulphate. Martin et al. (2004) also take into account formation of solids. They find that the combined radiative forcing of the nitrate/ammonia/sulphate aerosol changed by approximately 25% depending on whether the upper side or the lower side of the hysteresis loop controlling water up-take of the aerosol was used. None of these studies predicted aerosol concentrations for the year 2030, but Liao and Ad-mas calculated the RF for the year 2100 under the SRES A2 scenario, of −0.95 and −1.28 W/m2.
Compared to other aerosol forcings, in this paper nitrate RF has the same order of magnitude as organic carbon, and roughly a quarter of the magnitude of that of sulphate aerosols. These relations seem to be conserved in our sim-ulations during present day, pre-industrial and A1B 2030 conditions. Analyzing the changes between the different eras, pre-industrial and present-day and 2030, we find that the total change in aerosol and tropospheric ozone forcing changes from 0.25 W m−2 (1750–2000) to a negative forc-ing of −0.04 W m−2. These changes are mainly caused by the large reduction in carbonaceous emissions in the near fu-ture. In relation to the dramatic changes in black and organic carbon, nitrate RF increase is rather small. It is expected to increase by 0.03 W m−2in the next 30 years, compared to an increase of 0.06 W m−2in the last 250 years.
The role of aerosols in climate change is very com-plex, due to the absorbing and scattering nature of different aerosols which leads to negative and positive contributions that partly cancel out each other. Future emission scenar-ios that take into account emission reductions, for example like the reduced carbonaceous emission in the SRES A1B, will lead to an even smaller contribution of aerosol forcing in the future. In contrast we have the steadily increasing long lived greenhouse gas (LLGHG) emissions, like carbon diox-ide, methane, nitrogen oxide and CFCs, that are most likely steadily increasing. At present day the LLGHG contribute 2.6 W m−2 to the warming of our planet and are expected to rise up to 3.9 W m−2 by the year 2030 (?). The com-bined aerosol (excluding sea salt aerosols) and ozone RF is
−1.37 W m−2under current climate and −1.41 W/m2for the year 2030.
Acknowledgements. This work has been supported by the NASA
MAP program Modeling, Analysis and Prediction Climate Variability and Change (NN-H-04-Z-YS-008-N), managed by D. Anderson. We acknowledge the IMPROVE and EMEP network, and the NASA GTE campaign data sets. The author like to thank J. Crawford, for advice on the GTE data set (http://www-gte.larc.nasa.gov/).
Edited by: U. Lohmann
References
Adams, P. J., Seinfeld, J. H., Koch, D., Mickley, L., and Jacob, D.: General circulation model assessment of direct radiative forcing by the sulfate-nitrate-ammonium-water in-organic aerosol system, J. Geophys. Res, 106, 1097–1112, doi:10.1029/2000JD900 512, 2001.
Amundson, N. R., Caboussat, A., He, J. W., Martynenko, A. V., Savarin, V. B., Seinfeld, J. H., and Yoo, K.-Y.: A new inorganic atmospheric aerosol phase equilibrium model (UHAERO), At-mos. Chem. Phys., 6, 975–992, 2006,
http://www.atmos-chem-phys.net/6/975/2006/.
Ansari, A. S. and Pandis, S. N.: Prediction of multicomponent in-organic atmospheric aerosol behavior, Atmos. Environ., 33(5), 745–757, 1999.
Bassett, M. and Seinfeld, J. H.: Atmospheric equilibrium model of sulfate and nitrate aerosol, Atmos. Environ., 17, 2237–2252, 1983.
Bassett, M. and Seinfeld, J. H.: Atmospheric equilibrium model of sulfate and nitrate aerosols-II. particle size analysis, Atmos. Environ., 18, 1163–1170, 1984.
Bauer, S. E. and Koch, D.: Impact of Heterogeneous Sulfate For-mation at Mineral Dust Surfaces on Aerosol Loads and Radia-tive Forcing in the GISS GCM, J. Geophys. Rev., 112, D17202, doi:10.1029/2005JD005870, 2005.
Bauer, S. E., Balkanski, Y., Schulz, M., Hauglustaine, D. A., and Dentener, F.: Global modelling of heterogeneous chemistry on mineral aerosol surfaces: The influence on tropospheric ozone chemistry and comparison to observations, J. Geophys. Res., 109, D02304, doi:10.1029/2003JD003868, 2004.
Bauer, S. E., Mishchenko, M., Lacis, A., Zhang, S., Perl-witz, J., and Metzger, S.: Do Sulfate and Nitrate Coatings on Mineral Dust have Important Effects on Radiative Proper-ties and Climate Modeling?, J. Geophys. Rev., 112, D06307, doi:10.1029/2005JD006977, 2007.
Binkowski, F. and Shankar, U.: The regional particulate matter model, 1: model description and preliminary results, J. Geophys. Res., 100(D12), 26 191–26 210, doi:10.1029/95JD02093, 1995. Bond, T. C., Streets, D., Yarber, K., Nelson, S., Woo, J., and
Klimont, Z.: A technology-based global inventory of black and organic carbon emissions form combustion, J. Geophys. Res, 109, D14203, doi:10.1029/2003JD003697, 2004.
Bouwman, A. F., Lee, D. S., Asman, W. A. H., Dentener, F. J., Hoek, K. W. V. D., and Olivier, J.: A Global High-Resolution Emission Inventory for Ammonia, Global Biogeochem. Cycles, 11, 561–587, 1997.
Clegg, S. and Pitzer, K. S.: Thermodynamics of multicomponent, miscible, ionic solutions: generalized equations for symmetrical electrolytes, J. Phys. Chem, 96(8), 3513–3520.431, 1992. Clegg, S., Brimblecombe, P., and Wexler,
A. S.: Thermodynamic model of the system H+−NH+ 4−Na +−SO2− 4 −−NO − 3−Cl −−H 2O at 298.15 K, J.
Phys. Chem., 102, 2155.448–2171.449, 1998a.
Clegg, S. L., Pitzer, K. S., and Brimblecombe, P.: Thermodynamics of multicomponent, miscible, ionic solutions. mixtures including unsymmetrical electrolytes, J. Phys. Chem, 96(23), 9470–9479, 1992.
Clegg, S. L., Brimblecombe, P., and Wexler, A. S.: Thermodynamic model of the system H+−NH+
4−SO 2− 4 −NO
−
3−H2O at
tropo-spheric temperatures, J. Phys. Chem., A, 102(12), 2137–2154, 1998b.
Dentener, F. J., Carmichael, G. R., Zang, Y., Lelieveld, J., and Crutzen, P. J.: Role of mineral aerosol as a reactive surface in the global troposphere, J. Geophys. Res., 101, 22 869–22 889, 1996.
Feng, Y. and Penner, J. E.: Global modeling of nitrate and ammo-nium: Interaction of aerosols and tropospheric chemistry, J. Geo-phys. Res., 112, D01304, doi:10.1029/2005JD006404, 2007. Goodman, A. L., Underwood, G. M., and Grassian, V. H.: A
labora-tory study of the heterogeneous reaction of nitric acid on calcium carbonate particles, J. Geophys. Res., 105, 29 053–29 064, 2000. Guenther, A. B., Hewitt, N., Erickson, D., Fall, R., Geron, C., Graedel, T., Harley, P., Klinger, L., Lerdau, M., McKay, W. A., Pierce, T., Scholes, B., Steinbrecher, R., Tallamraju, R., Taylor, J., and Zimmerman., P.: A global model of natural volatile or-ganic compound emissions, J. Geophys. Res., 100, 8873–8892, 1995.
Hansen, J., Sato, M., Ruedy, R., Nazarenko, L., Lacis, A., Schmidt, G., Russell, G., Aleinov, I., Bauer, M., Bauer, S., Bell, N., Cairns, B., Canuto, V., Cheng, Y., Genio, A. D., Faluvegi, G., Flem-ing, E., Friend, A., Hall, T., Jackman, C., Kelley, M., Kiang, N., Koch, D., Lean, J., Lerner, J., Lo, K., Menon, S., Miller, R., Minnis, P., Novakov, T., Oinas, V., Perlwitz, J., Perlwitz, J., Rind, D., Romanou, D., Shindell, D., Stone, P., Sun, S., Tausnev, N., Thresher, D., Wielicki, B., Wong, T., Yao, M., and Zhang, S.: Efficacy of Climate Forcing, J. Geophys. Res., 110, D18104, doi:10.1029/2005JD005776, 2005.
Hoell, J. M., Davis, D. D., Liu, S. C., Newell, R. E., Akimoto, H., McNeal, R. J., and Bendura, R. J.: The Pacific Exploratory Mission-West Phase B: February-March 1994., J. Geophys. Res., 102, 28 223–28 240, 1997.
Huebert, B., Bates, T., Russell, P., Shi, G., Kim, Y., Kawamura, K., Carmichael, G., and Nakajima, T.: An overview of ACE-Asia: Strategies for quantifying the relationships between Asian aerosols and their climatic impacts, J. Geophys. Res, 108(D23), 8633, doi:10.1029/2003JD003550, 2003.
Jacob, D. J.: Heterogeneous chemistry and tropospheric ozone, At-mos. Environ., pp. 2131–2159, 2000.
Jacob, D. J., Crawford, J., Kleb, M., Connors, V. S., Bendura, R. J., Raper, J. L., Sachse, G. W., Gille, J. C., Emmons, L., and Held, C. L.: Transport and chemical evolution over the Pacific (TRACE-P) aircraft mission: Design execution and first results, J. Geophys. Res, 108(D20), 9000, doi:10.1029/2002JD003276, 2003.
Jacobson, M. Z.: Studying the effects of calcium and magnesium
on size-distributed nitrate and ammonium with EQUISOLV II, Atmos. Environ., 33(22), 3635–3649, 1999.
Jacobson, M. Z.: Global direct radiative forcing due to multicompo-nent anthropogenic and natural aerosols, J. Geophys Res., 106, 1551–1568, 2001.
Jacobson, M. Z., Tabazadeh, A., and Turco, R. P.: Development and Application of a new air pollution modelling system – Part I. Gas-Phase Simulations, Atmos. Environ., 30B, 1939–1963, 1996.
Kim, Y. P. and Seinfeld, J. H.: Atmospheric gas-aerosol equilibrium III. thermodynamics of crustal elements Ca2+−K+−Mg2+,
Aerosol Sci. Technol., 22(1), 93–110, 1995.
Kim, Y. P., Seinfeld, J. H., and Saxena, P.: Atmospheric gas-aerosol equilibrium I. thermodynamic model, Aerosol Sci. Technol., 19, 157–181, 1993a.
Kim, Y. P., Seinfeld, J. H., and Saxena, P.: Atmospheric gas-aerosol equilibrium II. analysis of common approximations and activity coefficient calculation methods, Aerosol Sci. Technol., 19, 182– 198, 1993b.
Kinne, S., Schulz, M., Textor, C., Guibert, S., Balkanski, Y., Bauer, S. E., Berntsen, T., Berglen, T., Boucher, O., Chin, M., Collins, W., Dentener, F., Diehl, T., Easter, R., Feichter, H., Fillmore, D., Ghan, S., Ginoux, P., Gong, S., Grini, A., Hendricks, J., Her-zog, M., Horrowitz, L., Isaksen, I., Iversen, T., Kloster, A. K. S., Koch, D., Kristjansson, J. E., Krol, M., Lauer, A., Lamarque, J., Lesins, G., Liu, X., Lohmann, U., Montanaro, V., Myhre, G., Penner, J., Pitari, G., Reddy, S., Seland, O., Stier, P., Takemura, T., and Tie, X.: An AeroCom initial assessment – optical prop-erties in aerosol component modules of global models, Atmos. Chem. Phys., 6, 1815–1834, 2006,
http://www.atmos-chem-phys.net/6/1815/2006/.
Koch, D. and Hansen, J.: Distant origins of Arctic soot: A GISS ModelE experiment, J. Geophys. Res, 110, D04204, doi:10.1029/2004JD005296, 2005.
Koch, D., Jacob, D., Tegen, I., Rind, D., and Chin, M.: Tro-pospheric sulfur simulation and sulfate direct radiative forcing in the Goddard Institute for Space Studies general circulation model, J. Geophys. Res., 104, 23 799–23 822, 1999.
Koch, D., Schmidt, G., and Field, C.: Sulfur, sea salt and ra-dionuclide aerosols in the GISS modelE, J. Geophys. Res., 111, D06206, doi:10.1029/2004JD005550, 2006.
Koch, D., Bond, T., Streets, D., and Unger, N.: Linking future aerosol radiative forcing to shifts in source activities., Geophys. Res. Lett., 34, L05821, doi:10.1029/2006GL028360, 2007a. Koch, D., Bond, T., Streets, D., Unger, N., and van der
Werf, G.: Global impacts of aerosols from particular source regions and sectors, J. Geophys. Res, 112, D02205, doi:10.1029/2005JD007024, 2007b.
Kulmala, M., Korhonen, P., Laaksonen, A., and Vesala, T.: Changes in cloud properties due to NOx emissions, Geophys. Res. Lett., 22, 239–242, 1995.
Kulmala, M., Toivonen, A., Mattila, T., and Korhonen, P.: Varia-tions of cloud droplet concentraVaria-tions and the optical properties of clouds due to changing hygroscopicity: A model study, J. Geo-phys. Res., 103, 16 183–16 195, 1998.
Liao, H. and Seinfeld, J. H.: Global impacts of gas-phase chemistry-aerosol interactions on direct radiative forcing by an-thropogenic aerosols and ozone, J. Geophys. Res., 110, D18208, doi:10.1029/2005JD005907, 2005.
![Table 1. Anthropogenic and natural trace gas emissions. 2000 2030 1 [%] NO x [Tg N/yr] natural 16.3 16.5 +1 anthropogenic 29.9 53.5 +79 NH 3 [TgN/yr] natural 14.4 14.4 – anthropogenic 39.7 58.1 +46 SO 2 [Tg S/yr] natural 11.8 11.9 +1 anthropogenic 72.1 96.](https://thumb-eu.123doks.com/thumbv2/123doknet/14771629.591514/5.892.124.378.132.461/anthropogenic-natural-emissions-natural-anthropogenic-natural-anthropogenic-anthropogenic.webp)
![Fig. 1. Annual mean emission flux [g/m 2 /yr] for the year 2000 and the difference between the year 2030 and 2000, of NH 3 , NO x , SO 2 , VOC, black carbon, and organic carbon.](https://thumb-eu.123doks.com/thumbv2/123doknet/14771629.591514/6.892.81.823.91.532/fig-annual-emission-difference-black-carbon-organic-carbon.webp)

![Fig. 6. Difference between the years 2030 and 2000 in near surface concentrations, in [µg/m 3 ], of SO 2 , NO x , HNO 3 , NH 4 , NH 3 and fine mode nitrate.](https://thumb-eu.123doks.com/thumbv2/123doknet/14771629.591514/10.892.75.436.88.574/fig-difference-years-near-surface-concentrations-hno-nitrate.webp)
![Fig. 10. Top of the atmosphere radiative forcings [W/m 2 ] of each individual aerosol species (fine mode sulphate (SO 4 ) and nitrate (NO 3 ), black (BC) and organic (OC) carbon, mineral dust (DU) and ozone (O 3 )](https://thumb-eu.123doks.com/thumbv2/123doknet/14771629.591514/14.892.78.823.93.653/atmosphere-radiative-forcings-individual-aerosol-species-sulphate-nitrate.webp)
