Effect of electron-phonon interaction on
lattice thermal conductivity of SiGe alloys
The MIT Faculty has made this article openly available. Please share
how this access benefits you. Your story matters.
Citation Xu, Qian et al. "Effect of electron-phonon interaction on lattice
thermal conductivity of SiGe alloys." Applied Physics Letters 115, 2 (July 2019): 023903.
As Published http://dx.doi.org/10.1063/1.5108836
Publisher AIP Publishing
Version Author's final manuscript
Citable link https://hdl.handle.net/1721.1/130054
Terms of Use Creative Commons Attribution-Noncommercial-Share Alike
Effect of Electron-Phonon Interaction on Lattice Thermal Conductivity of SiGe Alloys
Qian Xu,1 Jiawei Zhou,1 Te-Huan Liu,1 and Gang Chen1, a
1Department of Mechanical Engineering, Massachusetts Institute of Technology,
Cambridge, Massachusetts 02139, USA
(Dated: 27 May 2019) ABSTRACT
While it is well-known that electron-phonon scattering often determines the electron mobility, its impact on lattice thermal conductivity is less clear. Dominant phonon scattering mechanisms that determine the lattice thermal conductivity have been attributed to phonon-phonon and phonon-defect interactions. However, recent studies in silicon have shown that strong electron-phonon interaction can also lead to significant phonon scatterings at high carrier concentrations. Here we use first-principles simulations to study thermal transport in SiGe alloys and show that the effect of electron-phonon interaction on thermal transport is even more significant than in Si, because mass disorder scattering leaves long mean free path phonons behind which are more strongly scattered by electrons. At the carrier concentration of 1×1020 cm−3, the room temperature lattice thermal conductivity of Si0.9Ge0.1 alloy including electron-phonon interaction is only 40% of the value without this interaction. The results show that thermal transport in alloys at high doping level can be significantly impacted by the free carriers, providing important insights on heat conduction mechanisms in thermoelectric materials which are mostly based on heavily-doped alloys.
Thermal conductivity plays an important role in determining a material’s thermoelectric performance as the maximum efficiency of thermoelectric power generator is governed by the dimensionless figure of merit 𝑧𝑧𝑧𝑧 = 𝑆𝑆2𝜎𝜎𝑧𝑧 𝜅𝜅⁄ ,1 where S is the Seebeck coefficient, σ is the electrical conductivity, κ is the thermal conductivity, and T is the temperature. In thermoelectric materials, phonon and electron are the major heat carriers and the thermal conductivity could be divided into two parts, 𝜅𝜅 = 𝜅𝜅𝑙𝑙+ 𝜅𝜅𝑒𝑒, where
κe denotes the contribution by electrons and κl denotes the contribution by phonons. The
former is named as the electronic thermal conductivity and the latter as the lattice thermal conductivity. In most semiconductors, 𝜅𝜅𝑙𝑙 is the dominant term in 𝜅𝜅 = 𝜅𝜅𝑙𝑙+ 𝜅𝜅𝑒𝑒 when the carrier concentration is not extremely high (< 1 × 1020 cm−3). Therefore, one of the major approaches to improve materials’ 𝑧𝑧𝑧𝑧 is to lower the lattice thermal conductivity.
Alloying has been found to be an effective approach to enhance the electrical to thermal conductivity ratio since the mass fluctuation scatters phonons more effectively than electrons (or holes).2–4 This strategy has been applied to a wide variety of traditional thermoelectric materials including (Bi1-xSbx)2Te3 alloys for room-temperature use, PbTe1-xSex alloys for moderate-temperature use, and the Si1-xGex alloys for high-temperature use.4
The lattice thermal conductivity has a finite value because phonons are scattered by other phonons, carriers, boundary, defects etc. during their transport. When the temperature is not very low, the dominant scattering mechanism of phonons for most of materials is intrinsic phonon-phonon interaction.5,6 First-principles calculations that take intrinsic phonon-phonon interactions (three-phonon process, four-phonon process) are able to give satisfactory thermal conductivity results that agree with measurements when the carrier concentration is not high for a wide variety of materials, e.g. bulk Si and Ge,7,8 SiGe alloys,9 diamond,8 BAs.8,10–12 However, for thermoelectric materials, which are usually heavily doped, the carrier concentration typically goes above 1×1019 cm−3 and electron-phonon interaction starts to play an important role in determining phonon lifetime. While electron-phonon interaction usually determines the electron mobility at room and higher temperatures and moderate doping, its impact on the lattice thermal conductivity is difficult to qualify. Influence of electron-phonon interaction on lattice thermal conductivity has been reported in GaSb,13 Co1-xNixSb314 and Mo3Sb715 by studying the relationship between measured thermal resistivity and temperature as well as the
carrier-concentration dependence. A recent first-principles study in silicon16 shows that electron-phonon interaction can significantly reduce the lattice thermal conductivity when the carrier concentration is high. However, in the case of SiGe alloys, which are
used for power generation in deep-space missions,4 it has been well-known that the
lattice thermal conductivity has already been largely reduced by alloy scattering
compared to pure silicon or germanium,17 and it was not clear that if electron-phonon
interaction would further reduce the lattice thermal conductivity significantly.
In this letter, we investigate the effect of electron-phonon interaction on the lattice thermal conductivity of n-type SiGe alloys via first-principles calculations. In addition to electron-phonon interaction, we also include intrinsic three-phonon scattering and alloy-phonon scattering when calculating the lattice thermal conductivity of SiGe alloys (details of those calculations are given in supplementary material). We use the effective phonon relaxation time 𝜏𝜏𝐪𝐪𝜆𝜆 obtained from Matthiessen’s rule 1/𝜏𝜏𝐪𝐪𝜆𝜆 = ∑ 1/𝜏𝜏𝑗𝑗 where 𝑗𝑗
indicates different scattering mechanisms of phonons.7 We found that electron-phonon
scattering has even stronger effects on the lattice thermal conductivity in SiGe alloys than in pure Si or pure Ge, because long-wavelength phonons that carry heat in alloys are more effectively scattered by electrons.
From the definition of the lattice thermal conductivity, we have
𝜅𝜅𝑙𝑙 = 𝑁𝑁1𝑞𝑞Ω− ∑𝜆𝜆,𝐪𝐪ℏ𝜔𝜔∇𝑇𝑇𝐪𝐪𝜆𝜆𝐯𝐯𝐪𝐪𝜆𝜆Δ𝑛𝑛𝐪𝐪𝜆𝜆 , (1) where 𝐯𝐯𝐪𝐪𝜆𝜆 and 𝜔𝜔𝐪𝐪𝜆𝜆 are the group velocity and the frequency of the phonon with wavevector 𝐪𝐪 at branch 𝜆𝜆, Δ𝑛𝑛𝐪𝐪𝜆𝜆 = 𝑛𝑛𝐪𝐪𝜆𝜆− 𝑛𝑛𝐪𝐪𝜆𝜆0 denotes the nonequilibrium phonons since the equilibrium phonons (𝑛𝑛𝐪𝐪𝜆𝜆0 is the Bose-Einstein distribution) do not contribute to the heat flux, ∇𝑧𝑧 is the temperature gradient, Ω is the volume of the unit cell and 𝑁𝑁𝑞𝑞 is the number of q-points on the q-mesh on which we sum over in the reciprocal space in our first-principles calculations. Using the linearized Boltzmann transport equation (see supplementary material part A), we get the expression of the lattice thermal conductivity (equation (2)) that can be calculated using phonon’s information obtained from first-principles calculations
𝜿𝜿𝐥𝐥 =𝑘𝑘𝐵𝐵𝑇𝑇12𝑁𝑁𝑞𝑞Ω∑𝜆𝜆,𝐪𝐪 𝑛𝑛0𝐪𝐪𝜆𝜆(𝑛𝑛𝐪𝐪𝜆𝜆0 + 1)(ℏ𝜔𝜔𝐪𝐪𝜆𝜆)2𝐯𝐯𝐪𝐪𝜆𝜆⋅ 𝐯𝐯𝐪𝐪𝜆𝜆𝜏𝜏𝐪𝐪𝜆𝜆 , (2)
The summation over the Brillouin zone in equation (2) is carried out in our modified
on a same q-mesh is output from electron-phonon calculations using EPW19 code and read into ShengBTE calculations), under the relaxation time approximation to the phonon Boltzmann transport equation. More details of electron-phonon scattering calculations are given in supplementary material.
Figure 1(a) shows the comparison between our calculated thermal conductivity of n-type SiGe alloys at room temperature with literature values. Steele’s samples include both n-type and p-type ones, and the electrical resistivity varies from 2 to 70 Ω·cm (having an electrical resistivity of 0.006 Ω·cm is approximately equivalent to having a carrier concentration of 1.2×1018 cm−3).20 Dismukes et al.21 measured the thermal conductivity of n-type SiGe alloys with a carrier concentration of 1.5 × 1020 cm−3, which agrees well with our calculated heavily-doped (with a carrier concentration of 1 × 1020 cm−3) SiGe alloys’ lattice thermal conductivity. We should note that, in figure 1(a), the experimental data includes the electronic component of the thermal conductivity and we show our results in both cases with or without electronic thermal conductivity (details of electronic thermal conductivity calculations are given in supplementary material). Our calculated results show that, at the carrier concentration of 1019 cm−3, the electronic
thermal conductivity is still much smaller (κe/κl < 3%) than the lattice thermal
conductivity with electron-phonon interaction taken in to account. The electronic thermal conductivity of SiGe alloys is typically about 1.5 W/mK and the κe/κl ratio varies
from 2% to 35% when the carrier concentration goes to 1020 cm−3. The experimental data from Dismukes is slightly lower than our calculated total thermal conductivity, which can be explained by the larger carrier concentration of the samples (stronger electron-phonon interaction), and also possible defects in the samples that are not captured by the virtual crystal approximation method. Our calculated lattice thermal conductivity of SiGe alloys at 150K is also given in figure 1(b). The curves basically share the same trend with the ones in figure 1(a) but the absolute values of the lattice thermal conductivity increase compared to 300K. This is due to that phonon-phonon interaction becomes much weaker for less phonons are populated at lower temperatures. The increase in the lattice thermal conductivity with decreasing temperature is more prominent at low carrier concentrations than at high carrier concentrations for the strong electron-phonon scattering would largely suppress the lattice thermal conductivity.
FIG. 1. Calculated thermal conductivity of SiGe alloys at different carrier concentrations, n = 1020 cm−3, n = 1017 cm−3 and without electron-phonon interaction (EPI). Intrinsic three-phonon scattering and alloy-phonon scattering are considered for all the curves. Yellow and green curves include EPI. (a) T = 300K, with comparison to experiments20,21. The electronic thermal conductivity (ETC) is also added for the dashed curves. (b) T = 150K. The y-axis is cut that the maximum value is set to 70 W/mK to show the difference between the curves more clearly.
As we can see in figure 1, the two curves of n = 1017 cm−3 and without electron-phonon interaction (EPI) almost overlap completely, which means that at low carrier concentrations, electron-phonon interaction has a minor effect on the lattice thermal conductivity. However, as the carrier concentration reaches n = 1020 cm−3, the reduction of the lattice thermal conductivity due to EPI becomes much more significant. We further plot the κEPI/κnoEPI ratio (lattice thermal conductivity that takes EPI into account/lattice thermal conductivity without considering EPI) in figure 2. We can see at 300 K, and at the carrier concentration of n = 1020 cm−3, electron-phonon interaction can reduce the lattice thermal conductivity to only 40% of the value if it is not included, and down to only 30% at 150K. At 1100K, the effect of electron-phonon interaction on the lattice thermal conductivity is less significant due to stronger intrinsic phonon scattering, but it could still reduce the lattice thermal conductivity to only 70% of the value if it is not included (see figure S5 and S6 in supplementary material). The degree of reduction is intuitively determined by the relative strength of electron-phonon scattering compared to the sum of intrinsic phonon scattering and alloy-phonon scattering. For example, this can explain why the reduction percentage in Ge is lower than that in Si: (1) there is no alloy-phonon scattering for pure Si or pure Ge and (2) pure Si has weaker intrinsic phonon scattering and stronger EPI than Ge (those calculated scattering rates are given in figure S1-S3 in supplementary material). The intrinsic phonon-phonon scattering rate increases with Ge content, since Ge is heavier, shifting the density of states to lower frequency. Alloy-phonon scattering rate is the strongest when Si content and Ge content are roughly equal. At low carrier concentrations, the intrinsic phonon scattering and alloy scattering are the dominant scattering mechanisms. Around 15% Si, the change in alloy scattering rate compensates the change in intrinsic phonon scattering so the lattice thermal conductivity stays almost constant. However, it is not apparent why the reduction percentage in pure Si is smaller than its neighboring Si-rich alloys, given that in the Si-rich region, both the intrinsic phonon scattering rate and the alloy-phonon scattering rate decrease while the EPI gets stronger as the composition approaches pure Si. We further do spectrum analysis to explain this.
Figure 3 takes Si0.1Ge0.9 at 300Kas an example. Figure 3(a) shows the mean free path (MFP) distribution for phonons with different frequencies in three cases: 1) only intrinsic phonon scattering is included, 2) adding alloy scattering and 3) also adding electron-phonon scattering. The three kinds of electron-phonon scattering rates are plotted in figure 3(b).
By comparing the three cases, we can see at high carrier concentrations (here n = 1×10²⁰
cm−3), electron-phonon scattering is the dominant scattering mechanism for
low-frequency and long-wavelength phonons that typically have longer mean free path. The high-frequency phonons are heavily scattered by mass disorder in the alloy and they typically have shorter mean free path.
FIG. 2. κEPI/κnoEPI ratio (lattice thermal conductivity that takes EPI into account/lattice thermal conductivity without considering EPI) at different carrier concentrations. (a) T = 300K, (b) T = 150K.
FIG. 3. (a) Phonon mean free path and (b) phonon scattering rates due to intrinsic phonon scattering, alloy-phonon scattering and electron-phonon scattering vs. phonon frequency, for Si0.1Ge0.9 at 300K.
Figure 4 shows accumulated lattice thermal conductivity versus phonon mean free path in lightly-doped and heavily-doped SiGe alloys at 300K and it delivers the same key messages as figure 3 does. The comparison between the solid curves and the dashed curves tells that electron-phonon interaction has an impact on phonons with mean free path ≥ 1µm. In short, the phonons scattered by electrons and the phonons scattered by mass difference in SiGe alloys are spectrally different. This justifies that the reduction in
FIG. 4. Accumulated lattice thermal conductivity vs. phonon mean free path in lightly-doped (n= 1×1015 cm−3, solid curves) and heavily-doped (n= 1×1020 cm−3, dashed curves) samples, T = 300K. (a) In pure Si and pure Ge, (b) in three alloy compositions: Si0.99Ge0.01, Si0.6Ge0.4 and Si0.1Ge0.9.
the lattice thermal conductivity caused by electron-phonon interaction in Si-rich alloys is more significant than in pure Si in terms of percentage. We also note from figure 4 that due to electron-phonon scattering of long mean free path phonons, relative fraction of phonons with mean free path larger than certain nanoscale structure characteristic
length corresponding to, for example, diameter of a nanoparticle, is smaller. This suggests that, though nanostructuring is important in reducing thermal conductivity as it is widely pursued in thermoelectric materials research,22–26 its impacts on the lattice thermal conductivity may be smaller than recognized before due to scattering of long mean free path phonons by charge carriers in heavily-doped materials.
In conclusion, our first-principles calculations show that in heavily-doped n-type SiGe alloys, electron-phonon interaction has a big impact on the lattice thermal conductivity because it predominantly scatters phonons with long mean free path. The lattice thermal conductivity including electron-phonon interaction can be only 40% of the value without including the interaction at the carrier concentration of 1 × 1020 cm−3 at room temperature. These findings suggest that thermal transport in alloys at high doping level can be significantly affected by the charge carriers, which was often neglected before. This work presents insights on mechanisms of thermal conductivity reduction in thermoelectric materials that are usually heavily-doped alloys.
SUPPLEMETARY MATERIAL
See supplementary material for more calculation details and the cases of high temperature and p-type SiGe alloys.
ACKNOWLEDGEMENT
This work is supported by DARPA Matrix Program (Grant No. HR0011-162-0041 for supporting its thermoelectrics programs).
REFERENCES
1 G.S. Nolas, J. Sharp, and J. Goldsmid, Thermoelectrics: Basic Principles and New Materials
Developments (Springer Science & Business Media, 2013).
2 A.F. Ioffe, L.S. Stil’bans, E.K. Iordanishvili, T.S. Stavitskaya, A. Gelbtuch, and G. Vineyard, Phys. Today 12, 42 (1959).
3 B. Abeles, Phys. Rev. 1046, (1963).
4 D. (Ed) Rowe, CRC Handbook of Thermoelectrics (CRC Press, Boca Raton, Florida, 1995).
5 P.G. Klemens, Thermochim. Acta 218, 247 (1993).
6 J.M. Ziman and P.W. Levy, Phys. Today 14, 64 (1961).
7 D.A. Broido, M. Malorny, G. Birner, N. Mingo, and D.A. Stewart, Appl. Phys. Lett. 91, 231922 (2007).
8 T. Feng, L. Lindsay, and X. Ruan, Phys. Rev. B 96, 161201 (2017).
9 J. Garg, N. Bonini, B. Kozinsky, and N. Marzari, Phys. Rev. Lett. 106, 45901 (2011). 10 S. Li, Q. Zheng, Y. Lv, X. Liu, X. Wang, P.Y. Huang, D.G. Cahill, and B. Lv, Science 361, 579 (2018).
11 J.S. Kang, M. Li, H. Wu, H. Nguyen, and Y. Hu, Science (80-. ). 361, 575 (2018).
12 F. Tian, B. Song, X. Chen, N.K. Ravichandran, Y. Lv, K. Chen, S. Sullivan, J. Kim, Y. Zhou, T.-H. Liu, M. Goni, Z. Ding, J. Sun, G.A.G. Udalamatta Gamage, H. Sun, H. Ziyaee, S. Huyan, L. Deng, J. Zhou, A.J. Schmidt, S. Chen, C.-W. Chu, P.Y. Huang, D. Broido, L. Shi, G. Chen, and Z. Ren, Science (80-. ). 361, 582 (2018).
13 A.M. Poujade and H.J. Albany, Phys. Rev. 182, 802 (1969).
14 J. Yang, D.T. Morelli, G.P. Meisner, W. Chen, J.S. Dyck, and C. Uher, Phys. Rev. B 65, 094115 (2002).
15 X. Shi, Y. Pei, G.J. Snyder, and L. Chen, (n.d.).
115901 (2015).
17 B. Abeles, D.S. Beers, G.D. Cody, and J.P. Dismukes, Phys. Rev. 125, 44 (1962).
18 W. Li, J. Carrete, N.A. Katcho, and N. Mingo, Comput. Phys. Commun. 185, 1747 (2014).
19 S. Poncé, E.R. Margine, C. Verdi, and F. Giustino, Comput. Phys. Commun. 209, 116
(2016).
20 M.C. Steele and F.D. Rosi, J. Appl. Phys. 29, 1517 (1958).
21 J.P. Dismukes, L. Ekstrom, E.F. Steigmeier, I. Kudman, and D.S. Beers, J. Appl. Phys. 35, 2899 (1964).
22 D.M. Rowe, V.S. Shukla, and N. Savvides, Nature 290, 765 (1981). 23 G.A. Slack and M.A. Hussain, J. Appl. Phys. 2694, (1991).
24 B. Poudel, Q. Hao, Y. Ma, Y. Lan, A. Minnich, B. Yu, X. Yan, D. Wang, A. Muto, D. Vashaee, X. Chen, J. Liu, M.S. Dresselhaus, G. Chen, and Z. Ren, Science (80-. ). 320, 634 (2008). 25 X.W. Wang, H. Lee, Y.C. Lan, G.H. Zhu, G. Joshi, D.Z. Wang, J. Yang, A.J. Muto, M.Y. Tang, J. Klatsky, S. Song, M.S. Dresselhaus, G. Chen, and Z.F. Ren, Appl. Phys. Lett. 93, 1 (2008). 26 G. Joshi, H. Lee, Y. Lan, X. Wang, G. Zhu, D. Wang, R.W. Gould, D.C. Cuff, M.Y. Tang, M.S. Dresselhaus, and others, Nano Lett. 8, 4670 (2008).
Effect of Electron-Phonon Interaction on Lattice Thermal Conductivity of SiGe Alloys
Qian Xu,1 Jiawei Zhou,1 Te-Huan Liu,1 and Gang Chen1, 2
1Department of Mechanical Engineering, Massachusetts Institute of Technology, Cambridge,
Massachusetts 02139, USA
(Dated: 31 May 2019)
SUPPLEMENTARY MATERIAL
A. Derivation of lattice thermal conductivity
The linearized Boltzmann transport equation (equation (S.1)) within the relaxation time approximations for phonon is given in equation (S.2))
𝐯𝐯 ⋅ ∇𝐫𝐫𝑓𝑓0+ℏ𝐅𝐅⋅ ∇𝐤𝐤𝑓𝑓0 = −𝑓𝑓−𝑓𝑓
0
𝜏𝜏 . (S.1)
If not specified, we use ∇ instead of ∇𝐫𝐫 for simplicity. 𝐯𝐯𝐪𝐪𝜆𝜆∇𝑛𝑛𝐪𝐪𝜆𝜆0 = −𝑛𝑛𝐪𝐪𝜆𝜆−𝑛𝑛𝐪𝐪𝜆𝜆
0
𝜏𝜏𝐪𝐪𝜆𝜆 . (S.2)
Equation (S.2) can be rearranged into
Δ𝑛𝑛𝐪𝐪𝜆𝜆 = −𝜏𝜏𝐪𝐪𝜆𝜆𝐯𝐯𝐪𝐪𝜆𝜆∇𝑧𝑧∂𝑛𝑛𝐪𝐪𝜆𝜆
0
∂𝑇𝑇 . (S.3) Plug equation (S.3) into the expression of the lattice thermal conductivity (equation (1) in the letter) and with
∂𝑛𝑛𝐪𝐪𝜆𝜆0 ∂𝑇𝑇 = − ℏ𝜔𝜔𝐪𝐪𝜆𝜆 𝑘𝑘𝐵𝐵𝑇𝑇2𝑛𝑛𝐪𝐪𝜆𝜆 0 �𝑛𝑛 𝐪𝐪𝜆𝜆 0 + 1� , (S.4) we will get equation (2) in the letter.
B. Phonon-phonon scattering calculations
The three-phonon scattering rates calculated for five compositions are shown in figure S1. For easier comparison between different compositions, we zoom in the range of phonon frequency ≤ 3.5 THz in figure S2.
FIG. S1. Calculated phonon-phonon scattering rate of SiGe alloys, (a) T= 300K, (b) T = 150K.
FIG. S2. Calculated phonon-phonon scattering rate of SiGe alloys, zoom in the range of phonon frequency ≤ 3.5 THz. (a) T = 300K, (b) T = 150K.
C. Electron-phonon scattering calculations
To reduce the computation complexity of the electron-phonon calculations, we make the first-order approximation and assume electrons are at their equilibrium, that is, electrons obey Fermi-Dirac distribution and we do not take the effect of scattering events on electrons’ state into account. We will use these results for nonequilibrium case when
we are calculating the lattice thermal conductivity, assuming the deviation of the electrons’ state from equilibrium is small.
TABLE S1. Possible electron-phonon scattering events for a phonon
phonon initial state final state momentum
relation energy relation
emitted 𝐤𝐤 α 𝐤𝐤′β 𝐤𝐤 − 𝐤𝐤′ − 𝐪𝐪 = 0 𝜀𝜀𝐤𝐤𝛼𝛼− 𝜀𝜀𝐤𝐤′𝛽𝛽 − ℏ𝜔𝜔𝐪𝐪𝜆𝜆= 0
absorbed 𝐤𝐤α 𝐤𝐤′β 𝐤𝐤 + 𝐪𝐪 − 𝐤𝐤′ = 0 𝜀𝜀𝐤𝐤𝛼𝛼 − 𝜀𝜀𝐤𝐤′𝛽𝛽+ ℏ𝜔𝜔𝐪𝐪𝜆𝜆 = 0
We list the possible electron-phonon scattering events for a phonon with the wavevector 𝐪𝐪 and the frequency 𝜔𝜔 at branch 𝜆𝜆 in Table S1, where 𝐤𝐤 or 𝐤𝐤′ denote electron’s wavevector, 𝛼𝛼 or 𝛽𝛽 denote different electronic bands, and 𝜀𝜀 denotes electron’s energy. From Fermi’s golden rule, the transition rate of the phonon of wavevector 𝐪𝐪 at branch 𝜆𝜆 due to electron-phonon interaction can be expressed as
�∂𝑛𝑛∂𝑡𝑡 �𝐪𝐪𝜆𝜆 e−ph = 𝑁𝑁1 𝑘𝑘 2𝜋𝜋 ℏ �𝛼𝛼,𝛽𝛽 �𝐤𝐤,𝐤𝐤′ � +𝑓𝑓𝐤𝐤𝛼𝛼�1 − 𝑓𝑓𝐤𝐤′𝛽𝛽�(𝑛𝑛𝜆𝜆+ 1)𝑁𝑁𝑒𝑒𝑒𝑒𝑒𝑒𝑒𝑒 −𝑓𝑓𝐤𝐤𝛼𝛼�1 − 𝑓𝑓𝐤𝐤′𝛽𝛽�𝑛𝑛𝜆𝜆𝑁𝑁𝑎𝑎𝑎𝑎𝑎𝑎𝑎𝑎𝑎𝑎𝑎𝑎 � , (S. 5)
where we represent the emission and absorption rate elements as 𝑁𝑁𝑒𝑒𝑒𝑒𝑒𝑒𝑒𝑒 and 𝑁𝑁𝑎𝑎𝑎𝑎𝑎𝑎𝑎𝑎𝑎𝑎𝑎𝑎. 𝑁𝑁𝑒𝑒𝑒𝑒𝑒𝑒𝑒𝑒 = �2𝑒𝑒0ℏ𝜔𝜔 𝐪𝐪𝜆𝜆� |〈𝐤𝐤 ′𝛽𝛽�∂ 𝐪𝐪𝜆𝜆𝑉𝑉�𝐤𝐤𝛼𝛼〉|2𝛿𝛿(𝐤𝐤 − 𝐤𝐤′− 𝐪𝐪)𝛿𝛿�𝜀𝜀𝐤𝐤𝛼𝛼− 𝜀𝜀𝐤𝐤′𝛽𝛽− ℏ𝜔𝜔𝐪𝐪𝜆𝜆� , 𝑁𝑁𝑎𝑎𝑎𝑎𝑎𝑎𝑎𝑎𝑎𝑎𝑎𝑎= �2𝑒𝑒0ℏ𝜔𝜔 𝐪𝐪𝜆𝜆� |〈𝐤𝐤 ′𝛽𝛽�∂ 𝐪𝐪𝜆𝜆𝑉𝑉�𝐤𝐤𝛼𝛼〉|2𝛿𝛿(𝐤𝐤 + 𝐪𝐪 − 𝐤𝐤′)𝛿𝛿�𝜀𝜀𝐤𝐤𝛼𝛼 + ℏ𝜔𝜔𝐪𝐪𝜆𝜆 − 𝜀𝜀𝐤𝐤′𝛽𝛽� , (S.6) ∂𝑉𝑉𝐪𝐪𝜆𝜆 is the perturbed potential for a phonon of given mode 𝜆𝜆 and wavevector 𝐪𝐪 due to a collective motion of atoms sitting on different atomic sites. The (ℎ/ 2𝑚𝑚0𝜔𝜔𝐪𝐪𝜆𝜆)1/2|〈𝐤𝐤′𝛽𝛽| ∂_𝐪𝐪𝜆𝜆 𝑉𝑉|𝐤𝐤𝛼𝛼〉| is the electron-phonon interaction matrix element, 𝑚𝑚0 is the mass of one unit cell, |𝐤𝐤𝛼𝛼〉 and |𝐤𝐤′𝛽𝛽〉 describe the eigenstates of electrons. Noticing the summations of 𝛼𝛼 and 𝛽𝛽 are over the same possible electronic bands so they are equivalent, same as 𝐤𝐤 and 𝐤𝐤′, we can switch 𝛼𝛼 with 𝛽𝛽 and 𝐤𝐤 with 𝐤𝐤′ in 𝑁𝑁𝑎𝑎𝑎𝑎𝑎𝑎𝑎𝑎𝑎𝑎𝑎𝑎 at the same time to combine 𝑁𝑁𝑒𝑒𝑒𝑒𝑒𝑒𝑒𝑒 and 𝑁𝑁𝑎𝑎𝑎𝑎𝑎𝑎𝑎𝑎𝑎𝑎𝑎𝑎 terms. The rate at which 𝑛𝑛𝐪𝐪𝜆𝜆 relaxes due to scattering by electrons can be defined as
1 𝜏𝜏𝐪𝐪𝜆𝜆,el−ph ≡ − 𝛿𝛿 𝛿𝛿𝑛𝑛𝐪𝐪𝜆𝜆� ∂𝑛𝑛𝐪𝐪𝜆𝜆 ∂𝑒𝑒 �e−ph , (S.7)
where 𝛿𝛿/(𝛿𝛿𝑛𝑛𝐪𝐪𝜆𝜆 ) is the variational derivative respect to 𝑛𝑛𝐪𝐪𝜆𝜆. After some algebra, we obtain the phonon scattering rate by electrons1
1 𝜏𝜏𝐪𝐪𝜆𝜆,el−ph = 1 𝑁𝑁𝑘𝑘 2𝜋𝜋 ℏ ∑𝛼𝛼,𝛽𝛽 ∑𝐤𝐤,𝐤𝐤′� ℏ 2𝑒𝑒0𝜔𝜔𝐪𝐪𝜆𝜆� |〈𝐤𝐤′𝛽𝛽| ∂𝐪𝐪𝜆𝜆𝑉𝑉|𝐤𝐤𝛼𝛼〉| 2(𝑓𝑓 𝐤𝐤𝛼𝛼− 𝑓𝑓𝐤𝐤′𝛽𝛽) 𝛿𝛿(𝐤𝐤 − 𝐤𝐤′− 𝐪𝐪)𝛿𝛿�𝜀𝜀 𝐤𝐤𝛼𝛼− 𝜀𝜀𝐤𝐤′𝛽𝛽− ℏ𝜔𝜔𝐪𝐪𝜆𝜆� , (S.8) The implementation of the electron-phonon interaction calculation follows our group’s previous studies.2,3 A Monkhorst-Pack grid4 is an unbiased method of choosing a set of points for sampling the Brillouin zone. In fractional coordinates, it is a rectangular grid of points of dimensions nx×ny×nz, spaced evenly throughout the Brillouin zone. The larger the dimensions of the grid, the finer and more accurate will be the sampling. Hereinafter we refer k-mesh to the reciprocal space sampling in electronic band calculations, q-mesh mostly to the reciprocal space sampling in phonon calculations. We
use Wannier method5,6 to interpolate the information obtained from DFT and DFPT
calculations using QUANTUM ESPRESSO7 on the coarse meshes (a 12×12×12 k-mesh and
a 6×6×6 q-mesh) onto a 60×60×60 k-mesh and a 60×60×60 q-mesh. The interpolation is
implemented in the EPW code8 which uses routines from Wannier90 code6 to calculate
the Wannier functions. The EPW8 code allows 𝐤𝐤′to fall outside the first Brillouin zone and can calculate the energy of an electron state with wavevector that is outside the first Brillouin zone directly without folding the wavevector back to the first Brillouin zone, getting the same energy as for its counterpart inside the first Brillouin zone. Therefore, we can loop over the initial and the final states using the relations between 𝐤𝐤, 𝐤𝐤′ and 𝐪𝐪 in Table S1 and do not need to differentiate between the normal process (crystal momentum conserves) and the Umklapp process (crystal momentum does not conserve). Tetrahedra integration method9 is used for the integration that loops over the initial and final states while conserving energy. Our calculated room temperature phonon scattering rate by electrons vs. phonon frequency is shown in figure S3.
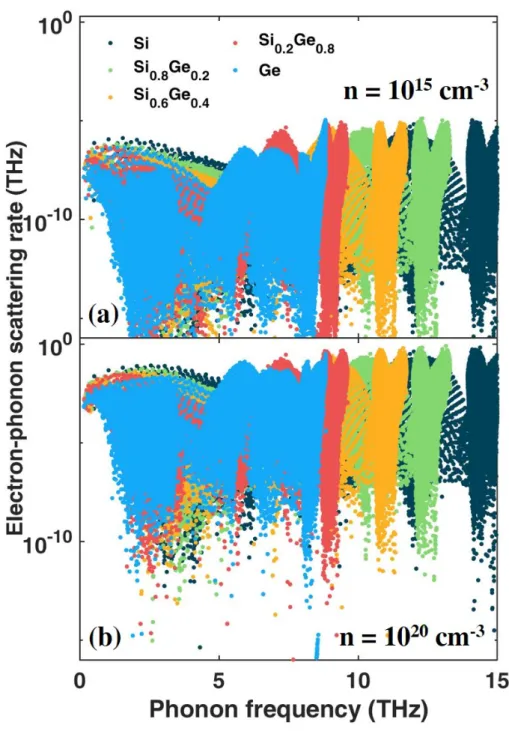
Because electrons’ energy scale is much larger than the energy scale of phonons and because the energy difference between electrons of two very different wavevectors will be way too large for a phonon to provide or carry, phonons with larger wavevectors are less likely to be scattered by electrons. In other words, since the phonon frequency is proportional to the phonon wavevector for acoustic phonons near the Γ point, as phonon frequency increases, the scattering phase space of phonons will be more restricted by the energy and momentum selection rules and thus gets smaller, as we can see in figure S3, the scattering rate decreases with increasing phonon frequency. Optical phonons have higher energy thus larger scattering phase space and higher electron-phonon scattering rate compared to acoustic phonons. Phonon scattering rate by electrons is higher at the
silicon side than at the germanium side, which can be explained by the size of the scattering phase space determined by their different phonon dispersion and electronic band structure, as well as the electron-phonon interaction strength that is related to the perturbed potential ∂𝑉𝑉𝐪𝐪𝜆𝜆.
FIG. S3. Calculated phonon scattering rate by electrons of SiGe alloys vs. phonon frequency, n denotes the n-type carrier concentration, T = 300K. (a) n= 1015 cm−3, (b) n=
1020 cm−3.
The general trend is that the electron-phonon coupling that relates to the perturbed potential ∂𝑉𝑉𝐪𝐪𝜆𝜆 is stronger at the Si side than at the Ge side. Figure S3 also tells that the
phonon scattering by electrons is more significant at higher carrier concentrations, for electron-phonon “collisions" are more likely to happen when the carrier concentration gets higher.
D. Alloy-phonon scattering calculations
The lattice thermal conductivity of a semiconducting or insulating single crystal alloy is usually lower than the average of the thermal conductivities of the constituent materials. This can be attributed to phonon’s scattering by a combined effect of the mass difference, the difference in the elastic constants of the nearest linkages, and of the strain field in alloys.10 However, taking the strain and interatomic force constants difference effects into account in first-principles calculation would require the self-consistent atomic relaxation of extremely large supercells. Given the difficulties and the minor resulting effect on the total thermal conductivity,11,12 the force constants differences and strain effect will be neglected here, and the alloy scattering on phonon will be treated as mass-difference scattering.
We adapt an approach from the virtual crystal approximation method in Garg et al.’s
work13 for alloy-phonon scattering calculations, where they calculated the phonon
modes of the virtual crystal of any given composition, derived from those the frequencies, group velocities, and populations that enter into the calculation of thermal conductivity. We construct the virtual crystals using the atomic masses calculated from equation (S.9) and the pseudopotentials calculated from equation (S.10). The averaging of
pseudopotentials can be done using the virtual.x program in QUANTUM ESPRESSO7
package.
𝑚𝑚vca= 𝑥𝑥𝑚𝑚Si+ (1 − 𝑥𝑥)𝑚𝑚Ge , (S.9) 𝑉𝑉vca= 𝑥𝑥𝑉𝑉Si+ (1 − 𝑥𝑥)𝑉𝑉Ge , (S.10) The lattice parameters are relaxed around their linearly-interpolated values. The disordered lattice in the real alloy is replaced by the ordered virtual crystal and the disorder is treated as a perturbation. An atom of the virtual crystal is replaced by an atom of Si or Ge and it acts as a virtual impurity and scatters phonons. In general, the virtual impurity atom would differ from the atoms of the virtual crystal in its mass, size as well as the coupling forces to its neighbors. As a result of the anharmonicity, the coupling
forces are modified by the misfit strain field in the neighborhood of the impurity.14 However, as mentioned above, we here only consider mass disorder scattering.
Klemens10 has studied the scattering of phonons by static imperfections. By using
perturbation theory, he derived expressions for the single-mode phonon relaxation time due to scattering by a substitutional atom of different mass. Tamura’s work15 on isotope scattering also comes down to phonon scattering caused by mass disorder. Their results both show that in highly disordered alloys, high-frequency phonons are strongly
scattered (scattering rate ∝ ω4) and the heat is mostly transported by low-frequency
phonons that have long mean free path.
Let fi be the atomic fraction of the atom i, mvca = ∑ fimi (this is essentially the same
with equation (S.9)) is the average mass in the solid. The perturbation due to mass difference Hmd is16
𝐻𝐻𝑒𝑒𝑚𝑚 = � 𝑛𝑛
1
2(𝑚𝑚vca− 𝑚𝑚𝑒𝑒)𝐮𝐮̇𝑛𝑛2 , (S. 11) where 𝐮𝐮𝑛𝑛 is the lattice displacement vector
𝐮𝐮𝐧𝐧(𝐫𝐫) = −𝑖𝑖(2𝑁𝑁ℏ0𝑒𝑒0)
1
2∑𝐪𝐪𝜆𝜆 (𝜔𝜔𝐪𝐪𝜆𝜆)−12�𝑎𝑎𝐪𝐪𝜆𝜆− 𝑎𝑎−𝐪𝐪𝜆𝜆† �𝐞𝐞𝐪𝐪𝜆𝜆exp[𝑖𝑖(𝐪𝐪 ⋅ 𝐫𝐫𝐧𝐧− 𝜔𝜔𝑡𝑡)] . (S.12)
𝑁𝑁0 is the number of unit cell in the crystal and 𝑚𝑚0 is the mass of the unit cell. Again with Fermi’s golden rule and single-mode relaxation time approximation, the mass disorder scattering rate can be obtained10,17
1 𝜏𝜏𝐪𝐪𝜆𝜆 = 𝜋𝜋𝜔𝜔2 2𝑁𝑁0∑𝐪𝐪′𝜆𝜆′ 𝛿𝛿(𝜔𝜔𝜆𝜆− 𝜔𝜔𝜆𝜆′) ∑𝑒𝑒∈unitcell 𝑔𝑔(𝑖𝑖)|𝐞𝐞𝜆𝜆 ∗(𝑖𝑖) ⋅ 𝐞𝐞 𝜆𝜆′(𝑖𝑖)|2 , (S.13)
where 𝐞𝐞𝜆𝜆(𝑖𝑖) is the phonon eigenfuntion of mode 𝜆𝜆 at the 𝑖𝑖𝑒𝑒ℎ atom, g is the Pearson deviation coefficient calculated by
𝑔𝑔(𝑖𝑖) = ∑𝑒𝑒∈Si,Ge 𝑓𝑓𝑒𝑒(1 −𝑒𝑒𝑒𝑒vca𝑖𝑖 )2 . (S.14)
Equation (S.13) is implemented in ShengBTE package18 to account for scattering by
isotopic disorder, and we adapt it for alloy-phonon scattering calculation since they are
essentially the same mass disorder scattering. Klemens and Tamura10,17 obtained
𝜏𝜏(𝜔𝜔)−1∝ 𝜔𝜔4 by further simplifying equation (S.13) using isotropic continuum
approximation (which is based on the reasoning that at low temperatures most of the phonons excited in a solid are confined to small-wavevector and long-wavelength acoustic branches. Within this approximation, details of crystal structure are ignored,
and the isotropic relation ωqλ = cq with c as the phase velocity, is used for all the normal
modes lying within a sphere of radius q). The integration over the Brillouin zone in
equation (S.13) is carried out in ShengBTE package18 using a 60×60×60 q-mesh, under
the relaxation time approximation to the phonon Boltzmann transport equation. The calculated phonon scattering rate is shown in figure S4. We can see that the alloy-phonon scattering rate is the largest when the silicon content and germanium content are close (approaching the composition of Si0.5Ge0.5) which can be intuitively interpreted as that the “randomness" is the greatest at this point. We fit the mass disorder scattering rate obtained using equation (S.13) with respect to the phonon frequency, and find a good match with Klemens and Tamura’s 𝜏𝜏(𝜔𝜔)−1 ∝ 𝜔𝜔4 scaling rule for the low-frequency phonons. Si0.6Ge0.4 is taken as an example to show the fitting curves in figure S4.
FIG. S4. Phonon scattering rate due to mass disorder of SiGe alloys.
E. Electronic thermal conductivity
The expression of the heat flow when there are both electric field and temperature gradient is as below19
𝐉𝐉𝑞𝑞 = 𝐉𝐉𝜀𝜀 − 𝜀𝜀𝑓𝑓𝐉𝐉𝑛𝑛 = ∑𝛼𝛼,𝐤𝐤�𝜀𝜀−𝜀𝜀𝑁𝑁𝑓𝑓�𝐯𝐯𝐤𝐤𝛼𝛼Δ𝑓𝑓𝐤𝐤𝛼𝛼
where 𝐉𝐉𝑞𝑞, 𝐉𝐉𝜀𝜀, 𝐉𝐉𝑛𝑛 are the heat flux, the energy flux, and the particle flux, 𝐯𝐯𝐤𝐤𝛼𝛼 and 𝜀𝜀 are the group velocity and energy of the electron with wavevector 𝐤𝐤 at band 𝛼𝛼, 𝜀𝜀𝑓𝑓 is the Fermi level, Δ𝑓𝑓𝐤𝐤𝛼𝛼 = 𝑓𝑓𝐤𝐤𝛼𝛼− 𝑓𝑓𝐤𝐤𝛼𝛼0 is the nonequilibrium electrons that contributes to heat flux since equilibrium electrons (𝑓𝑓𝐤𝐤𝛼𝛼0 is the Fermi-Dirac distribution) do not contribute to heat flux, Ω is the volume of the unit cell and 𝑁𝑁𝑘𝑘 is the number of the k-points on the k-mesh on which we sum over in the recirpocal space. For electrons under the condition of an electric field and a temperature gradient, both the Fermi level 𝜀𝜀𝑓𝑓 and the temperature are functions of location and the ∇𝐫𝐫𝑓𝑓𝐤𝐤𝛼𝛼0 term in the linearized Boltzmann transport equation for electrons becomes
−∂𝑓𝑓𝐤𝐤𝛼𝛼0 ∂𝜀𝜀 ∇𝐫𝐫𝜀𝜀𝑓𝑓+ 𝜀𝜀𝑓𝑓−𝜀𝜀 𝑇𝑇 ∂𝑓𝑓𝐤𝐤𝛼𝛼0 ∂𝜀𝜀 ∇𝐫𝐫𝑧𝑧 , (S.16) in which ∂𝑓𝑓0 ∂𝜀𝜀 = − ∂𝑓𝑓0 ∂𝜀𝜀𝑓𝑓 , (S.17) and ∂𝑓𝑓0 ∂𝑇𝑇 = 𝜀𝜀𝑓𝑓−𝜀𝜀 𝑇𝑇 ∂𝑓𝑓0 ∂𝜀𝜀 . (S.18) are used. Then rearrange the linearized Boltzmann transport equation for electrons as
Δ𝑓𝑓𝐤𝐤𝛼𝛼 = −𝜏𝜏𝐤𝐤𝛼𝛼𝐯𝐯𝐤𝐤𝛼𝛼(−∇𝐫𝐫𝜀𝜀𝑓𝑓+𝜀𝜀𝑓𝑓𝑇𝑇−𝜀𝜀∇𝐫𝐫𝑧𝑧 + 𝑒𝑒∇𝐫𝐫𝜑𝜑)∂𝑓𝑓𝐤𝐤𝛼𝛼
0
∂𝜀𝜀 , (S.19)
where 𝜑𝜑 is the electrostatic potential. Plug equation (S.19) into equation (S.15), we will get 𝐉𝐉𝑞𝑞 = 𝑁𝑁1 𝑘𝑘Ω[∑𝛼𝛼,𝐤𝐤 (𝜀𝜀 − 𝜀𝜀𝑓𝑓)𝐯𝐯𝐤𝐤𝛼𝛼 ⋅ 𝐯𝐯𝐤𝐤𝛼𝛼𝜏𝜏𝐤𝐤𝛼𝛼 ∂𝑓𝑓𝐤𝐤𝛼𝛼0 ∂𝜀𝜀 ](−∇𝜑𝜑 + 1 𝑒𝑒∇𝜀𝜀𝑓𝑓) +𝑁𝑁1 𝑘𝑘Ω[∑𝛼𝛼,𝐤𝐤 (𝜀𝜀 − 𝜀𝜀𝑓𝑓) 2𝐯𝐯 𝐤𝐤𝛼𝛼 ⋅ 𝐯𝐯𝐤𝐤𝛼𝛼𝜏𝜏𝐤𝐤𝛼𝛼∂𝑓𝑓𝐤𝐤𝛼𝛼 0 ∂𝜀𝜀 ](−∇𝑧𝑧) = 𝐿𝐿21(−∇Φ) + 𝐿𝐿22(−∇𝑧𝑧) , (S.20)
Φ = 𝜑𝜑 − 𝜀𝜀𝑓𝑓/𝑒𝑒 is the electrochemical potential. When we calculate the Seebeck
coefficient, a similar expression of electric flux can be obtained as below 𝐉𝐉𝑒𝑒 = ∑𝛼𝛼,𝐤𝐤(−𝑒𝑒)𝐯𝐯𝑁𝑁𝑘𝑘Ω𝐤𝐤𝛼𝛼Δ𝑓𝑓𝐤𝐤𝛼𝛼 = −𝑁𝑁1 𝑘𝑘Ω(𝑒𝑒 2∑ 𝛼𝛼,𝐤𝐤 𝑣𝑣𝐤𝐤𝛼𝛼⋅ 𝐯𝐯𝐤𝐤𝛼𝛼𝜏𝜏𝐤𝐤𝛼𝛼∂𝑓𝑓𝐤𝐤𝛼𝛼 0 ∂𝜀𝜀 )(−∇𝜑𝜑 + 1 𝑒𝑒∇𝜀𝜀𝑓𝑓) +𝑁𝑁1 𝑘𝑘Ω[𝑒𝑒 ∑𝛼𝛼,𝐤𝐤 𝑣𝑣𝐤𝐤𝛼𝛼 ⋅ 𝐯𝐯𝐤𝐤𝛼𝛼𝜏𝜏𝐤𝐤𝛼𝛼 (𝜀𝜀−𝜀𝜀𝑓𝑓) 𝑇𝑇 ∂𝑓𝑓𝐤𝐤𝛼𝛼0 ∂𝜀𝜀 ](−∇𝑧𝑧) = 𝐿𝐿11�−∇𝜑𝜑 +1𝑒𝑒∇𝜀𝜀𝑓𝑓� + 𝐿𝐿12(−∇𝑧𝑧) , (S.21)
and the Seebeck coefficient is obtained as 𝑆𝑆 = 𝐿𝐿12/𝐿𝐿11 by setting the electric current
𝐉𝐉𝑒𝑒 to zero. In this way, we can use equation (S.21) to eliminate the electrochemical
potential term in equation (S.20) and obtain 𝐉𝐉𝑞𝑞 =𝐿𝐿𝐿𝐿2111𝐉𝐉𝑒𝑒+ (𝐿𝐿22−𝐿𝐿12𝐿𝐿11𝐿𝐿21)(−∇𝑧𝑧) , (S.22)
where Π = 𝐿𝐿21/𝐿𝐿11= 𝑧𝑧𝐿𝐿12/𝐿𝐿11 = 𝑧𝑧𝑆𝑆 is the Peltier coefficient and 𝜅𝜅𝑒𝑒 = 𝐿𝐿22− (𝐿𝐿12𝐿𝐿21)/ 𝐿𝐿11 is the electronic thermal conductivity. In our electron lifetime calculations, we use
Matthiessen’s rule20 and take electron scattering by equilibrium phonons, ionized
impurity scattering and alloy-electron scattering into account.
F. High-temperature Results
The κEPI/κnoEPI ratio (lattice thermal conductivity that takes EPI into account/lattice thermal conductivity without considering EPI) at 1100K is plotted in figure S5. Figure S6 shows three kinds of phonon scattering rates (intrinsic three-phonon scattering, alloy-phonon scattering and electron-alloy-phonon scattering) vs. alloy-phonon frequency for Si0.1Ge0.9 at this temperature.
FIG. S5. κEPI/κnoEPI ratio (lattice thermal conductivity that takes EPI into account/lattice thermal conductivity without considering EPI) at different carrier concentrations at 1100K.
We have only included three-phonon process in our lattice thermal conductivity
calculations. However, previous study on silicon21 has shown that at high temperature,
four-phonon scattering rate can be comparable to three-phonon scattering rate for high-frequency phonons, and the calculated lattice thermal conductivity that only considers intrinsic three-phonon scattering can reduced by 30% at 1000 K after including four-phonon scattering.
FIG. S6. Phonon scattering rates due to intrinsic phonon scattering, alloy-phonon scattering and electron-phonon scattering vs. phonon frequency, for Si0.1Ge0.9 at 1100K. G. Convergence Test
Our major concern in terms of convergence lies in the q-mesh density used in ShengBTE package for the lattice thermal conductivity calculations under relaxation time approximation. Figure S7 takes Si, Si0.3Ge0.7 and Ge as examples and shows our convergence test on the lattice thermal conductivity at low carrier concentrations (without considering electron-phonon interaction) at 300K and 150K. Figure S7 shows that for our calculated SiGe alloys’ lattice thermal conductivity, convergence is well guaranteed when the density of the mesh is denser than 60×60×60 for the values actually change very little across the entire range of the mesh density we have tested.
Figure S7: Calculated lattice thermal conductivity (without electron-phonon interaction) vs. sampling mesh density for Si, Si0.3Ge0.7 and Ge.
H. Estimate of effect in p-type SiGe alloys
A previous study on Si has reported a larger effect in p-type Si than in n-type Si.2 Depending on density of states, scattering phase space and electron-phonon coupling strength near Fermi level, effect of electron-phonon interaction on lattice thermal conductivity in p-type SiGe alloys can be slightly larger or smaller than in n-type SiGe alloys. In figure S8, we show calculated κEPI/κnoEPI ratio (lattice thermal conductivity that takes EPI into account/lattice thermal conductivity without considering EPI) at different
carrier concentrations for both n-type (hollow squares) and p-type (filled squares) SiGe alloys at 300K. Overall, the effect in p-type SiGe alloys is similar to the one in n-type SiGe alloys reported in the letter.
Figure S8: Calculated κEPI/κnoEPI ratio (lattice thermal conductivity that takes EPI into account/lattice thermal conductivity without considering EPI) at different carrier concentrations for both n-type (hollow squares) and p-type (filled squares) SiGe alloys. T = 300K.
REFERENCES
1 J.M. Ziman and P.W. Levy, Phys. Today 14, 64 (1961).
2 B. Liao, B. Qiu, J. Zhou, S. Huberman, K. Esfarjani, and G. Chen, Phys. Rev. Lett. 114, 115901 (2015).
3 J. Zhou, B. Liao, and G. Chen, Semicond. Sci. Technol. 31, 043001 (2016). 4 H.J. Monkhorst and J.D. Pack, Phys. Rev. B 13, 5188 (1976).
5 F. Giustino and A. Pasquarello, Phys. Rev. Lett. 96, 216403 (2006).
Commun. 178, 685 (2008).
7 P. Giannozzi, S. Baroni, N. Bonini, M. Calandra, R. Car, C. Cavazzoni, D. Ceresoli, G.L. Chiarotti, M. Cococcioni, I. Dabo, A.D. Corso, S. de Gironcoli, S. Fabris, G. Fratesi, R. Gebauer, U. Gerstmann, C. Gougoussis, A. Kokalj, M. Lazzeri, L. Martin-Samos, N. Marzari, F. Mauri, R. Mazzarello, S. Paolini, A. Pasquarello, L. Paulatto, C. Sbraccia, S. Scandolo, G. Sclauzero, A.P. Seitsonen, A. Smogunov, P. Umari, and R.M. Wentzcovitch, J. Phys. Condens. Matter 21, 395502 (2009).
8 S. Poncé, E.R. Margine, C. Verdi, and F. Giustino, Comput. Phys. Commun. 209, 116
(2016).
9 P. Lambin and J.P. Vigneron, Phys. Rev. B 29, 3430 (1984). 10 P.G. Klemens, Proc. Phys. Soc. Sect. A 68, 1113 (1955).
11 A. Kundu, N. Mingo, D.A. Broido, and D.A. Stewart, Phys. Rev. B 84, 125426 (2011). 12 S. Huberman, V. Chiloyan, R.A. Duncan, L. Zeng, R. Jia, A.A. Maznev, E.A. Fitzgerald, K.A. Nelson, and G. Chen, Phys. Rev. Mater. 1, 54601 (2017).
13 J. Garg, N. Bonini, B. Kozinsky, and N. Marzari, Phys. Rev. Lett. 106, 45901 (2011). 14 B. Abeles, Phys. Rev. 1046, (1963).
15 S. Tamura, Phys. Rev. B 27, 858 (1983).
16 G.P. Srivastava, The Physics of Phonons (CRC press, 1990). 17 S. Tamura, Phys. Rev. B 27, 858 (1983).
18 W. Li, J. Carrete, N.A. Katcho, and N. Mingo, Comput. Phys. Commun. 185, 1747 (2014). 19 G. Chen, Nanoscale Energy Transport and Conversion: A Parallel Treatment of Electrons,
Molecules, Phonons, and Photons (Oxford University Press, USA, 2005).
20 N.W. Ashcroft and N.D. Mermin, Solid State Physics (Holt, Rinehart and Winston, 1976). 21 T. Feng, L. Lindsay, and X. Ruan, Phys. Rev. B 96, 161201 (2017).