Drive-Access Transit: A Regional Analytical Framework by
James Barrett Sorensen
B.S., Civil Engineering
University of California - Davis, 2003
Submitted to the Department of Civil and Environmental Engineering in partial fulfillment of the requirements for the degree of
Master of Science in Transportation at the
Massachusetts Institute of Technology
June 2005
C 2005 Massachusetts Institute of Technology.
OF TECHNOLOGY
MAY
3
1
2005
,LIBRARIES
All rights reserved.'-7
Al,:~
Signature of Author
Certified by
Accepted by
Accepted by
Department of CKiI and Environmental Engineering
i L - I - May 6, 2005
Mikel Murga Research Associate Department of Civil and Environmental Engineering Thesis Supervisor
Nigel H. M. Wilson
Professor, Department of Jivil nd Ejvironmental Engineering Thesis Reader 'L4 V '4 F wvk^ Andrew Whittle Chairman, Departmental Committee on Graduate Students
Drive-Access Transit: A Regional Analytical Framework
JAMES BARRETT SORENSEN
B.S., Civil Engineering
University of California - Davis, 2003
Submitted to the Department of Civil and Environmental Engineering on May 6, 2005 in partial fulfillment of the requirements for the Degree of
Master of Science in Transportation ABSTRACT
A framework for analyzing drive-access transit at a regional level is developed in this research.
This framework is intended primarily for in-house use by regional transit agencies, yet has implications for the regional community at large. This framework serves as a tool for
understanding and communicating what drive-access transit is, its significance to the regional transportation system, and the behavior of regional drive-access transit users. This framework emphasizes the utilization of GIS technology for both the analysis and communication of information relating to drive-access transit. It also focuses scholarly attention on drive-access transit in general and on kiss-and-ride in particular.
The framework is applied to the Boston Metropolitan Region as a primary case study. Data from a variety of regional sources are utilized. GIS technology is used to visualize drive-access transit's regional significance in terms of total ridership, mode share, and drive-access transit facilities' utilization rates. A sub-mode choice model and a station choice model are developed for both rapid transit and commuter rail drive-access transit users. These models depend on the CTPS Emme/2 network model and the MIT Boston Regional TransCAD network model for the rapid transit and commuter rail models, respectively. The MIT Boston Regional TransCAD network model is intended to support on-going research, beyond the scope of this thesis, as part of the collaborative MBTA/MIT transit research effort.
As a result of the application of the analytical framework, key findings and specific recommendations related to drive-access transit are reported for the Boston Metropolitan Region. Key findings include:
" approximately 46 percent of the region's population lives beyond normal walking distance of transit services;
" drive-access transit accounts for 69 percent of overall commuter rail ridership and 18 percent of overall rapid transit ridership;
" drive-access transit accounts for 31 percent of rapid transit ridership in the 50 outermost rapid transit stations;
" the MBTA has a significant investment in station parking facilities, parking fees represent an increasingly important part of the MBTA's operating budget, and parking fees in the region evidence no spatial correlation;
hours prior to the departure of the last morning peak train;
" commuter rail station choice is dependent on access distance, parking capacities, and transit fares, with travelers willing to drive an extra mile if it results in savings of more than
$0.90 on their transit fare;
" rapid transit station choice is dependent on access distance, parking capacities, and transit trip distances, with travelers willing to drive an extra mile if it results in transit trip reduction of more than 3.3 miles;
0 sub-mode choice for both commuter rail and rapid transit users depends on access distance, automobile availability, and the number of vehicles owned per capita. Recommendations included:
" Making drive-access transit and particularly kiss-and-ride a regional transportation priority.
" Utilizing the developed models temporarily for modeling proposed services and policy implications until better data can be collected for a more complete model estimation process.
" Promote drive-access transit, especially kiss-and-ride and carpooling to parking stations, through targeting responsive demographic markets, and through incentives such as reduced transit fares, parking fees, or preferential parking treatment.
This research is an important initial step in assessing drive-access transit and its regional transportation role.
Thesis Supervisor: Mikel Murga
Title: Research Associate, Department of Civil and Environmental Engineering Thesis Reader: Nigel H. M. Wilson
ACKNOWLEDGEMENTS
This research could not have been completed without the sometimes tireless effort of many people, only a few of whom are listed below.
First, let me mention individuals at MIT who have made this research possible. Special thanks go to Mikel Murga whose tireless efforts and positive reinforcement made this research bearable. Mikel's intelligence, dedication and enthusiasm are examples to us all. Thanks go to Professor Nigel H.M. Wilson, my academic advisor for his good advice, strong recommendations, plain-spoken criticism and outstanding lectures. I would also like to thank all the faculty of the MST program, particularly John Attanucci, Fred Salvucci, Ken Kruckemeyer, Joseph Coughlin, Moshe Ben-Akiva, and Joe Sussman.
Ginny Siggia is deserving of huge thanks for all her help and assistance in navigating my way through the paperwork and bureaucracy of MIT. Thanks also go to Sara Goplin for her efforts on behalf of myself and my fellow Transportation Student Group members.
Let me thank the individuals at the MBTA and CTPS who have also assisted in this research, namely: Ian Harrington, Karl Quackenbush, and Heather Ostertog.
I want to express my appreciation to the following organizations that have helped fund the MIT
Transit Research Group, which in turn has helped finance my education. Thanks go to the Massachusetts Bay Transportation Authority, the Chicago Transit Agency, the United States Department of Transportation, the Council of University Transportation Centers and especially the Massachusetts Institute of Technology.
I want to express my appreciation for fellow students who helped guide and direct my research.
Special thanks to Jeff Busby and Julie Kirschbaum for their guidance and encouragement. Thanks also go to Zhan Guo, Heather Richardson and Jodie Misiak.
I would like to recognize a few of my classmates, without whom, not only would my education
have suffered, but MIT would have been a lot less fun. Thanks go to Laura Cham, Dalia Leven, and Mike Hanowsky (my real friends).
I would like to thank my parents Mark and Marie Sorensen for their support throughout my life. I
would also like to thank my sister Melissa Longo and my brothers Andrew, Jacob, Peter and Kyle Sorensen. The support of my family is at the root of any success I have ever attained. Finally, I would like to thank the most important (and beautiful) person in my life, my wife Amelia Anne Sorensen. I appreciate you and all of your many talents and gifts. Your many contributions and sacrifices are really what made this all possible.
TABLE OF CONTENTS
1. INTRODUCTION ... 13 1 .1 M o tiv a tio n ... 13 1 .2 O bje ctiv e s ... 16 1.3 R e se a rch M e tho d ... 17 1.4 T he sis S tructu re ... 172. LITERATURE AND BACKGROUND ... 19
2.1 Drive-Access Transit Benefits... 19
2.1.1 Park-and-R ide Benefits ... 19
2.1.2 Kiss-and-Ride Benefits...20
2.2 Drive-Access Transit Surveys and Demographics ... 21
2.2.1 Park-and-Ride Surveys and Demographics ... 21
2.2.2 Kiss-and-Ride Surveys and Demographics...23
2.2.3 Surveys and Demographics Summary ... 24
2.3 A nalytical Background ... 25
2.3.1 Geographic Information Systems and Network Representation ... 25
2.3.2 Drive-Access Transit Models...26
2.4 Literature and Background Summary...29
3. ANALYTICAL FRAMEWORK ... 31
3 .1 O ve ra ll F ra m ew o rk...3 1 3.2 Assessing Drive-Access Transit Significance... 33
3.3 Understanding Drive-Access Transit Behavior... 35
3.4 Drive-Access Transit Findings and Recommendations ... 40
3.5 Framework Summary...40
4. THE BOSTON CASE STUDY: DRIVE-ACCESS TRANSIT CHARACTERIZATION AND SIGNIFICANCE ... 41
4.1 C ase Study Background ... 41
4.2 Drive-Access Transit Significance... 45
4.2.1 Drive-Access Ridership and Mode Share...45
4.2.2 Drive-Access Facilities and Utilization ... 53
4.2.3 Drive-Access Monetary Impacts...62
5. THE BOSTON CASE STUDY: DRIVE-ACCESS TRANSIT BEHAVIOR . 69
5.1 C urrent M odeling Practices... 69
5.2 M odel B ackground ... 70
5 .3 C o m m ute r R a il...7 1 5.3.1 Drive-Access User Demographics...72
5.3.2 T rip C haracteristics ... 76
5.3.3 Station C hoice M odel... 81
5.3.4 Sub-M ode C hoice M odel... 83
5 .4 R a p id T ra n s it ... 8 6 5.4.1 Drive-Access User Demographics...86
5.4 .2 T rip C haracteristics ... 90
5.4.3 Station Choice Model Based on CTPS Emme/2 Data ... 95
5.4.4 Sub-Mode Choice Model Based on CTPS Emme/2 Data...96
5.4.5 Station Choice Model Based on MIT TransCAD Data ... 99
5.4.6 Sub-Mode Choice Model Based on MIT TransCAD Data...100
6. FINDINGS AND RECOMMENDATIONS ... 103
6 .1 F in d in g s ... 1 0 3 6 .1.1 C ase S tudy Findings ... 103
6 .1.2 Fram ew ork Findings...109
6 .2 R eco m m endatio ns ... 110
6.2.1 Policy R ecom m endations...110
6.2.2 Methodology Recommendations...111
6.3 Future R esearch D irections ... 112
APPENDIX A: BIBLIOGRAPHY ... 115
APPENDIX B: LIST OF ACRONYMS ... 119
APPENDIX C: BIOGEME MODEL FILES... 121
LIST OF FIGURES
Figure 3-1. A nalytical Fram ew ork... 32
Figure 3-2. Alternative Model Nest Structures... 39
Figure 4-1. Boston Metropolitan Study Region... 41
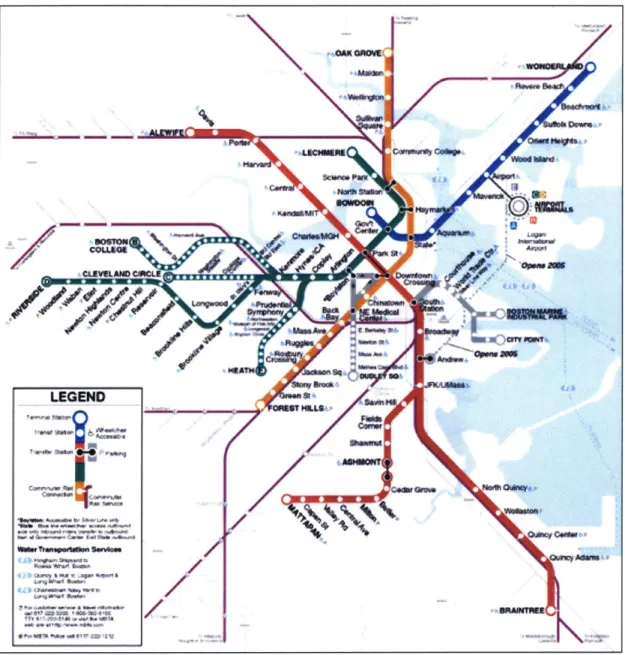
Figure 4-2. M BTA Rapid Transit Lines Map ... 42
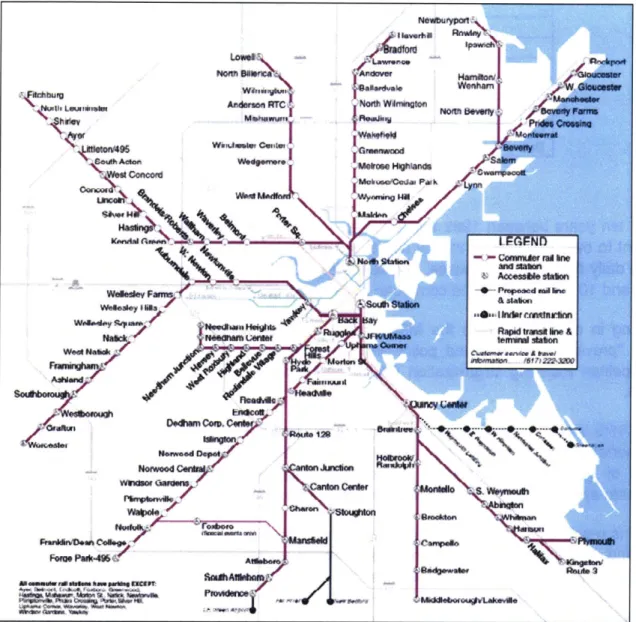
Figure 4-3. MBTA Com muter Rail Lines Map... 43
Figure 4-4. MBTA North Commuter Rail Stations Transit Access Mode Shares...47
Figure 4-5. MBTA West Commuter Rail Stations Transit Access Mode Shares ... 48
Figure 4-6. MBTA South Commuter Rail Stations Transit Access Mode Shares...49
Figure 4-7. MBTA North Rapid Transit Stations Transit Access Mode Shares ... 51
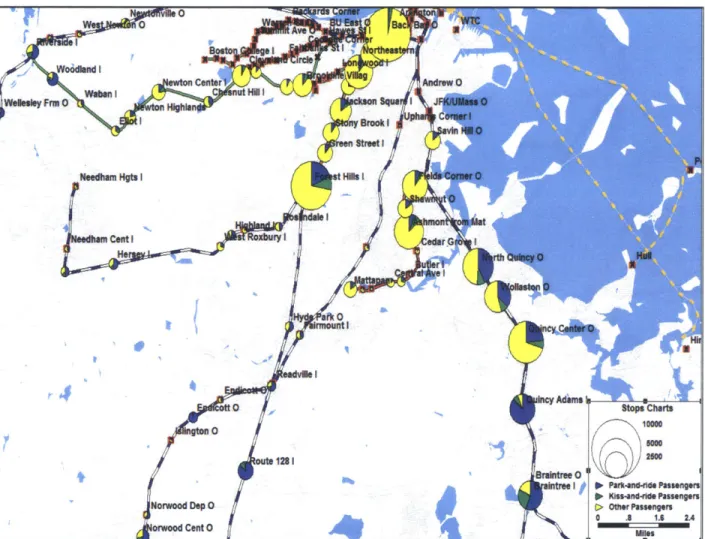
Figure 4-8. MBTA South Rapid Transit Stations Transit Access Mode Shares...52
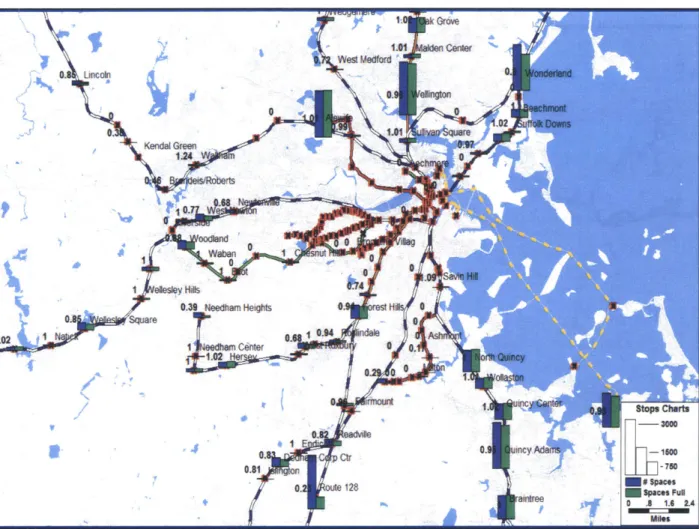
Figure 4-9. MBTA North Stations Parking Capacity and Usage ... 54
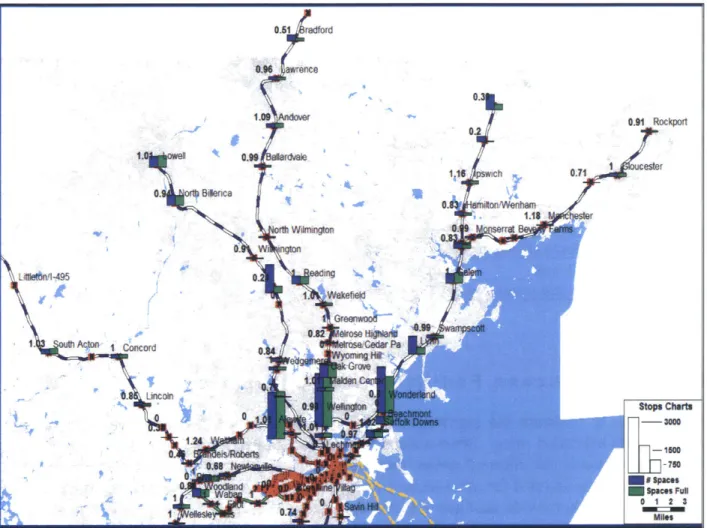
Figure 4-10. MBTA South Stations Parking Capacity and Usage ... 55
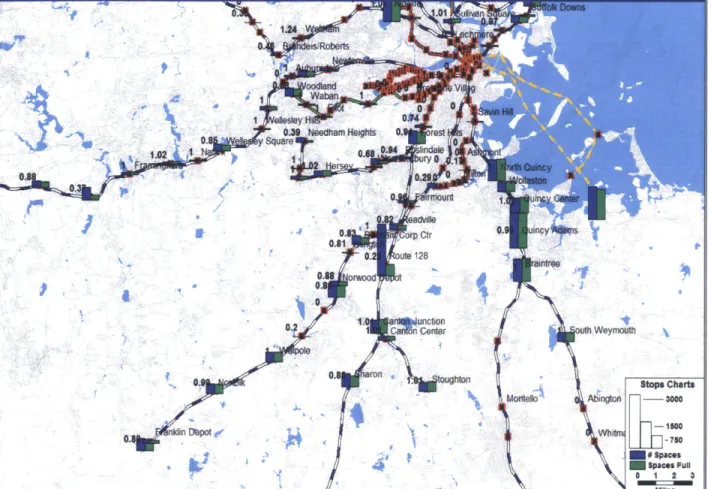
Figure 4-11. MBTA Rapid Transit Stations Parking Capacity and Usage ... 56
Figure 4-12. Drive-Access Transit Usage and Capacity for North Rapid Transit Stations...57
Figure 4-13. Drive-access Transit Usage and Capacity for South Rapid Transit Stations ... 58
Figure 4-14. Times that MBTA Commuter Rail Parking Reaches Capacity ... 59
Figure 4-15. Times that MBTA Rapid Transit Parking Reaches Capacity...60
Figure 4-16. Color Map of Times that MBTA Parking Reaches Capacity ... 61
Figure 4-17. Annual MBTA Revenue from Real Estate Operations, FY1 999 to FY2004*...62
Figure 4-18. MBTA North Commuter Rail Parking Fees...63
Figure 4-19. MBTA South Commuter Rail Parking Fees ... 64
Figure 4-20. MBTA Rapid Transit Parking Fees... 65
Figure 4-21. Parking Capacity Percent Filled Versus Parking Fees ... 66
Figure 5-1. Commuter Rail Park-and-ride Users by Age Group ... 73
Figure 5-2. Commuter Rail Kiss-and-ride Users by Age Group ... 73
Figure 5-4. Commuter Rail Kiss-and-ride Users by Income Level ... 75
Figure 5-5. Commuter Rail Drive-Access Trip Origins... 78
Figure 5-6. Commuter Rail Drive-Access Trip Destinations... 81
Figure 5-7. Rapid Transit Park-and-ride Users by Age Group ... 87
Figure 5-8. Rapid Transit Kiss-and-ride Users by Age Group...87
Figure 5-9. Rapid Transit Park-and-ride Users by Income Level...89
Figure 5-10. Rapid Transit Kiss-and-ride Users by Income Level...89
Figure 5-11. Rapid Transit Drive-Access Trip Origins ... 92
LIST OF TABLES
Table 2-1. Construction Costs of Parking ... 21
Table 3-1. Examples of Drive-Access Transit Behavioral Factors ... 36
Table 4-1. M BTA Daily Unlinked Ridership ... 44
Table 4-2. Summary Table of Drive-Access Mode Share...53
Table 5-1. Commuter Rail Park-and-ride Users by Gender...74
Table 5-2. Commuter Rail Kiss-and-ride Users by Gender...74
Table 5-3. Commuter Rail Station Choice By Time ... 79
Table 5-4. Commuter Rail Station Choice By Distance ... 79
Table 5-5. Commuter Rail Park-and-ride Station Choice By Time...79
Table 5-6. Commuter Rail Park-and-ride Station Choice By Distance... 79
Table 5-7. Commuter Rail Kiss-and-ride Station Choice By Time ... 80
Table 5-8. Commuter Rail Kiss-and-ride Station Choice By Distance ... 80
Table 5-9. Recommended Commuter Rail Station Choice Model... 83
Table 5-10. Recommended Commuter Rail Sub-Mode Choice Model ... 85
Table 5-11. Rapid Transit Park-and-ride Users by Gender...88
Table 5-12. Rapid Transit Kiss-and-ride Users by Gender ... 88
Table 5-13. Rapid Transit Station Choice By Time...93
Table 5-14. Rapid Transit Station Choice By Distance...93
Table 5-15. Rapid Transit Park-and-ride Station Choice By Time ... 93
Table 5-16. Rapid Transit Park-and-ride Station Choice By Distance ... 94
Table 5-17. Rapid Transit Kiss-and-ride Station Choice By Time...94
Table 5-18. Rapid Transit Kiss-and-ride Station Choice By Distance...94
Table 5-19. Recommended Rapid Transit Sub-Mode Choice Model Using Emme/2 Data...98
Table 5-20. Recommended Rapid Transit Station Choice Model Using TransCAD Data...100
Table 5-21. Recommended Rapid Transit Sub-Mode Choice Model Using TransCAD Data... 102
Table 6-2. Summary Comparison of Commuter Rail and Rapid Transit Survey ... 107
Table 6-3. Comparison of Commuter Rail and Rapid Transit Geo-coded Automobile Trip
C h a ra cte ristics ... 10 7
Table 6-4. Comparison of Estimated Behavioral Models...108 Table 6-5. Matrix of Model Variables...109
1.
INTRODUCTION
This thesis develops a process, or framework, for analyzing drive-access transit at a regional level. This exploratory research is intended as a potential tool to help transit agencies and other regional transportation stake-holders better understand drive-access transit, its regional significance, and its regional user behavior. Once developed, this framework is then applied to the Boston Metropolitan Region as a primary case study. Drive-access transit's significance is assessed using a variety of methods. GIS technology is used to convey information in its geographical context. Models and tools are developed to describe drive-access transit behavior in the region. Conclusions and recommendations specific to the region are suggested.
1.1 MOTIVATION
A problem facing many regions in the United States is how to increase transit accessibility in a
fiscally constrained climate. In an ideal situation with no monetary limitations, transit services would be universally distributed and everyone would have quick, safe, and convenient transit access. However, in the real world, regions are often faced with difficult decisions regarding transit accessibility. In areas with populations dense enough to support the economical provision of a dense transit network, people are often able to walk to nearby transit services and thereby easily access the system. However, as areas grow less dense and transit services become less cost-effective to operate, walking to transit often becomes a difficult proposition. Several accessibility alternatives to walk-access transit exist. These alternatives include encouraging bicycle access to stations and/or providing bus feeder services. However, in automobile-dependent areas or areas prone to inclement weather, the number of riders willing to use a bicycle to access transit is likely to remain small. Providing bus feeder service may also be difficult due to the additional cost involved. There must also be sufficient concentration of demand, in terms of minimum residential density, along the bus feeder route to make it a viable alternative. Finally, riders may not choose to use the bus feeder service due to both the additional transfer involved and the negative perceptions of bus reliability and service quality. Another alternative to walk-access transit is drive-access transit. Many individuals, both within the transit industry and without, are unfamiliar with what exactly is meant by drive-access transit. Therefore, a specific and clear definition of drive-access transit is essential to its proper analysis. Unfortunately, a clear definition of drive-access transit is rarely directly stated in the literature. There are, however, a wide range of implicit definitions. There is variation concerning whether or not drive-access transit refers only to individuals who drive to and park at transit stations or also includes people driven to and dropped off at transit stations. There is variation concerning whether or not drive-access transit is considered a mode of travel by itself or is rather a sub-mode of transit. There is variation concerning which transit vehicle types drive-access transit refers to. It is apparent that drive-drive-access transit is concerned with commuter rail, but less apparent is whether or not drive-access transit also includes automobile access to rapid transit, light rail, buses, ferries, etc. In fact, there appear to be as many variations in the
definition of drive-access transit as there are variations in the way park-and-ride is spelled. (Spelling variations include: park-and-ride, Park & Ride, park n' ride, Park and Ride, etc.)
Much of this variation in defining drive-access transit may be explained by the variation between regional transit systems. For example, a high-income region with high levels of automobile dependence and an abundance of free, available parking might experience little or no kiss-and-ride usage. In such a case, the time and effort of identifying and analyzing such a small percentage of the total transit ridership would not be cost-effective. Still other regions might not use certain transit vehicle types. Therefore, regional differences might account for this varying perception of drive-access transit.
In this research, drive-access transit is defined to be any transit access mode where an automobile is used to access a transit station. This primarily refers to transit riders who choose to drive to a station, park their automobile, and access the transit station (park-and-ride); and transit riders that are driven to a station, dropped-off, and then access the transit station (kiss-and-ride). It is considered a viable access mode for all transit vehicle types, including: commuter rail, rapid transit, buses, and ferries.
Drive-access transit is vitally important to regional transportation systems for several reasons. First, drive-access transit is important to transit agencies since it represents choice riders; individuals who, by definition, have access to a car, yet who choose to use transit for (at least) a portion of their trip. In order for transit agencies to be able to fulfill their mandate of providing mobility to a regional population in a cost-effective manner, they must be able to attract choice riders. A better understanding of drive-access transit on a regional level will allow transit agencies to make investments and set policies that best take advantage of opportunities and behaviors specific to their region.
Furthermore, drive-access transit represents an opportunity for long-term ridership growth. As travelers become more familiar with transit facilities, they may be more likely to utilize transit for a greater percentage of their daily trips. As ridership grows over the long-term, this represents additional revenue and political support for the transit agency.
Drive-access transit also helps support transit access in low-density areas, where transit service tends to be less economic, by consolidating transit demand. Transit agencies operate in a fiscally constrained climate. As providing a public good, they must compete with other public
goods and services for public attention and funding. By consolidating demand, transit agencies are able to provide more service in a cost-effective manner. This allows them to demonstrate proper and responsible stewardship over the public money they have received and make a stronger case for receiving additional future funds.
Related to proper financial stewardship is the fact that transit agencies have invested a considerable amount of money in drive-access transit-related facilities. Parking lots and parking garages, parking management systems, drop off carousels, parking enforcement, security systems, etc. all represent a significant investment on the part of transit agencies. Also, if parking fees are assessed at these transit stations, drive-access transit might represent a source of considerable additional revenue for the transit agency. By focusing attention on scholarly drive-access transit research, agencies ensure that they might receive a proper return
Introduction on their investment. Transit agencies are also better capable of deciding whether or not future
investment in such facilities is warranted and/or desirable.
Additionally, as transit agencies better understand drive-access transit users and their behavior, they will be better equipped to meet their mobility needs. They will be able to more effectively target specific services and programs. Agencies will also be better able to predict demand for future or alternative transit services.
Drive-access transit is not only of importance to the transit agency, but is of importance to the regional community at large. To start, since transit agencies are funded in large part by tax dollars, the public has the right to monitor transit agency policies and investments. Therefore, for the same financial reasons mentioned above, the general public also has an interest in seeing drive-access transit perform effectively.
Next, drive-access transit has significant impact on local communities. In highly automobile-dependent communities, drive-access transit might be the only alternative to automobile travel. Another impact is that if parking capacity at transit stations is insufficient to meet drive-access transit demand, the excess vehicles may overflow into surrounding neighborhoods. Also, large drive-access transit facilities might decrease congestion on the overall network, but might increase local congestion in the area immediately surrounding the station. Clearly, understanding drive-access transit is of importance to both regional transit agencies and local communities.
Furthermore, there are several current trends that will make drive-access transit even more important in the future. For example, continued urban sprawl in the United States will only contribute to drive-access transit's significance. Many transit stations, especially those stations located on the outer urban edge or in suburban areas, are strongly dependent on automobiles for station access. Due to both urban form and urban sprawl, potential transit riders in these areas find accessing the station by foot or by bus to be extremely time-consuming, inconvenient, and even dangerous. Cities prone to inclement weather also are more likely to see potential passengers prefer to utilize automobiles to access transit. As the urban form continues to become less dense, drive-access transit can serve the increasingly important role of consolidating demand and allow increased access in automobile-dependent areas.
Another trend that will increase drive-access transit's importance is the rising costs of providing parking infrastructure. As it becomes increasingly expensive to build and maintain parking infrastructure, information to support proper decision-making becomes increasingly important. Properly modeling drive-access transit behavior will allow for more accurate predictions of ridership demand and demand for parking facilities. This in turn can be used in the planning and pricing of transportation services. This information should assist decision-makers in making choices that are both socially responsible and economically sound.
Increased road congestion will also contribute to drive-access transit's future importance. As congestion increases, utilizing transit for at least a portion of their trip will become more attractive to automobile users. Lack of available parking and/or high parking costs at trip destinations, specifically in central business districts, will also increase the attractiveness of drive-access transit. Care will need to be taken to ensure that sufficient capacity exists to meet
this increase in drive-access transit usage and that this increased usage will not create significant negative ramifications for the surrounding community.
One current trend that is of considerable concern is the relatively little scholarly attention that has been focused on drive-access transit, particularly in regard to kiss-and-ride. The apparent academic neglect of drive-access transit in general, and kiss-and-ride specifically, is surprising. For so important a topic to receive so little attention is disconcerting and should be remedied. Technology exists and is readily available, especially Geographic Information Systems (GIS) technology, to perform detailed analysis of both demographic and spatial information. In addition, this technology is capable of visualizing and presenting this information in a manner useful to transit agency personnel and the general public.
Consistent with this lack of academic attention is the scarcity of information available concerning drive-access transit. For example, information concerning drive-access transit is not included in the National Transit Database (NTD, 2005), nor in the American Public Transportation Factbook
(APTA, 2004). This scarcity of information and data further compounds the difficulty in exploring
and examining drive-access transit at the regional level.
Another difficulty in examining drive-access transit is the need for specific tools and models capable of assessing access transit's regional significance and explaining regional drive-access transit behavior. There are essentially two traveler decisions of key importance to understanding drive-access transit behavior. The first decision involves station choice. What factors influence an individual's decision to drive to a station further away from his/her origin? The second decision is what mode of drive-access transit does an individual select. In other words, how does a traveler choose between park-and-ride and kiss-and-ride? In real life, these choices are often made simultaneously. However, in modeling these decisions, developing a decision-making hierarchy is necessary. As a result of this abstraction and the afore-mentioned scarcity of data, developing useful models is fraught with difficulties.
This research is designed to be exploratory in nature. More than anything else, it develops an analytical framework as a way of looking at drive-access transit. It then applies this framework to a real-world case study in an attempt to identify the many difficulties and limitations endemic to such an analysis. The case study analyzes the available information, develops several models specific to drive access transit, makes preliminary conclusions based on this limited data, and makes recommendations about how to obtain better information and apply it in the future. In addition, it serves as an example of the many difficulties inherent to such an analysis, allowing future analysts the ability to streamline this process to better suit their regional needs.
1.2 OBJECTIVES
This research, although exploratory, is meant to help focus academic attention on drive-access transit, especially the kiss-and-ride access mode. The objectives of this research, therefore, are to:
" Develop a framework for analyzing drive-access transit at a regional level.
Introduction
" Utilize Geographic Information System (GIS) technology to facilitate analysis and communication of drive-access transit research.
" Develop sub-mode choice and station choice models as tools for understanding drive-access transit behavior in the Boston Metropolitan Region.
" Provide recommendations and possible future directions regarding drive-access transit
policies, practices, and planning.
1.3 RESEARCH METHOD
This thesis seeks to develop a framework to analyze drive-access transit on a regional level. This framework will serve as a tool for conducting regional analyses and presenting the results of these analyses to inform transit agency decision-makers as well as the general public.
The transportation literature is explored to document prior findings on behavior and the potential benefits of drive-access transit. Demographic information and past surveys are also referenced.
A critique of GIS technology and transit network models is summarized. Previous definitions
and mathematical models of drive-access transit behavior are consulted.
A regional analytical framework is then developed that answers fundamental qbestions
regarding drive-access transit. Care is taken to ensure that the framework is both easy to interpret and easy to communicate to a variety of audiences. An emphasis is placed on regional adaptation of the framework.
The regional analytical framework is then applied to the Boston Metropolitan Region as a primary case study. The background of the region and information on the relevant transportation agencies are presented. GIS technology is utilized to facilitate analysis of various drive-access transit related data sets. This geographic representation of the data allows for the recognition of spatial patterns and relationships, or sometimes more importantly, the absence of spatial patterns and relationships. A regional transportation network model recently developed as part of a collaborative effort of the MIT Transit Research Group is used to gain consistent and accurate trip component information. Using multinomial logit estimation, a sub-mode choice model and a station choice model are developed for both commuter rail and rapid transit travelers.
Finally, key findings, conclusions, and recommendations specific to the study region are reported. Limitations of the framework and its real-world application are discussed.
1.4
THESIS STRUCTUREThis thesis has six chapters including this first introductory chapter.
Chapter 2 reviews prior literature and background information relevant to this thesis. Studies and reports documenting drive-access transit benefits, demographics and surveys are
summarized. GIS technology and transit network models are also discussed. Previous
attempts at modeling drive-access transit behavior are documented.
The regional analytical framework for drive-access transit research is developed in Chapter 3. Guidelines are presented and emphasis is placed on regional adaptation.
The analytical framework developed in Chapter 3 is then applied to the primary case study in Chapter 4. The background of the Boston Metropolitan Region is presented. The collection, management, coordination, and implementation of various data represented considerable effort on the part of the researcher. Regional drive-access transit significance is assessed by
presenting this data in its geographical context using GIS technology.
Chapter 5 documents the development of tools to better analyze the region's drive-access transit behavior. The development of a regional transportation network model, a collaborative effort of the MIT Transit Research Group, is presented as part of on-going research outside the scope of this thesis. The development of models to explain regional drive-access transit behavior is also presented.
Research conclusions are presented and discussed in Chapter 6. General recommendations as well as recommendations specific to the case study region are offered, including possible additional applications of this research. Opportunities for further related research directions are proposed.
2.
LITERATURE AND BACKGROUND
This chapter describes the mechanics and benefits of drive-access transit's two modes: park-and-ride and kiss-park-and-ride. The demographics of drive-access transit users are also described. Previous studies concerning geographic information systems, transit network representations, and information visualization are reviewed. Prior work on mode choice and station choice
models is summarized. Park-and-ride and kiss-and-ride marketing studies are analyzed.
2.1 DRIVE-ACCESS TRANSIT BENEFITS
Drive-access transit is typically separated into two access modes, namely park-and-ride and kiss-and-ride. The benefits of these modes are considered separately in Sections 2.1.1 and 2.1.2 below.
2.1.1 Park-and-Ride Benefits
The literature includes several studies that examine the benefits of park-and-ride service. The results of these studies have sometimes been conflicting. For example, some studies conclude that park-and-ride strategies reduce overall traffic congestion, while others claim park-and-ride might actually increase congestion by creating traffic bottlenecks as drivers access stations further upstream. As a result of such conflicting claims, there is still some debate as to what the aims of park-and-ride should be, how it should be implemented, and what benefits result from
park-and-ride.
Parkhurst (1996) asserts that park-and-ride "can have one or more differing aims, namely:
" To maintain or increase the number of economically-desirable trips to the city centre,
" To avoid using valuable city centre land for car parks and access roads
" To reduce congestion, noise and pollution." (Parkhurst 1996)
However, Parkhurst (1996) further asserts that from his study of short-range park-and-ride schemes in nine United Kingdom cities, the actual benefits accruing from implementation of park-and-ride are mostly economic. Specifically, Parkhurst cites these cities' ability to retain a relatively smaller supply of parking spaces in their economically valuable central business districts and higher vehicle occupancy rates allowing more trips to the city center without the expected levels of accompanying traffic congestion as the key demonstrable benefits of park-and-ride. Parkhurst could find no correlation between park-and-ride implementation and reductions in overall traffic congestion or pollution. Instead, Parkhurst found "new traffic emerging to fill vacated capacity" (Parkhurst, 1996). This study would suggest that park-and-ride policies, while not reducing total congestion and pollution, may provide additional accessibility and significant economic benefits, without the same levels of accompanying congestion and pollution that one would expect in the absence of park-and-ride.
In contrast, Wang et al (2004) summarized several studies conducted in North America and the United Kingdom that concluded that park-and-ride facilities were in fact effective in reducing traffic congestion. This study also cited a parking demand study conducted in Hong Kong that showed promising results in using park-and-ride facilities to help manage travel demand.
What can be agreed is that park-and-ride helps support transit access in lower-density areas by consolidating transit demand. Additionally, drive-access transit is of vital importance to transit agencies as a source of potential long-term ridership growth, given current suburban development patterns. With most transit systems operating as radial networks, park-and-ride strategies maintain the viability of the region's downtown central business districts (CBD) by concentrating demand and allowing more individuals the opportunity to access the CBD by transit. Drive-access transit users represent choice riders: individuals with access to an automobile who choose to use transit for at least a portion of their trip. Attracting these choice
riders may allow transit agencies to increase ridership, revenue, and most importantly perhaps, regional public and political support.
2.1.2 Kiss-and-Ride Benefits
Kiss-and-ride service offers many of the same benefits as park-and-ride services, along with the added bonus of not requiring investment in parking infrastructure at transit stations.
As transit ridership increases, many areas face severe parking shortages at, and around, transit stations. In these cases parking can often overflow into surrounding neighborhoods. Also, as more drivers vie for a limited number of available parking spaces, traffic congestion around these transit stations increases. Parking fees and resident parking restrictions can help manage this demand, but also run the risk of driving potential riders to choose a non-transit alternative (no pun intended).
Additionally, the cost of supplying parking infrastructure is continually increasing. Parking spaces are expensive to build and maintain. The cost of a suburban parking space in a structure has been estimated at up to $23,600, excluding maintenance costs (Shoup, 1997). One can assume that the cost for parking spaces in urban areas, where available space is at a premium, would be even greater. A range of parking construction cost estimates generated by the Institute of Transportation Engineers is shown in Table 2-1. It is important to note that these estimates are likely significantly lower than the actual cost of constructing parking spaces in the dense
Literature and Background
Table 2-1. Construction Costs of Parking
Range Surface Above-ground Subsurface Structured
Structured
Lower Limit $1,000 $8,000 $20,000
Upper Limit $3,000 $15,000 $35,000
Source: ITE Parking Generation (McCourt, 2004).
Given the financial constraints that most transit agencies are continually facing, the
capital-intensive strategy of continually building and maintaining additional parking infrastructure at
transit stations is difficult at best. Of course this depends on specific transit agency revenues and the relative cost of drive-access transit alternatives.
Kiss-and-ride is a strategy that allows transit modes to increase their ridership and market share without the expense of supplying additional parking spaces. Instead of having to park, the transit rider is driven to the station by another person, dropped off, and then picked up on the return trip.
In addition, kiss-and-ride allows travelers to avoid the need for second or third cars per household. By allowing travelers in the same household to travel together, fewer automobiles
per household are necessary. This could result in fewer automobiles on the road and positively affect regional vehicle-hours and vehicle-miles traveled. Reduced automobile ownership can also help create a more transit-oriented populace and a less automobile dependent urban form. Unfortunately the kiss-and-ride strategy is rarely considered in the literature. No studies or
reports were found that deal specifically with the benefits of kiss-and-ride access. It is
regrettable that more research into the viability and benefits of kiss-and-ride access has not been performed. Hopefully this research will assist in correcting this omission in the research literature.
2.2 DRIVE-ACCESS
TRANSIT SURVEYS AND DEMOGRAPHICSMany factors may play an important role in the behavior and decision-making processes of drive-access transit users and this section reviews available surveys and demographic studies
conducted on drive-access transit users.
2.2.1 Park-and-Ride Surveys and Demographics
The Transit Capacity and Quality of Service Manual (2003) summarized the results of a number of park-and-ride user surveys in Sacramento, Northern Virginia, Chicago, Seattle and Phoenix.
" Park-and-ride users are choice users,
" Park-and-ride users have significantly higher incomes than local bus riders,
" The majority of park-and-ride users are commuters to the area's central business district (CBD),
" Parking at the users' ultimate destination is expensive,
" Most users originally discovered park-and-ride facilities because they could see them from their regular commute routes.
The Manual also stated that the most successful park-and-ride lots focused on making automobile access as convenient and quick as possible. The Manual further suggested that the transit portion of the patron's trip should, in most cases, "represent more than 50% of the total journey time from the patron's home to final destination" (Transit Capacity and Quality of
Service Manual, 2003).
The Chicago Transit Authority (CTA) has invested in detailed marketing surveys of its park-and-ride facility users. These surveys help throw light on the demographics and behavior of typical drive-access transit users.
In September and October of 1993, the CTA conducted surveys at its Cumberland park-and-ride facility. According to these surveys the two primary reasons users indicated for selecting drive-access transit was "expensive parking at destination" and "faster than driving all the way". Approximately 68% of the parking facility users were traveling to work, and 63% indicated that they were regular commuters. 89% of the survey respondents drove alone to the station, 9% were in two-occupant vehicles, and 2% were in vehicles with 3 or more persons. The average drive time to the station was determined to be 16.5 minutes. (CTA O'Hare, 1994)
In late 1998, a customer satisfaction survey was conducted at all of the CTA's park-and-ride facilities. These surveys indicated that the primary reasons why parking facility users use park-and-ride are because it is the fastest way to make their trip, they dislike driving, expensive parking costs at their trip destination, and they dislike expressways. These surveys also concluded that the typical park-and-ride facility user was likely to be female, between the ages of 35 and 50, from households with 2-4 persons, two or more cars, and with incomes of $50,000 or more. These surveys also indicated that while most users lived within 10 miles of the parking facility, some traveled 50 miles or more. (CTA Blue Line, 1998) (CTA Red, Yellow..., 1998)
(CTA Summary, 1998)
Hendricks and Outwater (1998) conducted a study in King County, Washington and found that only 5 percent of the trips reported were non-work trips. Additionally, their surveys indicated that parking facility capacity affected both mode choice and station choice decisions. Finally, they found that parking costs, both at the trip destination and at the drive-access transit station significantly affected drive-access behavior.
Johnson and Resnick (2000), conducted a survey at commuter rail facilities focusing on how parking availability might affect traveler's mode choice. Their results indicated that 58 percent of the survey respondents indicated that if the parking lot at their intended station was full, they
Literature and Background would simply park further from the station. Another 24 percent indicated that they would drive to another station, while 18 percent of the respondents stated that they would merely drive the entire distance to their final destination. These results indicate that parking availability had no effect on mode or station choice for more than half of the survey respondents. These findings cast doubt on the effectiveness of utilizing Intelligent Transportation Systems (ITS) technology to provide drivers with real-time parking information. However, the usefulness of these findings is limited by the lack of information given about the areas surrounding these stations. In other words, these findings might be related to the relative cost and availability of parking in the neighborhoods surrounding the commuter rail station. These findings are also limited by their focus only on current transit users; non-users may behave differently.
Additionally, anecdotal evidence suggests that both the mode choice and station choice decisions are affected by several difficult-to-quantify factors. For example, weather may influence station choice as travelers travel further distances to park at stations with covered parking lots. Trip-chaining may also influence mode choice and station choice as travelers must first run various errands either prior to accessing the transit station or following their egress on the return trip. Time of departure may influence drive-access transit behavior as parking availability might be limited later in the day. Time of return may also influence behavior as some stations may be less attractive or perceived as being less safe after dark. The vehicle being driven may also influence behavior, as those with more expensive vehicles may choose to be dropped off or may choose to drive further to a station perceived to have more secure parking.
2.2.2 Kiss-and-Ride Surveys and Demographics
Consistent with the little research conducted on kiss-and-ride, there is little information available regarding the demographics of kiss-and-ride users.
Schank (2002) examined the demographics of kiss-and-ride patrons as part of a New York City commuter rail network case study. Commuter rail stations with very different kiss-and-ride characteristics were studied to determine what role, if any, station design, parking problems, and station area demographics played in encouraging kiss-and-ride access. Schank determined that although the direction of causality was uncertain, station factors such as short-term parking availability, adequate curb space, parking enforcement, and separate kiss-and-ride and park-and-ride areas might all contribute to encouraging kiss-and-ride access. Schank's demographic analysis indicated that factors such as income were not significant in determining the success of kiss-and-ride at nearby stations. The only demographic factor found to be significant was the percentage of females in the population.
As in park-and-ride, anecdotal evidence indicates that kiss-and-ride is also strongly affected by difficult to quantify factors. In addition to the factors listed above, kiss-and-ride also must be concerned about the trip made by whoever dropped off the kiss-and-ride passenger. It is often assumed that this person is most likely a member of the same household as the kiss-and-ride user and that his/her trip is merely to the station and back home again. However, this assumption has never been substantiated in the literature. It is certainly plausible that a large portion of kiss-and-ride passengers may be dropped off by someone on his/her way to a destination outside the home. In this case, the secondary destination would obviously have a
major impact on station choice. These activity-based decisions could present the greatest analytical difficulty, since relatively few transportation agencies have activity-based survey information or models.
2.2.3 Surveys and Demographics Summary
In summary, the literature suggests several factors that may be correlated with drive-access transit usage. These factors can be classified into four main types: demographics, trip and station characteristics, and other factors.
Demographic factors that may influence drive-access transit behavior include:
" gender,
" income,
" automobile ownership,
" household size, and
0 age.
Trip characteristics that influence drive-access transit behavior may include among other things:
" times and costs associated with both the automobile and transit portions of the trip,
" trip purpose,
" time of departure, and
" the time of the return trip.
Station characteristics that influence drive-access transit behavior may include:
" station parking capacity,
" station parking costs,
" whether or not the station parking is covered or not,
" lighting around the station, and
" the overall perceived station security.
Finally, other factors that influence drive-access transit behavior may include:
" weather,
" trip-chaining,
" network characteristics, and
Literature and Background
2.3
ANALYTICAL BACKGROUNDThis section provides the analytical background for this research. It reviews both geographic information systems and network representation background material. This section also discusses previous attempts to model drive-access transit behavior.
2.3.1 Geographic Information Systems and Network
Representation
A Geographic Information System (GIS) is "a class of software tools dedicated to the storage
and display of spatially referenced information" (Grayson, 1993). GIS technology is used to process and visualize spatial and demographic data, for example transportation networks. Central to GIS technology are relational database systems which process and manage the data. Relational databases organize data in tables and permit a user to generate new tables or queries based on a query language. In addition to processing this data, the visualization of this data allows for superior spatial analysis and better communication of research results. In particular, this visualization of data allows one to recognize and analyze spatial patterns that are not otherwise obvious.
GIS allows for spatial queries, which has tremendous benefits when analyzing choice behavior.
Rather than being forced to rely on individual perceptions of travel times, distances, and costs, much of this information can be obtained through these spatial queries. Also, analyzing the spatial aspects of demographic information is greatly facilitated.
GIS technology has proven attractive to transit agencies for many reasons. "The ability to
manage large amounts of spatial data holds obvious appeal to transit agency staff ranging from planners who are interested in the spatial distribution of jobs and population to signage crews who maintain thousands of individual bus-stop signs" (Busby, 2004). As a result, most transit agencies have implemented GIS technology of one form or another. However, the effectiveness of this GIS utilization has sometimes been called into question. For example, Grayson (1993) cites Clarke who laments the failure of GIS to expand analytic capabilities, claiming GIS is focused on "technological issues relating to data storage, retrieval, and display" arguing that
GIS needs to move "from being an end in itself to becoming an enabling device within a broader
decision making environment. This will involve practitioners developing a much broader knowledge of the problems and processes that decision makers are involved in, as well as the incorporation of more powerful, value adding, analytical techniques." (Clarke, 1990). Although Clarke's remarks are nearly fifteen years old, one could argue that his criticism remains valid today.
One of the objectives of this thesis is to utilize GIS technology to facilitate both the analysis of drive-access transit behavior and the communication of the analysis' results. There are several existing software packages that merge representations of transit and road networks with GIS databases. TransCAD, one of the software packages used for analysis in this thesis, was the first such integrated package and uses the trademark "Transportation GIS Software" to describe itself (Caliper, 2002). Competing transportation demand models such as Emme/2, which was
used for a portion of this thesis' analysis, and Cube have established similar relationships with
GIS packages, specifically ENIF and Arc-View, respectively.
The use of GIS technology for these analytical and communicative purposes helps refute Clarke's criticism that GIS utilization is too focused on data storage and retrieval. Additionally, it should make the results of this research more accessible to all interested parties and stakeholders.
2.3.2 Drive-Access Transit Models
Modeling drive-access transit is inherently difficult. First, one must specify a mode choice model that accurately represents the variables that influence a traveler's choice of drive-access transit versus other modes. The definition of what constitutes a mode varies. Many agencies classify park-and-ride and kiss-and-ride as separate modes or as sub-modes of transit (Hull,
1998), while other agencies lump them together as drive-access transit (Harrington, 2003). Still
other agencies further classify park-and-ride into sub-modes of drive alone park-and-ride and carpool park-and-ride (CTA Blue Line, 1999). Also, the price of parking at the trip destination is a significant factor in the decision to use drive-access transit yet many models do not have reliable parking cost information available (Busby, 2004). Parking availability is extremely difficult to model effectively due to its dependency on station capacity, time of day, and station attractiveness. All of these attributes vary across stations and thus affect the choice of station and the choice of mode. Additionally, modeling drive-access to transit is further complicated by its asymmetry - a vehicle is available on the access end of a transit trip but not on the egress end (Busby, 2004). Furthermore, many models can lead to the unrealistic behavior of driving most of the distance from the origin, parking, and taking a short transit trip to the destination (Busby, 2004). The literature describes several different methods to overcome these modeling difficulties.
In a very early study, Boyce (1973) considered several models for determining station choice among suburban park-and-ride stations. One model consisted of creating hyperbolic shaped market areas, or catchment areas, based on the following deterministic station choice equation:
DA -DB = K (2-1)
where DA and DB are the straight line distances to stations A and B from a point on the market area boundary and K is the ratio of the difference in the fixed cost of using station A and B to the cost per mile of accessing either station. Boyce used a variety of variables to estimate both the fixed cost and the cost per mile of accessing each station, but concluded that the best deterministic model of station choice could explain only about 60% of observed behavior. Boyce found that the simple deterministic models, i.e. assigning all travelers to the nearest station, performed as well as more elaborate deterministic models. Boyce next developed a probabilistic model using a probit model form. This model allowed travelers to choose between the two closest stations based on cost differentials. This probabilistic model performed marginally better than the deterministic model, but was still simplistic in its choice behavior modeling assumptions.
Literature and Background The Transit Capacity and Quality of Service Manual (2003) indicates that, traditionally, demand for drive-access has been based on the demographics of a fixed and defined market area. These market areas for park-and-ride services often reflect parabolic, circular, or semi-circular catchment areas. This methodology is simplistic and fails to capture much of the complexity of drive-access transit users' mode and station choice behavior.
Kastrenakes (1988) used a multinomial logit model to develop a station choice model for NJ (New Jersey) Transit's commuter rail stations. This model sought to allow the agency to forecast rail ridership at specific stations, thereby allowing NJ Transit to fine-tune its park-and-ride program and make strategic decisions regarding possible future service improvements, including the provision of new services on existing rail lines, the creation of new rail lines, the creation of new stations on existing rail lines, and the extension of existing commuter rail lines. While not specifically dealing with drive-access transit, this mode was included in the overall station ridership. This model's parameters consisted of access time to the station, a dummy variable indicating whether or not the station was located in the same community as the trip origin, the frequency of service at the station, and a generalized cost that included transit fare and a value of in-vehicle travel time based on the average hourly wage rate. The results of this model concluded that access time and frequency of service had the strongest influence on station choice. This model suffered from several limitations, including the neglect of station characteristics such as parking capacity and cost and the neglect of all demographic factors. Fan et al (1993) analyzed station catchment areas and adopted a nested logit approach for estimating mode choice and station choice behavior in the Toronto (Ontario) region. Their analysis indicated that for commuter rail travelers, 98.8 percent of the observed trip makers used either the closest or second closest access station. For subway travelers, 98 percent of observed trip makers chose one of the five closest access stations. They estimated two nested models, one with the station choice as the upper-level decision and access mode as the lower-level decision and the other model with the inverse nest structure. Their results suggested that the more appropriate model structure was with access mode as the upper-level decision and station choice the lower-level decision. The model parameters for the station choice decision included transit in-vehicle travel time, transit out-of-vehicle time, transit fare, service frequency, automobile travel time, a natural logarithm of the number of parking spaces, and a dummy variable indicating whether or not a station was the station closest to the trip origin. The model parameters for the mode choice decision included age, gender, income level, and access time and distance. The absence of a transportation network model in this study indicates that the researchers relied exclusively on the stated trip characteristics of the survey respondents. These stated trip characteristics are likely to be inaccurate and biased by individual preferences and perceptions.
Blain (1997) suggested modeling drive-access transit station choice by using a logit model that combined the utility of the auto portion of the trip with the utility of the transit portion of the trip. The parameters used in determining these utilities were simplistic, only auto time, auto distance, transit time and transit fare were examined, and were presumably used only for demonstration purposes. This procedure was undoubtedly superior than assigning all drive-access transit trips to the nearest station or neglecting park-and-ride altogether, however, this model has several major limitations. The first is that the utility of the auto portion of a drive-access trip is assumed
to be the same as the utility of an automobile only trip. The same can be said of the utilities of the transit portion of the drive-access transit trip. A traveler, planning on transferring from automobile to transit at some point in their trip, may value the automobile portion or transit portion of that trip differently than someone choosing to use one mode exclusively. Also, the variables used in the logit model were simplistic, completely ignoring station characteristics such as parking capacity and parking costs.
Hendricks and Outwater (1998) used a logit intermediate choice model to explicitly model the drive-access transit station choice decision as a discrete choice in a multi-step decision process. In addition to calculating utilities for the automobile and transit portion of the trips, a station utility, based on parking costs and a security rating, was also calculated. These three utilities were then combined in a logit model to describe station choice behavior. Additionally, an iterative process was suggested where a dummy variable was introduced as a multiplier that increased with each iteration to reflect the added disutility of using a station where demand was approaching capacity. While this model adds some realism to the model and considers station characteristics as a factor in the station choice decision, it suffers from many of the same drawbacks as previous methods. It also treats the utilities for the auto and transit portions the same as the utilities for those modes when used exclusively. Furthermore, a perceived security rating is hard to quantify and highly variable from traveler to traveler.
Hull (1998) suggested several refinements to the logit model for park-and-ride usage for the greater Vancouver (British Columbia) region. In this model it was suggested that adding a weight to the auto disutility would prevent more "distant origins" from being over-represented in the model. An iterative method using a dummy variable to represent the additional penalty or "shadow price" (Hull, 1998) of choosing to park at a station nearing capacity, was also included. Finally, a bias or penalty was included for park-and-ride trips to ensure that trips from nearby origins were not over-predicted. Again this method suffers from limitations. Weights and biases are introduced to make the model "behave." These weights and biases seem subjective and somewhat arbitrary. A better understanding of the factors that make these weights and biases
necessary would be preferable.
Busby (2004), while attempting to use an accessibility metric to compare planning alternatives, encountered the above mentioned problems of asymmetric trip generation and unrealistic travel behavior. His solution involved arbitrarily designating a 10 mile radius around the CBD where drive-access transit was not a viable mode choice. Additionally, drive-access trips were limited to only those with automobile trip portions of less than 15 minutes, and these automobile drive times were heavily weighted in his generalized cost function. Busby recognized that these modeling techniques were arbitrary, yet due to insufficient information concerning the factors affecting drive-access transit, a more rigorous solution was impossible.
Hoogendoorn-Lanser (2005) examined modeling travel behavior in multi-modal networks primarily for Dutch cities. Her work concluded that activity-based models that took into account traveler's knowledge of the transport system, the road network near the traveler's origin, and the availability of home-based transport modes provided model performance superior to traditional directional models. However, directional models provide the opportunity to establish which trip attributes contribute to the disutility of transferring to another mode. This modal transfer is