HAL Id: insu-01328544
https://hal-insu.archives-ouvertes.fr/insu-01328544
Submitted on 24 Aug 2020
HAL is a multi-disciplinary open access
archive for the deposit and dissemination of
sci-entific research documents, whether they are
pub-lished or not. The documents may come from
teaching and research institutions in France or
abroad, or from public or private research centers.
L’archive ouverte pluridisciplinaire HAL, est
destinée au dépôt et à la diffusion de documents
scientifiques de niveau recherche, publiés ou non,
émanant des établissements d’enseignement et de
recherche français ou étrangers, des laboratoires
publics ou privés.
Ping Zhu, Martin Wild, Michel Van Ruymbeke, Gérard Thuillier, Mustapha
Meftah, Ozgur Karatekin
To cite this version:
Ping Zhu, Martin Wild, Michel Van Ruymbeke, Gérard Thuillier, Mustapha Meftah, et al.. Interannual
variation of global net radiation flux as measured from space. Journal of Geophysical Research:
Atmospheres, American Geophysical Union, 2016, 121 (12), pp.6877-6891. �10.1002/2015JD024112�.
�insu-01328544�
Journal of Geophysical Research: Atmospheres
Interannual variation of global net radiation flux
as measured from space
Ping Zhu1, Martin Wild2, Michel van Ruymbeke1, Gérard Thuillier3,
Mustapha Meftah4, and Ozgur Karatekin1
1Royal Observatory of Belgium, Brussels, Belgium,2Institute for Atmospheric and Climate Science, ETH Zurich, Zurich, Switzerland,3Physikalisch-Meteorologisches Observatorium Davos, World Radiation Center, Davos Dorf, Switzerland, 4Université Paris Saclay, Université Paris VI-Pierre et Marie Curie, CNRS/INSU, LATMOS-IPSL, Guyancourt, France
Abstract
The global net radiation flux (NRF) in and out of the climate system at the top of the atmosphere (TOA) varies at interannual time scales, reflecting the complexity of the processes responsible for attaining global energy equilibrium. These processes are investigated in this study using the previously unexplored data acquired by a bolometric type sensor installed in the PICARD microsatellite. The obtained anomalies in the NRF (PICARD-NRF) are compared to the global NRF changes at the TOA measured by the Clouds and Earth’s Radiant Energy System mission (CERES-NRF). The interanual PICARD-NRF is strongly correlated with the matching period CERES-NRF; the bootstrapped correlation at the 95%(+0.85 and +0.97) confidence intervals is +0.93. Consistency in the interannual variability in the NRF derived by two completely independent measurement systems enhances confidence in the estimated magnitude of these variations. To reveal the possible drivers of the NRF interannual variability, the NRF values were compared with the multivariate El Niño–Southern Oscillation index.1. Introduction
At all time scales, the climate system stays in the state of a dynamic equilibrium when the incoming solar radiation equals the sum of the reflected solar and the thermal radiation emitted by the Earth’s surface (referred to as “reemitted thermal radiation” in this paper) at the top of the atmosphere (TOA). The global net radiation flux (NRF) is the difference between the absorbed solar radiation (incoming minus reflected solar radiation) and the reemitted thermal radiation at the TOA. In order to reach the energy equilibrium, the cli-mate system is constantly self-adjusting through a variety of complex processes. At the same time, radiation balance is strongly affected by the anthropogenic forcing such as greenhouse gases and aerosols [Levitus et al., 2001; Hansen et al., 2005, 2011]. The positive net surface energy over recent years has been inferred from ocean heat storage data derived from the Argo network [Lyman et al., 2010]. The estimates of the absolute amount of NRF in the range between 0.5 and 1.0 W m−2at the TOA are obtained by combining all
measure-ments from ocean and space and analyzing them through the climate models [Allan et al., 2015; Loeb et al., 2012; Stephens et al., 2012]. Since the atmosphere has a negligible heat capacity compared to the ocean, the net downward flux into the ocean, as represented by the ocean heat storage data, corresponds very closely to the NRF measured at the TOA. The surface energy is consistent with the values derived from space [Wild et al., 2015]. While the accuracy of satellite-derived NRF measurements is limited once the instruments are operational, their precision could be improved during postprocessing. It is easier to obtain the estimates of NRF interannual variability than the absolute values of NRF at any exact point in time. The incoming solar radiation is calculated from the total solar irradiance (TSI), which are measured by the solar observation mis-sions like the SORCE-TIM [Kopp and Lean, 2011] and the SOHO-Virgo [Fröhlich et al., 1997], while the reflected solar radiation and the remitted thermal radiation are provided separately by missions like Clouds and Earth’s Radiant Energy System (CERES) [Wielicki et al., 1996; Loeb et al., 2003]. This paper presents the results from a recently launched PICARD microsatellite, which provides measurements of the key variables for determin-ing the interannual changes in the NRF from a sdetermin-ingle platform. PICARD was launched within a solar activity monitoring mission [Thuillier et al., 2006] between June 2010 and March 2014. The satellite was placed at the dawn-dusk Sun-synchronous orbit. The ascending and descending node times were 6 A.M. and 6 P.M., respectively. The broadband bolometric oscillation sensor (BOS) operated as a part of the payload of PICARD [Zhu et al., 2015]. It has continuously measured the total amount of radiation (TAR) including the direct solar
RESEARCH ARTICLE
10.1002/2015JD024112
Key Points:
• The global mean net radiation flux (NRF) is derived from a new independent PICARD-BOS measurement
• The new findings provide additional evidences on the NRF anomaly from space
• Consistency of two independent measurements improves their confidence
Correspondence to:
P. Zhu,
Citation:
Zhu, P., M. Wild, M. van Ruymbeke, G. Thuillier, M. Meftah, and O. Karatekin (2016), Interannual variation of global net radiation flux as measured from space, J. Geo-phys. Res. Atmos., 121, 6877–6891, doi:10.1002/2015JD024112. Received 8 SEP 2015 Accepted 26 MAY 2016
Accepted article online 7 JUN 2016 Published online 24 JUN 2016
©2016. American Geophysical Union. All Rights Reserved.
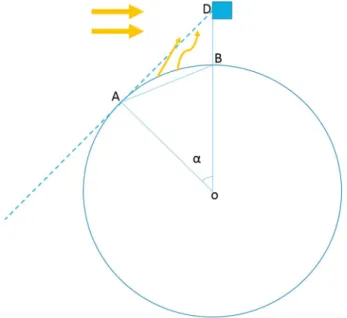
Figure 1. Schematic representation of the measurement setup. Blue box represents the satellite. A is the trajectory point
of the satellite, B is the subsatellite footprint, and O is at the center of the Earth. The thick yellow arrows represent solar radiation, thin straight yellow arrow is reflected solar radiation, and curved one corresponds to the remitted thermal radiation. At any given moment, PICARD-BOS covers a spherical cap of 1.3% of the Earth’s surface.
radiation from the Sun, reflected solar, and reemitted thermal radiation for 3.5 years. From the PICARD-BOS experiment, a 37 month global record of the NRF anomaly was derived. Due to the annual PICARD satellite occultation by the Earth, the PICARD-BOS did not have the full calendar year (12 months) data on the global annual mean NRF; thus, we focused on the interannual variability of NRF and its comparison with the same period data obtained by CERES satellite mission.
2. Data and Methodology
2.1. PICARD Observations
The PICARD-BOS was operated between July 2010 and March 2014. The details on the working principle of the instrument and data reduction of measurements could be found in Zhu et al. [2015]. Total solar irradiance data (TSI) registered by the PREcision MOnitoring Sensor (PREMOS), on the same PICARD platform [Schmutz et al., 2012] was also included in the analysis to calibrate the absolute level of the direct solar radiation measured by PICARD-BOS. The complete Open Access PICARD-BOS and PICARD-PREMOS data sets can be found online at the PICARD archive website (idoc-picard.ias.u-psud.fr and picard-bos.oma.be).
2.1.1. Observation Sequence and Data Processing of PICARD-BOS
The PICARD-BOS has a hemispherical field of view [Zhu et al., 2015]. It is designed to be sensitive to the rel-ative change of received net flux, rather than to the absolute level of each individual flux component. Such configuration on the one hand provides high sampling frequency of about 0.1 s−1and on the other hand
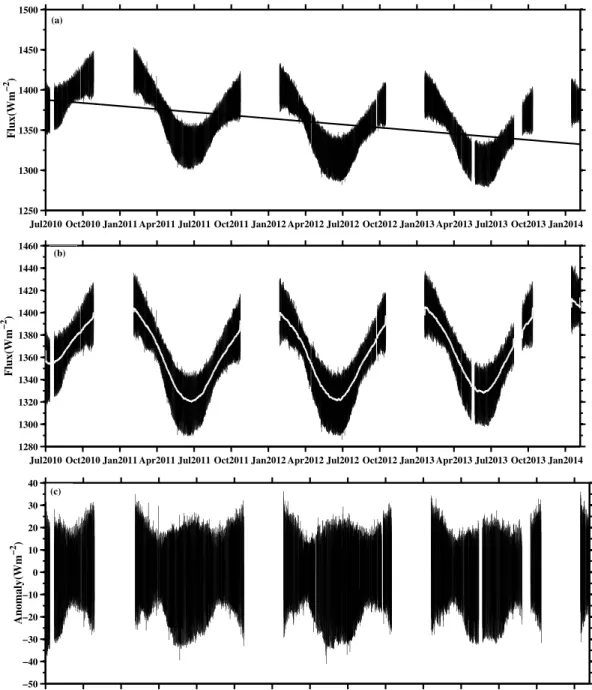
results in the deficient absolute level calibration. However, since there are two absolute radiometers on board the same platform, the PREMOS [Schmutz et al., 2012] and the SOVAP (SOlar VAriability for PICARD) [Meftah et al., 2014], the absolute level of PICARD-BOS could be found by comparison with their measurements over the same period. In our study, we calibrated PICARD-BOS to the PREMOS-TSI product. PICARD-BOS measures the direct solar radiation and the sum of the reflected solar and reemitted thermal radiation at the TOA with the same detector (Figure 1). Constrained by the circular Sun-synchronous orbit, PICARD-BOS covered 1.3% of the global surface area under all-sky conditions at any given moment. Global coverage is reached after two days of data acquisition. The original PICARD-BOS observational drift resulted from the degradation of paint on the sensor (Figure 2a) is modeled using a linear regression function [Zhu et al., 2015]. The total amount of radiation (TAR; Figure 2b) is calculated after the instrument drift correction as the sum of aforementioned radiation fluxes:
Journal of Geophysical Research: Atmospheres
10.1002/2015JD024112
Figure 2. Radiation measured by PICARD-BOS. (a) The total amount of radiation, solid line shows the degradation of the
instrument; (b) the total amount of radiation after removing the instrument drift, white solid line is the direct solar radiation; and (c) anomaly of the sum of the reflected solar and the remitted thermal radiation (ASST).
where ftaris the total amount of radiation, fsis the solar radiation, fris the reflected solar radiation, ftis the
reemitted thermal radiation, and t is time. The direct solar radiation represents the main component of TAR as recorded by the PICARD-BOS. Taking into account that reoccurring visiting time of PICARD subsatellite footprint is about 2 days, we use the 2 day running mean as a low-pass filter to remove the high-frequency signal. This running mean is defined as the direct solar radiation component (fs), and its absolute level (global mean) is calibrated against the TSI measurements (global mean) of PICARD-PREMOS over the same period (Figure 2b, white solid line). The residual, which we get after the subtraction of the direct solar radiation from TAR, is considered as the sum of reflected solar radiation and reemitted thermal radiation (ASST, Figure 2c).
And the anomaly of fASSTis
ΔfASST(t) = fASST− fASST (3)
fASSTis defined at satellite altitude and fois defined at the 20 km TOA level: fo= fASST×
[
(6371.5km + 735.2km)2∕(6371.5km + 20km)2] (4)
And the anomaly of fois
Δfo= fo− ̄fo (5)
The ΔfASSTand the Δfois the anomaly of sum of reflected solar and remitted thermal radiation at satellite
altitude and TOA, respectively. The PICARD-NRF is calculated using anomaly of direct solar radiation and the anomaly of the sum of reflected solar and remitted thermal radiation as discussed later in the paper. Then Δfois gridded monthly with 1∘ resolution globally. In order to find PICARD-NRF, we computed the monthly anomaly of incoming solar radiation (Δfi) as follows
Δfi= 1 4 ( fs(t) − ̄fs(t) ) (6)
When the Δfi and Δfoare obtained from the PICARD-BOS measurements in space, it is assumed that the
interannual variation of the NRF can be derived by comparing Δfiwith Δfo, which will be explained further. 2.1.2. The Uncertainties of the PICARD-BOS Measurements
The main detector of the PICARD-BOS was directly exposed in space without any active thermal con-trol around the detector. Thus, it was sensitive to the environmental temperature change. The absolute level of the global mean fs was calibrated to the global mean TSI measured by PICARD PREMOS. We
also used another TSI time series from the TIM-SORCE measurements acquired during the CERES mission, (lasp.colorado.edu/home/sorce/data/tsi-data/), which, in general, estimated lower TSI values than the previ-ous missions [Kopp and Lean, 2011]. New measurements from PICARD-PREMOS confirm this lower TSI values [Schmutz et al., 2012]. TSI from the PICARD-BOS, PICARD PREMOS, and TIM-SORCE are separately cumu-lated in 100 groups (Figure 3). The distribution was centered and scaled, then fitted by a Gaussian function (y = a ∗ EXP(−((x −𝜇)∕𝜎)2)). The 1𝜎 value is attributed to the uncertainties of the measurement. Through this
way, uncertainties of the fsand the fASSTare found from the complete data set and the monthly series. The 1𝜎 value of PICARD-BOS TSI (0.57 W m−2) is at the same order of magnitude as the PICARD-PREMOS (0.52 W m−2)
and the TIM-SORCE (0.69 W m−2) TSI (Figure 3). Considering the conformity between the 1𝜎 values among
three independent measurements (±0.18 W m−2), we suggest that the systematic instrument noise is
neg-ligible comparing to the solar noise, induced by the activity of dark spots and bright faculae [Fröhlich and Lean, 1998].
The PICARD-BOS was designed to have a linear response to the TAR based on first, the black coating applied on the main detector is uniformly absorbing a broadband radiation ([0.2 30]μm) at 95% confidence intervals (CIs); second, the temperature differences is stable at the level of 0.1 K between the main detector and the heat sink. The first condition is satisfied by the instrument drift correction. The difference temperature between the main detector and the heat sink measured in space was maintained at 2.6 ± 0.1 K during entire PICARD mission; thus, the second condition was met. Therefore, the absolute uncertainty of the TAR value is approxi-mately estimated by scaling the uncertainty of the TSI value by the ratio of the TAR and TSI observations. The uncertainties of TAR is 0.57 × (1361 + 340)∕1361 = 0.71 W m−2. The sensitivity change of the instrument is
−17.85 W m−2/yr at a 95% confidence intervals ([−17.84, −17.88] W m−2/yr). We can deduce the instrument
stability which is 0.28 W m−2per decade. The 3.5 years Δf
ASSTtime series were processed in the same way as
the TSI time series. Its 1𝜎 value is 0.54 W m−2(Figure 4).
2.2. Global Mean NRF from CERES
The CERES derived global mean NRF at the TOA is used in this study to compare with the interannual varia-tion of global mean PICARD-NRF. CERES mission measures shortwave radiance (0.3 and 5 μm), total (0.3 and 200 μm), and windowed (8 and 12 μm) regions [Wielicki et al., 1996]. Due to the absence of the longwave ther-mal channel in CERES, therther-mal radiation is determined by comparing the total channel with the shortwave
Journal of Geophysical Research: Atmospheres
10.1002/2015JD024112
Figure 3. Time series of total solar irradiance from three instruments cumulated in 100 groups and fitted to a Gaussian
function. The sampling rate of BOS is 10 s; average rate of PREMOS and TIM is 1 and 6 h, respectively. The Gaussian fit yields a mean𝜇and a standard deviation𝜎, for BOS they are𝜇 = 1360.71W m−2, and𝜎 = 0.57W m−2, for PREMOS
𝜇 = 1360.58W m−2,𝜎 = 0.51W m−2, and for TIM𝜇 = 1360.77W m−2,𝜎 = 0.69W m−2.
channel measurements. The absolute uncertainties of the CERES global mean shortwave and longwave flux are 2.0 and 3.7 W m−2, respectively [Loeb et al., 2009]. The stability uncertainty of these global mean
measure-ments is roughly 0.5 W m−2per decade [Loeb et al., 2012]. CERES global mean NRF is taken from the energy
balanced and filled, version 2.8 data set (EBAF 2.8; ceres.larc.nasa.gov), in which the solar (shor wave) and thermal (longwave) radiations are adjusted within their uncertainty range in order to be consistent with the global energy imbalance [Loeb et al., 2012]. This imbalance is derived from the ocean heat storage variability based upon ARGO network observations [Lyman et al., 2010].
2.3. Estimation of the Interannual Variation of Global Net Radiation Flux
The absolute level of the global NRF is defined as difference between the global mean absorbed solar radi-ation and the outgoing thermal radiradi-ation. The incoming solar radiradi-ation minus the reflected solar radiradi-ation
Figure 4. The anomalies of the sum of the reflected and reemitted thermal radiation observed by PICARD BOS,
Figure 5. (a) The CERES global mean net radiation flux (NRF) calculated by equation (9) and (14), represented as
circle-marked and dotted lines, respectively. (b) Resulting values plotted against each other, solid line is the linear fit(y = ax + b) with coefficientsa = 1andb = 0.59W m−2.
represents the amount of solar radiation absorbed by the climate system. The incoming solar radiation, fiis
computed from the space measured solar irradiance, fsas follows
fi(t) ≈
1
4fs(t) (7)
Herein, the sum of reemitted thermal radiation, ft, and reflected solar radiation, fr, is written as fo:
fo(t) = ft(t) + fr(t) (8)
Then the global mean NRF, fnet, equals:
fnet(t) = fi(t) − fo(t) (9)
Since the incoming solar radiation is changing at the level ±0.2 W m−2with the 11 year solar cycle [Loeb et al.,
2009], the ficould be expressed as a mean incoming solar radiation plus its anomaly during a certain period:
fi(t) = ̄fi+ Δfi(t) (10)
Thus, the corresponding sum of the reflected solar and remitted thermal radiation, fo, for a given period equals
Journal of Geophysical Research: Atmospheres
10.1002/2015JD024112
Figure 6. We calculated the solar zenith angle of each sub satellite footprint. Values were cumulated year by year and
fitted by the Gaussian function.𝜎and𝜇values of Gaussian fit are shown in the legend.
The global NRF can be described by the equation
fnet(t) = ̄fnet(t) + Δfnet(t) (12)
or
fnet(t) = ̄fi(t) − ̄fo(t) +
(
Δfi(t) − Δfo(t)) (13)
For the climate equilibrium case when ̄fi(t) = ̄fo(t) or ̄fnet(t) = 0 the equation (12) reduces to
fnet(t) = Δfnet(t) = Δfi(t) − Δfo(t) (14)
Therefore, NRF is equal to anomaly of NRF and it can be estimated by anomaly of direct solar radiation and anomaly of the sum of reflected solar and remitted thermal radiation.
But if the ̄fi− ̄fo=𝛿 ≠ 0, a correction factor 𝛿 = ̄fi(t) − ̄fo(t) need to be applied when the fnetis computed with
equation (14):
fnet(t) = Δfi(t) − Δfo(t) +𝛿 (15)
Figure 7. (a) The thermal radiation of the PICARD-BOS compared with the corresponding CERES measurements.
(b) Illustrated Pearsons skipped correlations with the 95% bootstrapped CIs as pink shaded areas. Histograms show the bootstrapped variance differences. Vertical red lines indicate 95% CIs.
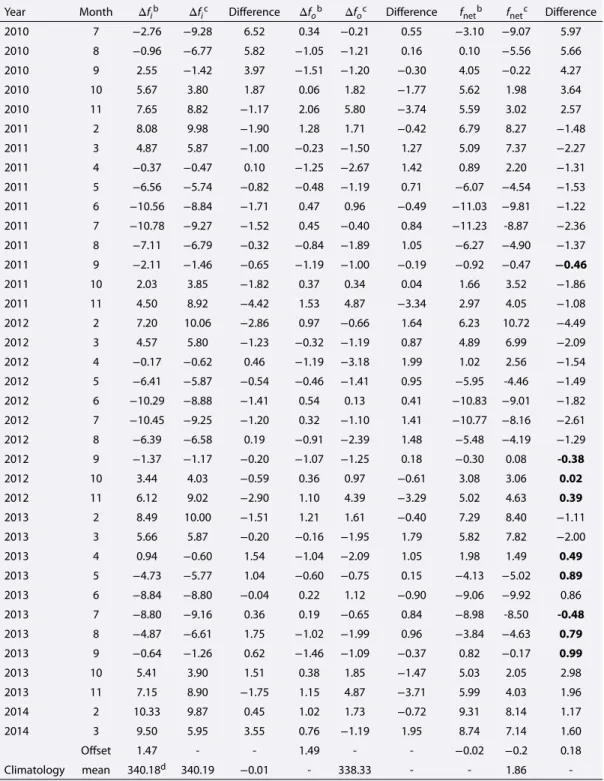
Table 1. Comparison ofΔfi,Δfo, andfnet, Computed from PICARD and CERES Measurementsa
Year Month Δfib Δf
ic Difference Δfob Δfoc Difference fnetb fnetc Difference
2010 7 −2.76 −9.28 6.52 0.34 −0.21 0.55 −3.10 −9.07 5.97 2010 8 −0.96 −6.77 5.82 −1.05 −1.21 0.16 0.10 −5.56 5.66 2010 9 2.55 −1.42 3.97 −1.51 −1.20 −0.30 4.05 −0.22 4.27 2010 10 5.67 3.80 1.87 0.06 1.82 −1.77 5.62 1.98 3.64 2010 11 7.65 8.82 −1.17 2.06 5.80 −3.74 5.59 3.02 2.57 2011 2 8.08 9.98 −1.90 1.28 1.71 −0.42 6.79 8.27 −1.48 2011 3 4.87 5.87 −1.00 −0.23 −1.50 1.27 5.09 7.37 −2.27 2011 4 −0.37 −0.47 0.10 −1.25 −2.67 1.42 0.89 2.20 −1.31 2011 5 −6.56 −5.74 −0.82 −0.48 −1.19 0.71 −6.07 −4.54 −1.53 2011 6 −10.56 −8.84 −1.71 0.47 0.96 −0.49 −11.03 −9.81 −1.22 2011 7 −10.78 −9.27 −1.52 0.45 −0.40 0.84 −11.23 -8.87 −2.36 2011 8 −7.11 −6.79 −0.32 −0.84 −1.89 1.05 −6.27 −4.90 −1.37 2011 9 −2.11 −1.46 −0.65 −1.19 −1.00 −0.19 −0.92 −0.47 −0.46 2011 10 2.03 3.85 −1.82 0.37 0.34 0.04 1.66 3.52 −1.86 2011 11 4.50 8.92 −4.42 1.53 4.87 −3.34 2.97 4.05 −1.08 2012 2 7.20 10.06 −2.86 0.97 −0.66 1.64 6.23 10.72 −4.49 2012 3 4.57 5.80 −1.23 −0.32 −1.19 0.87 4.89 6.99 −2.09 2012 4 −0.17 −0.62 0.46 −1.19 −3.18 1.99 1.02 2.56 −1.54 2012 5 −6.41 −5.87 −0.54 −0.46 −1.41 0.95 −5.95 -4.46 −1.49 2012 6 −10.29 −8.88 −1.41 0.54 0.13 0.41 −10.83 −9.01 −1.82 2012 7 −10.45 −9.25 −1.20 0.32 −1.10 1.41 −10.77 −8.16 −2.61 2012 8 −6.39 −6.58 0.19 −0.91 −2.39 1.48 −5.48 −4.19 −1.29 2012 9 −1.37 −1.17 −0.20 −1.07 −1.25 0.18 −0.30 0.08 -0.38 2012 10 3.44 4.03 −0.59 0.36 0.97 −0.61 3.08 3.06 0.02 2012 11 6.12 9.02 −2.90 1.10 4.39 −3.29 5.02 4.63 0.39 2013 2 8.49 10.00 −1.51 1.21 1.61 −0.40 7.29 8.40 −1.11 2013 3 5.66 5.87 −0.20 −0.16 −1.95 1.79 5.82 7.82 −2.00 2013 4 0.94 −0.60 1.54 −1.04 −2.09 1.05 1.98 1.49 0.49 2013 5 −4.73 −5.77 1.04 −0.60 −0.75 0.15 −4.13 −5.02 0.89 2013 6 −8.84 −8.80 −0.04 0.22 1.12 −0.90 −9.06 −9.92 0.86 2013 7 −8.80 −9.16 0.36 0.19 −0.65 0.84 −8.98 -8.50 -0.48 2013 8 −4.87 −6.61 1.75 −1.02 −1.99 0.96 −3.84 −4.63 0.79 2013 9 −0.64 −1.26 0.62 −1.46 −1.09 −0.37 0.82 −0.17 0.99 2013 10 5.41 3.90 1.51 0.38 1.85 −1.47 5.03 2.05 2.98 2013 11 7.15 8.90 −1.75 1.15 4.87 −3.71 5.99 4.03 1.96 2014 2 10.33 9.87 0.45 1.02 1.73 −0.72 9.31 8.14 1.17 2014 3 9.50 5.95 3.55 0.76 −1.19 1.95 8.74 7.14 1.60 Offset 1.47 - - 1.49 - - −0.02 −0.2 0.18 Climatology mean 340.18d 340.19 −0.01 - 338.33 - - 1.86 -aThe bold character highlights the values, at which the difference off
netis< 1.0W m−2between CERES and PICARD.
The mean values of each parameter from PICARD and climatology mean of each component from CERES are given at the end of table.
bValues from PICARD-BOS. cValues from CERES.
Journal of Geophysical Research: Atmospheres
10.1002/2015JD024112
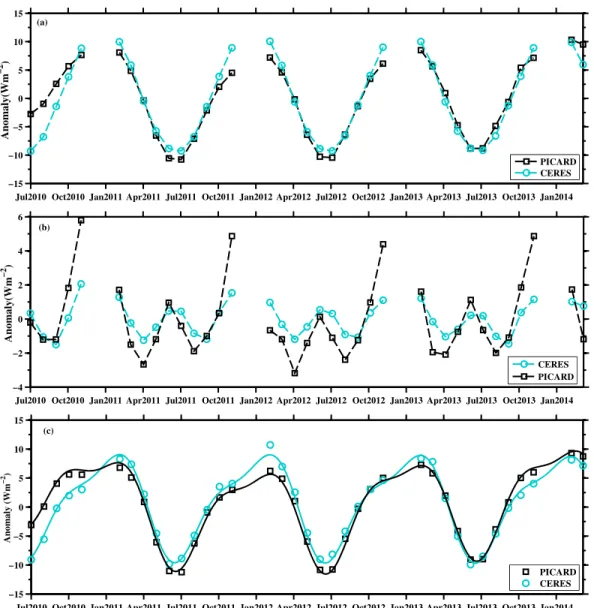
Figure 8. Values over 37 months from CERES-NRF are marked by blue dots, while the black squares are from
PICARD-NRF. Comparison of the mean global anomaly of (a)Δfi, (b)Δfo, and (c)Δfnet. (c) The solid lines show the seasonal cycles which were fitted separately using a 6 orders sinusoid function. (d and e) The results of the correlation analysis made with each subsets.
Because the𝛿 is a small and nearly constant term at interannual time scales, the monthly anomaly of fnet
derived from equation (14) bears a strong resemblance to that calculated with equation (9). To prove this, we compared the interannual variation of fnetcomputed from the CERES EBAF ver.2.8 using equations (9) and (14). We reconstructed 179 monthly anomalies of fi(t) and fo(t) from the CERES global mean net radiation, reflected solar radiation, and reemitted thermal radiation data. Δfiand Δfowere obtained by removing mean
value from the monthly anomaly of variable and then substituted in equation (14) to calculate the monthly anomaly of fnet. CERES fnetobtained from equations (9) and (14) are plotted together (Figure 5a). Comparison
between fnetvalues calculated in different ways reveals a perfect positive correlation with a constant offset of
0.59 W m−2(Figure 5b), which proofs the equivalence of both approaches to calculate f
net. Since this work is
focused on the interannual variation in the global NRF, but not on the absolute level of fnet, both methods are applicable.
As PICARD-BOS cannot resolve reflected solar and reemitted thermal radiation separately, PICARD-NRF is inferred from the global mean anomaly of Δfiand Δfousing equation (14). This differs from the published global net radiation of CERES, where the reflected solar and the reemitted thermal fluxes are separated, which allows the computation of the NRF using equation (9). However, the testing with the CERES data discussed
Figure 8. (continued)
above proofs that the interannual variation in fnetcan be obtained by comparing the anomalies between the Δfiand the Δfo. Δfiand Δfoanomalies are calculated as discussed in the “Observation sequence and data processing of PICARD-BOS” subsection.
3. Comparisons of PICARD-BOS Data with CERES
3.1. Comparisons of the Thermal Flux Between PICARD-BOS and CERES
The PICARD-BOS measured both the direct solar radiation and the sum of the reemitted thermal and reflected solar radiation. The thermal flux is defined for data with solar zenith angle larger than 90∘. We calculated the solar zenith angle of each subsatellite footprint (Figure 6). About 50% of the measurements were taken at a high solar zenith angle (>90∘). Those measurements were grouped together to compute the global
Journal of Geophysical Research: Atmospheres
10.1002/2015JD024112
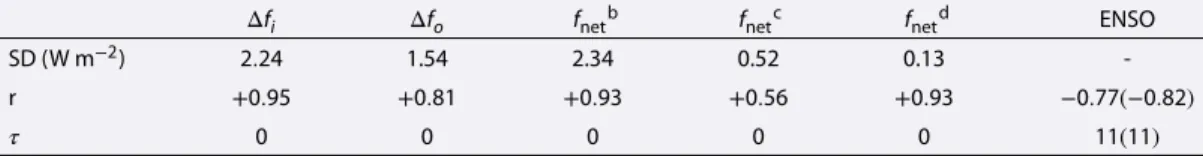
Table 2. The Standard Deviation is Calculated From the Residuals of Linear Regression Between Subsets of PICARD
and CERESa
Δfi Δfo fnetb fnetc fnetd ENSO
SD (W m−2) 2.24 1.54 2.34 0.52 0.13
-r +0.95 +0.81 +0.93 +0.56 +0.93 −0.77(−0.82)
𝜏 0 0 0 0 0 11(11)
aResults of cross-correlation analysis between the parameters computed from PICARD and CERES measurements.
The coefficients of cross correlation between global mean PICARD-NRF and ENSO MEI are given. We repeated the cross-correlation analysis processes after replacing the global mean PICARD-NRF with the CERES-NRF (values in brackets).
bSeasonal cycle is kept. cSeasonal cycle was removed.
d11-point moving average of deseasonalized results.
zonal mean. Since PICARD-BOS produces variation of the thermal flux, the mean of CERES observed longwave radiation is also extracted for comparisons. Both data sets during the 37 month matching time period are nor-malized and compared (Figure 7a). A high correlation (r = 0.98 at 95% CIs) is obtained, the CIs of the r was computed with bootstrapped correlation method [Pernet et al., 2013]. Despite the high correlation, there are remaining differences between the zonal mean distributions, concentrated on the north high-latitude area (>+36∘) and the southern tropical region ([−30∘, 0∘], Figure 7b). The possible explanation could be the insuf-ficient removal of the shortwave radiation by current approach, which could certainly reduce the quantity of thermal radiation observed by PICARD-BOS. It is also the reason we focused on the interannual variation of global mean NRF found from PICARD-BOS rather than the absolute level of individual radiation component.
3.2. Comparison of the Net Flux Between PICARD-BOS and CERES
The interannual variability of NRF is derived from two independent measurement systems: CERES on the one hand with a measurement record of 168 months and PICARD on the other hand with a record of 37 months. The values of Δfi, Δfo, and fnet variables calculated from both data sets during the 37 month matching
time period are listed in Table 1. The interannual variation of the global mean NRF, fnetis calculated using
equation (14) and referred as CERES-NRF and PICARD-NRF, respectively. The 37 month record of the global mean PICARD-NRF covers a period from July 2010 to March 2014. The CERES-NRF (from CERES -EBAF-TOA version Ed2.8 data set) used in this work covers a period from January 2001 to December 2014, spanning a total of 168 months. Details about the instrument measuring NRF at the TOA by CERES have been discussed in several works [Loeb et al., 2003; Wong et al., 2006; Doelling et al., 2013]. The accuracy required to track the absolute level of NRF from satellites, however, remains a challenge [Loeb et al., 2012; Hansen et al., 2011; Trenberth et al., 2014].
The PICARD-BOS measured monthly and seasonal variation of Δfiis closely following the changes of CERES incoming solar radiation. A large discrepancy between the two data sets is observed at the beginning of the time series, which is most likely associated with the contamination of the PICARD-BOS sensor during the ini-tial satellite outgassing period and disappeared after 5 months of operation in space (Figure 8a). Since the PICARD-BOS is not thermally stabilized [Zhu et al., 2015], the large temperature gradient modulations can interfere with the measurements. Such effects are observable for the records before and after the occultation season of each year (Figures 8a and 8b); thus, observations from the occultation period (December to Jan-uary) were excluded from the net radiation analysis. More precisely, the occultation begun around each of 5 November and ended around the next 20 February. At the beginning of the occultation season, a small sharp decrease in measured flux could be detected in each satellite orbit. Those kinds of anomalies has perturbed the Δfovalues calculated from the observations of each November. It demonstrates a higher Δfothan CERES’. Both Δfiand Δfowere perturbed by the occultation in each November; however, since fnetwere calculated by subtracting one from another, the influence is less significant than the case of Δfo. As it is showed in Figure 8c, there is not a single large outlier in Δfnetcompared between PICARD and CERES (Figure 8c). The remaining differences could be explained by the lack of diurnal sampling of PICARD-BOS, which strongly affects both reflected shortwave and the thermal outgoing radiation [Taylor, 2012].
The PICARD-NRF was calculated by equation (14) and displayed in Figure 8c. The circle and rectangular marks the computed fnetusing CERES and PICARD measurements, respectively. The solid line is a 6 orders sinusoid
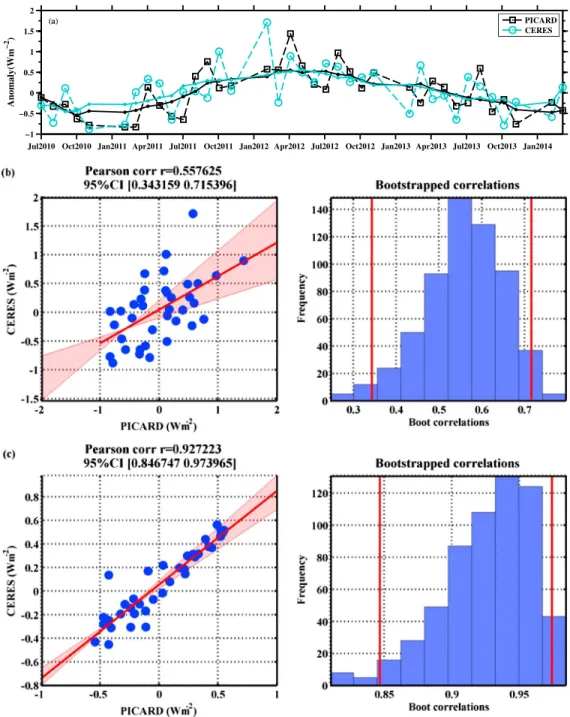
Figure 9. (a) Comparison of the interannual change between the deseasonalized global mean PICARD-NRF (dashed
line with black squares) and the global mean CERES-NRF (dashed line with blue circles). Solid line shows the 11-point moving average results of the deseaonalized NRF. (b and c) Standard deviation of the linear regression residuals between PICARD-NRF and CERES-NRF is 0.52 W m−2and 0.13 W m−2, respectively. Therbetween the global
PICARD-NRF and CERES-NRF is given.
PICARD-BOS did not have a full diurnal cycle resolution and a 12 calendar month annual coverage. This leads to a difference in the derived seasonal cycle between PICARD and CERES. The cross-correlation coefficients (r) are computed between the subsets of PICARD and CERES data (Figures 8e and 8f ). The standard deviations (SD) were computed from the residuals of the linear fits and given in Table 2. The SD values of Δfi, Δfo, and
Δfnetremain higher than the aforementioned instrument uncertainties, while the r value is highest for the observed anomalies in incoming solar radiation among three subsets.
In order to study the interannual NRF further, the seasonal cycles were separately removed from the fnetof PICARD and CERES. The deseasonalized NRF anomalies from the CERES and the PICARD data sets are showed
Journal of Geophysical Research: Atmospheres
10.1002/2015JD024112
Figure 10. CERES-NRF compared with the multivariate ENSO index during the past 15 years. The global mean radiation
is derived from CERES-NRF (blue dot), the tropical mean radiation is derived from CERES-NRF (red triangle), and the MEI index (grey bar); these are normalized separately using the absolute maximum value given in the figure legend.
in Figure 9a (dashed line). Their correlations were calculated (Figure 9b). A lowermost +0.56 weak correla-tion is detected for deseasonalized NRF. On the other hand, this proofs the importance of a diurnal sampling to study the short-term monthly NRF. The deseasonalized data were smoothed with an 11-point moving average, which is considered as the final version of the interannual variation in NRF (Figure 9a, solid line). After removing those short-term oscillations in deseasonalized NRF, it yields a higher r value +0.93 than the desea-sonalized data sets. There is no time delay detected between the variables computed from the PICARD and CERES data. Over the limited observation period of 37 months, a strong correlation (r = +0.93) between the interannual variation in global mean PICARD-NRF and CERES-NRF was found at the 95% confidence interval [+0.847 +0.974]. The strong correlation indicates a good agreement between the PICARD-NRF variability and the independent CERES-NRF values.
4. The ENSO MEI Index and the Interannual Variation in NRF
The El Niño–Southern Oscillation is one of the main drivers of short-period global climate variability. The cor-relation between the interannual variability of global mean NRF and ENSO was studied using the multivariate ENSO index (MEI) [Wolter and Timlin, 1993] (www.esrl.noaa.gov/psd/enso/) and the global mean NRF obtained from the CERES and the short-period PICARD data sets. The PICARD-NRF and CERES-NRF show negative cor-relation to the ENSO MEI index (Table 2). A comparison of interannual variability of NRF and the ENSO over the period 2001 to 2014 using the decedal CERES-NRF was completed. Between the years 2000 and 2004, the ENSO frequency was slightly lower than that between 2005 and 2014; this relatively neutral condition during the former time period explains stability of the CERES-NRF anomalies at the TOA (Figure 10). Starting from the end of 2005 and the beginning of 2006, periods dominated by El Niño or La Niña were much stronger, of longer duration, and showed rapid changes over a shorter period; such climate condition prevailed until the end of 2012. This complete process is easily visible in the variation of the CERES-NRF, and it has also been demonstrated by [Loeb et al., 2012]. As shown above, variations in ENSO can account for roughly two thirds (r = −0.57 and +0.60) of the interannual variation in global mean NRF derived from CERES(Table 3); for the decades 2001–2010 and 2005–2014. Global and tropical mean NRF was calculated using the CERES data set. Coefficients of cross-correlation r were computed between CERES-NRF and the ENSO index (MEI). As expected, the r calculated between the tropical mean CERES-NRF and ENSO index has the same sign and a slightly
Table 3. Cross-Correlation Coefficients Between the Global Mean CERES-NRF
and the ENSO MEI Indexa
2001—2010 2005–2014
r −0.57(−0.75) 0.60(0.63)
𝜏 5 (4) −9(−9)
aThe computation was repeated after replacing the global mean
higher value as the global CERES-NRF(Figure 10). However, the exact driving mechanisms of the interannual variation of NRF are not yet fully understood. The cause of the remaining interannual variability needs to be investigated further in respect to the other possible drivers; for example, the hydrological cycle could play an important role in determination of the NRF variability [Wild and Liepert, 2010]. In addition, El Niño–Southern Oscillation can temporarily change the energy balance for periods of days. Understanding and attribution of the changes is necessary to enable reliable future projections on multiple time scales. The temporal variations also provide the necessary fodder for analyzing natural variability, such as that caused by ENSO.
5. Discussion and Conclusions
A new method, to estimate the global net radiation at the TOA based on the satellite measurements from PICARD-BOS was introduced. This method was initially tested using the CERES measurements and then applied to the observations of PICARD-BOS. The variation of the global mean NRF was derived from the PICARD observations over a 37 month period between 2010 and 2014 and compared with the NRF derived from CERES data for the same period. The correlation between the interannual change of the global PICARD-NRF and the global CERES-NRF was +0.93 with a 95% CIs proving that indeed the NRF measured by PICARD-BOS reflects the interannual changes in the NRF. The remarkable agreement between the observed NRF anomalies from both PICARD and CERES data sets approves to the credibility of these variations found from two independent observation systems.
Comparison with the multivariate ENSO index identified a negative correlation with the NRF over the 37 months covered by PICARD observation and a same order of magnitude correlation suggested by CERES data, which was also found for the CERES-NRF data observed during 2001 and 2010. However, following a series of strong La Niña events that began in 2007, the variation of global NRF derived from CERES increased. A higher positive correlation was detected between the CERES-NRF and the ENSO index for the past decade (2005–2014). Cross-correlation coefficient r between the global CERES-NRF and ENSO did not deviate signif-icantly from that between the tropical CERES-NRF and ENSO suggesting that the interannual change of NRF is dominated by the ENSO triggered energy distribution. Indeed, the effect of some past events such as vol-canic eruptions, La Niña cooling, and El Niño warming is noticeable in the observed variation of global NRF [Loeb et al., 2012] and the reconstructed global NRF [Harries and Belotti, 2010]. In addition, despite the debate on the global warming hiatus over past decades [Karl et al., 2015; Trenberth and Fasullo, 2013], the positive net surface energy anomaly is observed from the ocean heat content measurements [Lyman et al., 2010] indicating that the climate system has been continuously accumulating energy for decades.
Therefore, it is important to monitor the NRF and its multi–time scale variability continuously, which could provide a key to determine how the energy anomaly is redistributed. The PICARD-BOS measured TAR provides an alternative way to track the interannual variability of NRF. The advantage of this method is that TAR from PICARD-BOS is less dependent on the absolute accuracy of the direct solar irradiance component as it is simul-taneously recorded with the reflected solar and outgoing thermal radiation emitted from Earth by the same detector. Furthermore, sudden decreases in solar radiation due to the appearances of sunspots are easily taken into account by subtracting the solar radiation from the total amount of measured radiation. There are sev-eral challenges that need to be resolved before the full annual and diurnal sampling of TAR by this approach could be accomplished, such as the effect of periodic Earth occultation on the satellites with Sun-synchronized orbits satellites, diurnal cycle sampling, and low spatial resolution of satellite imaging due to the complexity of forward tracking. Nevertheless, the alternative method applied to the PICARD-BOS experiment provides a new approach to track and understand the interannual variability of NRF observed from satellites.
References
Allan, R. P., C. Liu, N. G. Loeb, M. D. Palmer, M. Roberts, D. Smith, and P.-L. Vidale (2014), Changes in global net radiative imbalance 1985–2012, Geophys. Res. Lett., 41, 5588–5597, doi:10.1002/2014GL060962.
Doelling, D. R., N. G. Loeb, D. F. Keyes, M. L. Nordeen, D. Morstad, C. Nguyen, B. A. Wielicki, D. F. Young, and M. Sun (2013), Geostationary enhanced temporal interpolation for CERES flux products, J. Atmos. Oceanic Technol., 30(6), 1072–1090.
Fröhlich, C., and J. Lean (1998), The Sun’s total irradiance: Cycles, trends and related climate change uncertainties since 1976, Geophys. Res. Lett., 25(23), 4377–4380.
Fröhlich, C., N. A. Bo, T. Appourchaux, G. Berthomieu, D. A. Crommelynck, V. Domingo, and A. Fichot (1997), First results from VIRGO, the experiment for helioseismology and solar irradiance monitoring on SOHO, Sol. Phys., 170(1), 1–25.
Hansen, J., L. Nazarenko, R. Ruedy, M. Sato, J. Willis, A. Del Genio, and D. Koch (2005), Earth’s energy imbalance: Confirmation and implications, Science, 308(5727), 1431–1435.
Acknowledgments
We highly appreciate the valuable review comments of the anonymous reviewers, which helped improve the overall quality of the paper. We appreciate the instruction about the CERES product given by Norman Loeb, the discussions on the GERB measurements with Steven Dewitte, and the supports on PICARD-BOS experiment received from the PICARD mission team in CNES France as well as in BUSOC Belgium. The integration of the BOS to the PICARD platform has been conducted by Jean-Phillippe Noel, Andre Chevalier, and Christine Conscience. This work was founded by the ESA-PRODEX program, managed by the Belgian Scientific Policy Office, PEA:4000103202. The data of PICARD-BOS and PICARD-PREMOS are open access through idoc-picard.ias.u-psud.fr and for picard-bos also through picard-bos.oma.be. The CERES data is available at ceres.larc.nasa.gov. The SORCE/TIM data can be found at lasp.colorado.edu/home/sorce/data/ tsi-data/, and the ENSO index is avail-able at www.esrl.noaa.gov/psd/enso/.
Journal of Geophysical Research: Atmospheres
10.1002/2015JD024112
Hansen, J., M. Sato, P. Kharecha, and K. von Schuckmann (2011), Earth’s energy imbalance and implications, Atmos. Chem. Phys., 11(24), 13,421–13,449.
Harries, J. E., and C. Belotti (2010), On the variability of the global net radiative energy balance of the nonequilibrium Earth, J. Clim., 23(6), 1277–1290.
Karl, T. R., A. Arguez, B. Huang, J. H. Lawrimore, J. R. McMahon, M. J. Menne, T. C. Peterson, R. S. Vose, and H.-M. Zhang (2015), Possible artifacts of data biases in the recent global surface warming hiatus, Science, 348(6242), 1469–1472.
Kopp, G., and J. L. Lean (2011), A new, lower value of total solar irradiance: Evidence and climate significance, Geophys. Res. Lett., 38, L01706, doi:10.1029/2010GL045777.
Levitus, S., J. I. Antonov, J. Wang, T. L. Delworth, K. W. Dixon, and A. J. Broccoli (2001), Anthropogenic warming of Earth’s climate system, Science, 292(5515), 267–270.
Loeb, N. G., N. Manalo-Smith, S. Kato, W. F. Miller, S. K. Gupta, P. Minnis, and B. A. Wielicki (2003), Angular distribution models for top-of-atmosphere radiative flux estimation from the Clouds and the Earth’s radiant energy system instrument on the tropical rainfall measuring mission satellite. Part I: Methodology, J. Appl. Meteorol., 42(2), 240–265.
Loeb, N. G., B. A. Wielicki, D. R. Doelling, G. Louis Smith, D. F. Keyes, S. Kato, N. Manalo-Smith, and T. Wong (2009), Toward optimal closure of the Earth’s top-of-atmosphere radiation budget, J. Clim., 22(3), 748–766.
Loeb, N. G., J. M. Lyman, G. C. Johnson, R. P. Allan, D. R. Doelling, T. Wong, B. J. Soden, and G. L. Stephens (2012), Observed changes in top-of-the-atmosphere radiation and upper-ocean heating consistent within uncertainty, Nat. Geosci., 5(2), 110–113.
Loeb, N. G., S. Kato, S. Wenying, T. Wong, F. G. Rose, D. R. Doelling, J. R. Norris, and X. Huang (2012), Surv. Geophys., 33(3–4), 359–385. Lyman, J. M., S. A. Good, V. V. Gouretski, M. Ishii, G. C. Johnson, M. D. Palmer, D. M. Smith, and J. K. Willis (2010), Robust warming of the global
upper ocean, Nature, 465(7296), 334–337.
Meftah, M., S. Dewitte, A. Irbah, A. Chevalier, C. Conscience, D. Crommelynck, E. Janssen, and S. Mekaoui (2014), SOVAP/PICARD, a spaceborne radiometer to measure the total solar irradiance, Sol. Phys., 289, 1885–1899.
Pernet, C. R., R. Wilcox, and G. A. Rousselet (2013), Robust correlation analyses: False positive and power validation using a new open source Matlab toolbox, Front. Psychol., 3, 606, doi:10.3389/fpsyg.2012.00606.
Schmutz, W., A. Fehlmann, G. Kopp, W. Finsterle, G. Kopp, and G. Thuillier (2012), Total solar irradiance measurements with PREMOS/PICARD, in Radiation Processes in the Atmosphere and Ocean (IRS2012), Proceedings of the International Radiation Symposium (IRC/IAMAS) AIP Conf. Proc. 1531, edited by R. F. Cahalan and J. Fischer, pp. 624–627, AIP Publ. LLC, Melville, New York., doi:10.1063/1.4804847
Stephens, G. L., J. Li, M. Wild, C. A. Clayson, N. Loeb, S. Kato, T. L’Ecuyer, P. W. Stackhouse Jr., M. Lebsock, and T. Andrews (2012), An update on Earth’s energy balance in light of the latest global observations, Nat. Geosci., 5(10), 691–696.
Taylor, P. C. (2012), Tropical outgoing longwave radiation and longwave cloud forcing diurnal cycles from CERES, J. Atmos. Sci., 69(12), 3652–3669.
Thuillier, G., S. Dewitte, and W. Schmutz (2006), Simultaneous measurement of the total solar irradiance and solar diameter by the PICARD mission, Adv. Space Res., 38(8), 1792–1806.
Trenberth, K. E., and J. T. Fasullo (2013), An apparent hiatus in global warming?, Earth’s Future, 1(1), 19–32. Trenberth, K. E., J. T. Fasullo, and M. A. Balmaseda (2014), Earth’s energy imbalance, J. Clim., 27(9), 3129–3144.
Wielicki, B. A., B. R. Barkstrom, E. F. Harrison, R. B. Lee III, G. L. Smith, and J. E Cooper (1996), Clouds and the Earth’s Radiant Energy System (CERES): An Earth observing system experiment, Bull. Am. Meteorol. Soc., 77, 853–868.
Wild, M., and B. Liepert (2010), The Earth radiation balance as driver of the global hydrological cycle, Environ. Res. Lett., 5(2), 025203. Wild, M., D. Folini, M. Z. Hakuba, C. Schär, S. I. Seneviratne, S. Kato, D. Rutan, C. Ammann, E. F. Wood, and G. König-Langlo (2015), The
energy balance over land and oceans: An assessment based on direct observations and CMIP5 climate models, Clim. Dyn., 44(11–12), 3393–3429.
Wolter, K., and M. S. Timlin (1993), Monitoring ENSO in COADS with a seasonally adjusted principal component index, paper presented at 17th Climate Diagnostics Workshop, pp. 52–70, OK, NOAA/NMC/CAC, NSSL, Oklahoma Clim. Survey, CIMMS and the School of Meteorol., Univ. of Oklahoma.
Wong, T., B. A. Wielicki, R. B. Lee III, G. Louis Smith, K. A. Bush, and J. K. Willis (2006), Reexamination of the observed decadal variability of the earth radiation budget using altitude-corrected ERBE/ERBS nonscanner WFOV data, J. Clim., 19(16), 4028–4040.
Zhu, P., M. van Ruymbeke, Ö. Karatekin, J.-P. Noël, G. Thuillier, S. Dewitte, A. Chevalier, C. Conscience, E. Janssen, M. Meftah, and A. Irbah (2015), A high dynamic radiation measurement instrument: The Bolometric Oscillation Sensor (BOS), Geosci. Instrum. Method Data Syst., 4, 89–98.