Toward Reproducible Three-Dimensional Microstructure
Analysis of Granular Materials and Complex Suspensions
Lorenz Holzer* and Beat MünchEmpa Materials Science and Technology, 8600 Dübendorf, Switzerland
Abstract: Focused ion beam nanotomography ~FIB-nt! is a novel method for high resolution three-dimensional
~3D! imaging. In this investigation we assess the methodological parameters related to image acquisition and data processing that are critical for obtaining reproducible microstructural results from granular materials and from complex suspensions. For this purpose three case studies are performed: ~1! The precision of FIB-nt is evaluated by analyzing a reference sample with nanospheres. Due to the implementation of an automated correction procedure, drift phenomena can be removed largely from the FIB data. However, at high magnifica-tions remaining drift components can induce problems for 3D-shape reconstrucmagnifica-tions. ~2! Correct object recognition from densely packed microstructures requires specific algorithms for splitting of agglomerated particles. To establish quantitative criteria for the correct degree of splitting, a parametric study with dry portland cement is performed. It is shown that splitting with a k-value of 0.6 leads to accurate results. ~3! Finally, the reproducibility of the entire cryo-FIB analysis is investigated for high pressure frozen cement suspensions. Reproducible analyses can be obtained if the magnification is adapted to the particle size. At low magnifications the small particles and their surface area are underestimated. At high magnifications representa-tivity is questioned because local inhomogeneities can become dominant.
Key words: focused ion beam ~FIB!, nanotomography, image analysis, particle size distribution, nanoparticles,
agglomeration, ordinary portland cement, cryomicroscopy
I
NTR ODUCTIONMicroscopic particle analysis of granular materials requires reliable high-resolution imaging techniques and suitable image analysis procedures. Thereby, complex suspensions are among the most difficult granular materials for such investigations. Recently, the high-resolution focused ion beam nanotomography ~FIB-nt! technique has been adapted for cryoimaging, and first quantitative results were presented for cement suspensions ~Holzer et al., 2007; Zingg et al., 2008!. In the present article the methodological require-ments for representative particle analysis with ~cryo-!FIB-nt are critically evaluated.
Suspensions with high solid volume fractions are widely used in materials processing of colloids, ceramics, cements, and various composites. However, a quantitative micro-scopic description of the corresponding particle structures is widely missing because of a lack of suitable methods. The microstructural complexity of these systems includes irreg-ular particle shapes ~i.e., nonsphericity!, polydispersity ~i.e., wide particle size distributions!, chemically reactive compo-nents ~i.e., time dependency of the systems!, and also
phys-ical instabilities ~e.g., the tendency to flocculate!. Each of these phenomena, which are difficult to describe quantita-tively, may have considerable influence on flow properties and on colloidal stability. On a theoretical level, colloidal stability and associated mechanical properties can be consid-ered as the result of the total interaction forces between particles in suspension, which can be obtained by the sum-mation of forces at the individual particle contacts ~Russel et al., 1989!. Hence, in addition to a description of the dominant forces at the individual contacts, it is of major interest to characterize quantitatively the particle densities and the number of contacts. For nonreactive systems that undergo neither dissolution precipitation nor agglomera-tion, the particle structures and the corresponding contact numbers can be modeled indirectly from geometrical con-siderations based on the parameters from the raw materials ~i.e., particle size distributions! and by taking into account the mix parameters such as solid volume fraction and particle size distribution ~Suzuki & Oshima, 1983; Flatt & Bowen, 2006!. However, for systems that undergo chemical reactions or that tend to form nonuniform spatial arrange-ments of the particles ~i.e., flocculation/agglomeration!, the true particle structure can only be determined by microstruc-ture analysis directly from the suspension. Unfortunately, experimental characterization with methods that work well for suspensions with low solid volume fractions is highly
Received October 1, 2008; accepted December 27, 2008 *Corresponding author. E-mail: lorenz.holzer@empa.ch
Microsc. Microanal. 15, 130–146, 2009
doi:10.1017/S1431927609090163
M
icroscopy
A N DM
icroanalysis
controversial in suspensions with high solid loadings ~see, for example, Goodwin, 2004 for discussion of small angle neutron scattering ~SANS!, small angle X-ray scattering ~SAXS!, and laser diffraction in colloidal science!. An alter-native way of microstructure characterization in suspen-sions includes cryomicroscopy. The microscopic techniques that are applied in this study are based on a series of methodological developments that have been undertaken over the last four years. The procedure starts with cryo-sample preparation based on high pressure freezing that was adapted from life sciences ~Zingg et al., 2008!. It further includes a novel high-resolution three-dimensional ~3D! microscopy technique using FIB ~FIB-nt; Holzer et al., 2004!. This technique has been adapted for cryoimaging ~Holzer et al., 2007!. Furthermore, extensive image analysis tech-niques have been developed specifically for accurate object recognition, for stereological correction of boundary trun-cation effects, and for subsequent quantifitrun-cation of the complex granular textures ~Münch et al., 2006!.
E
XPERIMENTALD
ETAILSThe entire quantification procedure consists of a series of delicate working steps: ~1! cryosample preparation, ~2! im-age acquisition by drift-corrected FIB serial sectioning, ~3! 3D reconstruction, ~4! binarization, ~5! object recognition, and ~6! extraction of quantitative parameters. The entire procedure must be considered as an “analytical chain,” and each individual working step represents an equally impor-tant segment within this chain. An error in each single working step will propagate into the final results. Unfortu-nately, it is very difficult to determine the degree of uncer-tainty of the individual working steps in the final results. Therefore, in this investigation we present three case studies of increasing complexity in order to isolate specific analyti-cal problems from the entire work flow.
In the first case study, the precision of 3D imaging with FIB is investigated. At high resolutions drift phenomena may result in irregular interlayer distances of the FIB serial sectioning. These irregularities in the acquired stack of images will impose distortions to the reconstructed 3D microstructures, which will induce an unknown error in the quantitative analysis of the FIB data. It shall be investigated to what extent the drift can be eliminated with an auto-mated drift correction procedure by analyzing a reference material with monosized nanoparticles.
Correct object recognition is a fundamental prerequisite for statistical particle analysis, which shall be addressed in the second case study. Particles with similar chemical compo-sition tend to have similar grayscale values in the FIB images, and therefore the interface between such objects is difficult to identify. To define the object boundaries between neighbor-ing particles in densely packed microstructures, a splittneighbor-ing algorithm ~Münch et al., 2006! has been introduced.
Unfor-tunately, there exist no strict physical laws or criteria for the degree of splitting. Therefore, a parametric investigation is performed to establish empirical criteria for determination of splitting parameters that result in realistic particle struc-tures. For this purpose FIB-nt analysis is performed on a sample of densely packed cement powder, and the FIB results are compared with light scattering experiments.
In the third case study, the entire procedure including cryopreparation, drift corrected FIB serial sectioning, and object recognition by splitting is applied to fresh cement suspensions. The cryoanalyses are performed with three different magnifications to test the overall reproducibility of the methodology at different resolutions. It is the aim of this article to demonstrate the potential of ~cryo! FIB-nt for reproducible particle analysis of granular materials and of complex cement suspensions, while paying attention to the limitations and uncertainties.
R
ESULTSCase Study 1: Precision of the FIB-nt
Serial Sectioning Procedure with
Integrated Drift Correction
FIB-nt is a rather novel 3D microscopy technique that was successfully applied in various materials science disciplines during the last few years ~Inkson et al., 2001; Holzer et al., 2004, 2006, 2007; Konrad et al., 2006; Münch et al., 2006; Uchic et al., 2006, 2007; Wilson et al., 2006; Holzapfel et al., 2007; McGrouther & Munroe, 2007; Velichko et al., 2007!. FIB-nt is based on a serial sectioning procedure with a dual beam FIB–scanning electron microscopy ~SEM! machine. Thin material layers are successively removed with the ion beam and simultaneously a set of electron images is ac-quired from the freshly exposed surfaces. In this way stacks with hundreds of two-dimensional ~2D! images can be produced from which the 3D microstructures are then reconstructed. For high resolution FIB-nt the thickness of the removed material layers in z-direction should be of a similar magnitude as the pixel resolution in the x-y-imaging plane, i.e., in the range between 10 and 50 nm. At such high magnifications it is a major challenge to keep the layer thickness constant during the entire serial sectioning exper-iment, which typically lasts for 12 to 24 h. During this time interval drift phenomena that are either caused by electro-magnetic or by mechanical instabilities can become signifi-cant. Drift rates that have been measured in our dual beam FIB ~FEI strata DB235! are typically in the range of 300 6 100 nm/h ~5 nm/min!. In the serial sectioning procedure, the duration for a single cycle of material erosion and image acquisition is approximately 4 min. Thus, displacements of approximately 20 nm have to be encountered during each cycle of erosion and imaging. This means that for high resolution FIB-nt the drift components are of a similar magnitude as the layer thickness. Consequently, significant
distortions must be expected in the final 3D reconstructions when drift is not corrected. In this context it is important to note that drift components in x- and y-directions ~i.e., parallel to the imaging plane! can be corrected by image correlation during the off-line image processing. In con-trast, drift components in z-direction perpendicular to the imaging plane cannot be corrected during off-line image processing. To compensate the z-drift components, an auto-mated on-line correction procedure has been developed that is based on recognition and repositioning of predefined reference marks ~Holzer et al., 2004!. Nevertheless, precise correction of the small drift displacements of only a few pixels is a challenging task, and the accuracy of the auto-mated correction procedures has not yet been documented. Therefore, in this case study the precision of the drift corrected FIB-nt is tested by analyzing a reference sample of monosized nanospheres.
Materials and Methods
The densely packed reference sample a1 was prepared by slow sedimentation of monosized SiO2 particles from a
dilute suspension in H2O. Subsequent drying of the
sedi-ment layer resulted in solidification of the sample. Further preparation steps included pressure impregnation at 200 bars with epoxy-resin, grinding, polishing, and Pt-coating. The impregnated sample a1 was then analyzed with FIB-nt at a magnification of 35k⫻, with an accelerating voltage of 5 kV and with spot size 3.
The specified diameters of the particles are 750 nm 6 100 nm ~www.focenter.com, ÅngströmSphere 750!. To vali-date the specified size range of the reference particles, 100
individual objects were analyzed with an ESEM XL30 FEG. In addition, laser granulometry ~LG! was performed using a Beckman Coulter LS 230 instrument with polarization in-tensity differential scattering. For data processing the Mie theory was applied as an optical model ~Jones, 2003!. The following refractive indices ~RI! were chosen from a data-base of the manufacturer: RI of real part ⫽ 1.56, RI of imaginary part⫽ 0.01, RI of dispersant ~isopropanol! ⫽ 1.3776.
Results and Discussion
The particle size distributions ~PSD! from FIB-nt, LG, and ESEM are plotted in Figure 1. Thereby, nearly all ESEM measurements from 100 individual SiO2particles fall within
a narrow size range between 650 and 720 nm, which is considered as the range of true particle diameters. The PSD curve from FIB analysis also covers a narrow size range between 650 and 720 nm that fits perfectly with the ESEM measurements. As shown in Figure 2, many particles are truncated at the boundary of the 3D volume from FIB. To circumvent problems related to the boundary truncation effects, the PSD from FIB-nt includes only the nontrun-cated particles and skips all objects that are trunnontrun-cated. This procedure is justified because the sample a1 has a very narrow PSD. ~Note: in case studies 2 and 3, a stereological boundary correction will be applied.! With respect to the image processing from FIB data, it is also important to note that uncertainties related to object recognition are negligi-ble with the chosen reference material. Due to the spherical shape, the correctness of segmentation and object recogni-tion can be controlled by screening through the segmented
Figure 1. Cumulative particle size distributions ~PSD! of monosized SiO2 spheres. Comparison of three different
techniques: FIB-nt, ESEM, and LG.
images and by checking whether the labeled particles have round shapes ~see Fig. 2!. Based on this procedure, correct object recognition can be confirmed for nearly all particles. Nevertheless, certain irregularities of the FIB image quality become apparent at a closer look. As documented in Figure 2b,c, the precision ~i.e., resolution and noise! of FIB data depends on the orientation of the orthogonal slices. In the original SEM images ~ x-y planes, Fig. 2b!, the particles appear to be perfectly round and sharp. In contrast in the
y-z plane ~Fig. 2c!, the particle boundaries are less sharp due
to noisy imperfections. These imperfections are interpreted as drift components in z-direction, which remain even after automated drift correction. These irregularities are then amplified during segmentation, object recognition, and reconstruction of 3D particle shape. As illustrated in Fig-ure 2e, the shapes of the reconstructed particles deviate strongly from perfectly spherical. Nevertheless, the compar-ison with the PSD from ESEM ~Fig. 1! indicates that this effect does not affect the measured particle volumes and the corresponding PSD from FIB-nt. For the present example, it can thus be concluded that only minor image defects remain in the drift corrected data from FIB serial section-ing. Thereby, different microstructural parameters have different sensitivities to these subtle imprecisions. Shape reconstructions of the individual particles are strongly affected by the remnant drift components. It is obvious that
these imprecisions would also propagate into the results of a surface area measurement from the same particles. In contrast for the same FIB analysis, the volumetric particle size measurements and the associated PSD are hardly af-fected by the image defects.
The results from LG for sample a1 indicate an unrealis-tically wide size distribution. Although the 50% fractile of 650 nm falls within the range of correct particle diameters, this method clearly overestimates the amount of particles below 600 nm and above 750 nm. Especially the 15 vol% measured for particles smaller than 400 nm must be consid-ered as an analytical error. It appears that LG is not a suitable method for particles in the sub-mm range. A possi-ble explanation is that light scattering is complicated by unusual effects in the case where particle diameters are of the same size ~or smaller! as the laser wavelength. The investigation of this phenomenon is beyond the scope of this article. Nevertheless, for sub-mm particles a similar effect is also observed in LG measurements of case study 2.
Case Study 2: Parametric Study for Reliable Object
Recognition in Densely Packed Microstructures
The quality of any microscopic particle analysis is directly related to the ability of identifying accurately the individual objects in the image data. In this case study, we are
address-Figure 2. FIB images from reference sample a1, which consists of monosized SiO2spheres. a: 3D reconstruction from
FIB-nt. b, c: BSE grayscale data with orthogonal slices in x-y and in y-z orientation. d, e: Same orthoslices after object recognition.
ing the issue of reliable object recognition in densely packed microstructures. In the electron images from FIB-nt, the neighboring particles usually exhibit a poor contrast be-tween each other ~Figs. 3a, 4a!, and therefore an accurate identification of individual grains is difficult. For this pur-pose an algorithm has been developed recently for object recognition in densely packed microstructures ~Münch et al., 2006!. With this algorithm the primary particles are isolated from multiparticle features in the binarized data ~after thresholding, see Fig. 3b! based on 3D geometrical criteria. The objects are separated from each other by successive particle erosion whereby splitting occurs at the concave necks. Whether or not an object with a given concavity is effectively split into two objects depends on the parameter k ~k僆 $0...1%!, which stands for the ratio between the neck
diameter and the particle width. In previous studies the k factor was chosen based on visual inspection of the result-ing particle structure for which a reasonable result is ob-tained. However, so far no quantitative criteria have been established for the correct determination of the k factor. For this purpose we are performing a parametric study on splitting and object recognition. Thereby a set of 3D particle structures is produced from a single FIB-nt volume by systematic variation of the k values. The resulting PSDs are then evaluated and compared with results from LG.
Materials and Methods
An intermediate cement grain size fraction ~s3! was sepa-rated from an ordinary portland cement ~OPC CEM I
Figure 3. Visualization of particle structures in sample s3 ~compacted cement grains! after splitting with different k
values. The individual objects are labeled with distinct colors. The 2D images arbitrarily represent slices nr 100 out of the serial sectioning stack from FIB-nt.
32.5R! by air classification with an Alpine MRZ2, using lower and upper rotation velocities of 10,000 and 15,000 min⫺1, respectively. The size distribution of the cement grain size fraction was determined by LG using a Beckman Coulter LS 230. The data from laser granulometry were processed according to the Mie theory with the following parameters: RI real part⫽ 1.56, RI imaginary part ⫽ 0.01, RI dispersant ~isopropanol!⫽ 1.3776. The resulting volume fractiles from LG are as follows: 10%⫽ 0.58 mm, 50% ⫽ 4.76 mm, 90%⫽ 8.79 mm.
For FIB analysis a sample with dense particle packing was prepared by compacting the air fractionated cement grain size fraction ~s3! at a moderate pressure in a small cylinder ~5 mm diameter, 10 mm height!. Subsequently the compacted sample was impregnated with wood’s metal ~Bi 50%, Pb 25%, Sn 12.5%, Cd 12.5%! at 708C and with pressures up to 3 kbars. The final preparation steps then included grinding, polishing, and C-coating. FIB-nt was then applied at a magnification of 10k⫻ ~with 5 kV and spot size 3!. Details of the FIB analysis are given in Table 1. After image alignment and segmentation into a mask with two phases ~solid and pore!, the splitting algorithms are applied to this mask repeatedly by increasing the k values from 0 to 1 in incremental steps of 0.1. In this way 11 data volumes with different particle structures are obtained ~Fig. 3!. The image data are then analyzed for three different
Figure 4. 3D reconstruction of particle structures in sample s3
from FIB-nt. Comparison of ~a, b! original BSE images with color labeled objects after splitting with ~c, d! a k value of 0.6. Note that the pores are impregnated with woods metal.
Ta b le 1 . C o mpilation o f 3 D D ata fr om FIB A nalysis V o xe l D imensions V o xe l M at ri x ~RO I! Dimensions of Data V o lume CS nr . S ample N ame and Sample Descr iption M ag nification k⫻ X ~nm ! Y ~nm ! Z ~nm ! Ø Siz e ~nm 3! X Y Z T otal 6~10 ! X ~m m ! Y ~m m ! Z ~m m ! T otal ~m m 3! 1 a1 M onosiz ed spher es 680 nm 35 8.48 10.76 18 11.8 461 355 171 27.99 3.91 3.82 3.08 46.0 2 s3 G rain siz e fr action o f O PC, dense packing 10 29.69 37.67 60 40.6 793 509 159 64.18 23.5 19.2 9.5 4 '307 3 c1 Suspension o f s3: w / z 0.5, 24 min 1 5 19.79 25.12 60 31.0 653 526 145 49.80 129 13.2 8.7 1 '486 3 c2 Suspension o f s3: w / z 0.5, 15 min 1 0 29.69 37.67 60 40.6 687 373 91 23.32 20.4 14.1 5.5 1 '565 3 c3 Suspension o f s3: w / z 0.5, 6.5 45.67 57.96 90 62.0 768 392 101 30.41 35.1 22.7 9.1 7 '244 No te : C S ⫽ case stud y, OPC ⫽ or dinar y por tland cement, w / c ⫽ w at ert oc em en tr at io ~g / g !,R O I⫽ ~cr opped ! re gi on of int er est.
microstructural parameters: particle numbers ~NV!, volume
fractions ~VV!, and surface area fractions ~SV!. For each of
these microstructural parameters, size-dependent curves are extracted that are termed PSD NV, PSD VV, and PSD SV,
respectively ~Figs. 5–7!. For this purpose each particle is attributed to a specific size class according to its volume equivalent radius. The three different curves are then ob-tained by either counting the number of particles in each
size class ~NV!or by measuring the corresponding volume
fractions ~VV!or the surface areas ~SV!.
Results and Discussion Qualitative Observations
Figure 3 qualitatively illustrates the effects of splitting with different k values. Each object is characterized with a
Figure 5. Quantification based on 3D FIB imaging: particle number densities ~PSD NV!of sample s3 after splitting with
different k values between 0 and 1. a: Shows the cumulative particle size distributions. b: Illustrates the cumulated particle numbers up to a maximum particle size ~0.5, 1, and 5 mm! as a function of increasing k values. The curves in b correspond to vertical profile lines in a.
specific color label. Before splitting all particles are intercon-nected with each other and therefore they form a single agglomerated object ~Fig. 3b!. When increasing the k value, the agglomerated particles are separated from each other successively. However, splitting is incomplete up to a k value of 0.3. Neighboring particles that are qualified intuitively as separate objects in the original grayscale image ~Fig. 3a! are still forming interconnected agglomerates in the particle structure that was split with k⫽ 0.3 ~Fig. 3d!. On the other hand, exaggerated fragmentation of distinct grains can be observed locally at k values above 0.8 ~Fig. 3f!. Based on the
visual inspection of the splitting results, realistic particle structures are expected for k values between 0.3 and 0.8 ~Fig. 3e!. Such a realistic 3D particle structure ~k⫽ 0.6! is also visualized in Figure 4.
Particle Number Density (NV)
Figure 5a shows a set of cumulative size distribution curves related to the particle number density ~PSD NV!. All
size distribution curves are dominated by numerous small particles in the size range below 1 mm. As a result of the
Figure 6. Quantification based on 3D FIB imaging: volume fractions ~PSD VV!of sample s3 for k values between 0
and 1. a: Shows the cumulative particle size distributions. PSD from LG is shown in gray. b: Illustrates the influence of increasing k values on the cumulated volume fractions up to a maximum particle size ~0.5, 1, 3, 5, and 10 mm!.
splitting with increasing k values from 0 to 1, the total particle numbers are increased by a factor of 7. This in-crease is particularly strong at the beginning of the splitting process, i.e., for low k values up to 0.3. As summarized in Table 2, the total particle number densities are changing from 77⫻ 106mm⫺3at k⫽ 0.0 to 454 ⫻ 106mm⫺3at k⫽
0.4. At higher k values the resulting particle numbers are less sensitive to further incremental changes of the k value, and the particle number densities only increase to 491⫻ 106 mm⫺3 at k ⫽ 0.8. The sensitivity of splitting with
different k values is better visualized in Figure 5b. Each curve in Figure 5b represents the cumulative particle
num-bers up to a specific particle diameter ~,0.5, ,1, ,5, and ,10 mm!, which corresponds to vertical profile lines in Figure 5a. At k values above 0.3, all curves in Figure 5b reach a plateau. This indicates that for all size classes the splitting is most effective at k values below 0.3. Above this value the particle numbers do not change significantly in any of the size classes.
Volume Fractions (VV)
The size distribution curves related to volumetric parti-cle size ~PSD VV!are shown in Figure 6a. In contrast to the
Figure 7. Quantification based on 3D FIB imaging: surface area fractions ~PSD SV! of sample s3. a: Shows the
cumulative particle size distributions. b: Surface area fractions cumulated up to a maximum particle size ~0.5, 1, 3, 5, 10 mm and total surface!. The bold curve represents the surface area that is formed at the interface between the splitted particles.
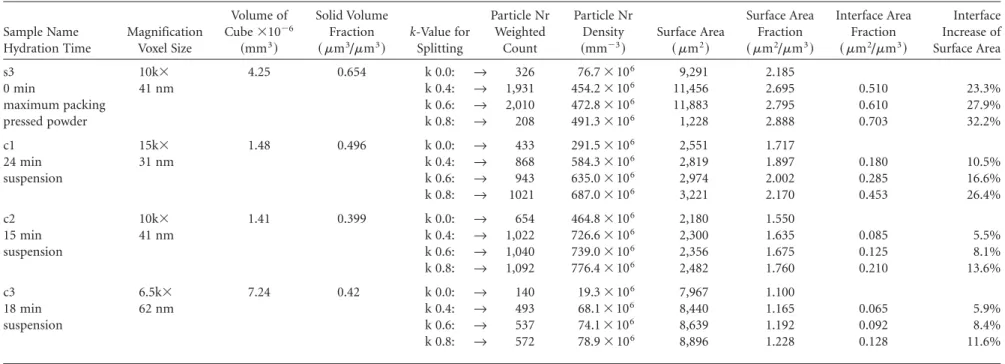
Table 2. Summary of Microstructural Data from Case Studies 2 and 3 Sample Name Hydration Time Magnification Voxel Size Volume of Cube⫻10⫺6 ~mm3! Solid Volume Fraction ~ mm3 /mm3! k-Value for Splitting Particle Nr Weighted Count Particle Nr Density ~mm⫺3! Surface Area ~ mm2! Surface Area Fraction ~ mm2 /mm3! Interface Area Fraction ~ mm2 /mm3! Interface Increase of Surface Area s3 10k⫻ 4.25 0.654 k 0.0: r 326 76.7⫻ 106 9,291 2.185 0 min 41 nm k 0.4: r 1,931 454.2⫻ 106 11,456 2.695 0.510 23.3% maximum packing k 0.6: r 2,010 472.8⫻ 106 11,883 2.795 0.610 27.9% pressed powder k 0.8: r 208 491.3⫻ 106 1,228 2.888 0.703 32.2% c1 15k⫻ 1.48 0.496 k 0.0: r 433 291.5⫻ 106 2,551 1.717 24 min 31 nm k 0.4: r 868 584.3⫻ 106 2,819 1.897 0.180 10.5% suspension k 0.6: r 943 635.0⫻ 106 2,974 2.002 0.285 16.6% k 0.8: r 1021 687.0⫻ 106 3,221 2.170 0.453 26.4% c2 10k⫻ 1.41 0.399 k 0.0: r 654 464.8⫻ 106 2,180 1.550 15 min 41 nm k 0.4: r 1,022 726.6⫻ 106 2,300 1.635 0.085 5.5% suspension k 0.6: r 1,040 739.0⫻ 106 2,356 1.675 0.125 8.1% k 0.8: r 1,092 776.4⫻ 106 2,482 1.760 0.210 13.6% c3 6.5k⫻ 7.24 0.42 k 0.0: r 140 19.3⫻ 106 7,967 1.100 18 min 62 nm k 0.4: r 493 68.1⫻ 106 8,440 1.165 0.065 5.9% suspension k 0.6: r 537 74.1⫻ 106 8,639 1.192 0.092 8.4% k 0.8: r 572 78.9⫻ 106 8,896 1.228 0.128 11.6%
Note: For all suspensions ~c1–c3! the water/cement ratio is 0.5 ~g/g!. This ratio corresponds to a theoretical solid volume fraction of 0.394 mm3 /mm3. 3D A nalysis of C o mple x Suspensions 139 . https://doi.org/10.1017/S1431927609090163 https:/www.cambridge.org/core
. University of Basel Library
, on
30 May 2017 at 16:24:49
particle numbers ~NV!, which are dominated by sub-mm
particles ~Fig. 5!, the volume fractions ~VV!are dominated
by the larger objects with diameters above 1 mm. The PSDs for low k values ~0.0 and 0.1! are characterized by step-like shapes. Each of these steps represents an agglomerated domain with unrealistically large particle diameters between 10 to 70 mm ~compare Fig. 3!. At k⫽ 0.5 all agglomerates that initially have been larger than 10 mm are now split into smaller constituents ~i.e., the steps disappear!. At higher k values between 0.5 and 1.0, the differences between the PSD curves become very small. The influence of changing k values on the particle volume fractions is also illustrated in Figure 6b. In each curve the particle volume is cumulated up to a maximum particle size ~,0.5, ,1, ,3, ,5, and ,10 mm!. For the sub-mm range, the cumulative volume fractions are always less than 5%. Thus, in contrast to the particle numbers ~NV, Fig. 5b!, the volume fractions ~VV,
Fig. 6b! of the small size classes are hardly increasing due to the splitting process.
To validate the results from particle splitting, the volu-metric PSDs ~VV! from FIB-nt are compared with LG in
Figure 6a. In the size range above 2 mm, LG shows very similar results as obtained with FIB-nt for k values between 0.5 and 0.8. However, for small particles the curve from LG apparently indicates that 17% of the particle volume should be attributed to the sub-mm range. In contrast, with FIB-nt only relatively small volume fractions between 2 and 4% are measured for the sub-mm range. To assess these differences, a visual inspection of the cement powder was performed with ESEM, which shows that the amount of sub-mm particles is clearly less than 5 vol%. The FIB data and the ESEM observations thus indicate that LG is systematically overestimating the volume of particles in the sub-mm range. A similar phenomenon was already observed in case study 1, which indicates that LG is not a suitable method for the analysis of particles smaller than 1 mm. Nevertheless, above 1 mm the results from both methods are compatible. Thereby, splitting with k values between 0.5 and 0.8 leads to very similar PSD curves for FIB-nt as for LG.
Surface Area (SV)
The third microstructural parameter of interest is the surface area that can be quantified based on a triangulation of the particle boundaries. The effects of splitting on surface area fractions ~SV!and the corresponding size distributions
~PSD SV! are shown in Figure 7. Before splitting the total
surface area is 2.19 mm2
/mm3. During the splitting process new interfaces are formed between the neighboring parti-cles that lead to an increase of the total surface area up to 3.07 mm2
/mm3. Overall, the size distributions related to the surface area ~Fig. 7a, PSD SV!show a similar pattern as the
volumetric size distributions ~Fig. 6a, PSD VV!, which are
both very sensitive to a change of k values at the beginning of the splitting, i.e., at low k values. All curves in Figure 7b exhibit a plateau for k values between 0.5 and 0.7. As
summarized in Table 2, the surface area fractions only slightly increase from 1.89 mm2
/mm3 at k⫽ 0.4 to 2.02 mm2
/mm3at k⫽ 0.6 and further to 2.17 mm2/mm3at k⫽ 0.8. Thus, in this range of k values also the surface areas are not sensitive to changes of the k values.
In conclusion, the visual inspection of the splitted microstructures confirms that a k value of 0.6 ~60.2! pro-duces realistic particle structures ~Figs. 3e, 4c,d!. The para-metric study with increasing degrees of splitting indicates that all microstructural parameters ~NV, VV, SV!are
insen-sitive to changes of the k values in the range between 0.5 to 0.7. Thus, splitting with a k value of 0.6 leads to stable and reproducible results of realistic particle structures. The reli-ability of a splitting with k⫽ 0.6 is also supported by LG that gives nearly identical PSDs for the size range above 1 mm. Thus, for the following cryoinvestigations in case study 3, a k value of 0.6 is used for object recognition.
Case Study 3: Reproducibility Test for Cryo-FIB-nt
and Influence of Magnification
Reproducibility is a major challenge for cryoinvestigations of complex suspensions. Thereby fractionation between the solid and liquid phases during sample preparation can be a major source of error that has a strong effect on volume fractions ~VV!and related microstructural parameters.
Ad-ditional problems during cryosample preparation are re-lated to freezing artifacts, which can destroy the entire particle structure. To maintain the true particle structure, the growth of ice crystals during freezing has to be sup-pressed. For this purpose the solution can be vitrified with high pressure freezing ~Bachmann & Mayer, 1987; Moor, 1987; Monaghan et al., 1998!. Because it is beyond the scope of this article to discuss the details of high pressure freezing and of cryoimaging, we are referring to previous publica-tions about cryo-FIB applicapublica-tions on cement suspensions ~Holzer et al., 2007; Zingg et al., 2008!. With the present case study, we intend to evaluate the methodological repro-ducibility of particle analysis based on cryo-FIB-nt. Thereby we also try to evaluate to what degree the resulting PSDs are influenced by changing magnifications.
Materials and Methods
To set up a suitable reproducibility test, the portland ce-ment system was simplified by removing the most reactive particles in the sub-mm range. Thereby, we used the same intermediate grain size fraction ~s3! of a portland cement as in the previous case study. With this grain size fraction, three identical suspensions ~c1, c2, and c3! were produced with a water-to-cement ratio of 0.5 ~g/g!. This ratio corre-sponds to a theoretical solid volume fraction ~VV!of 0.394
in the initial cement-water mixture, which should be identi-cal with the measured values from the cryosamples if the solid-liquid ratios are neither changed by chemical reac-tions nor by fractionation during sample preparation. The
suspensions were solidified with high pressure freezing after approximately 20 min ~c1: 24 min, c2: 15 min, c3: 18 min!. For the subsequent image acquisition with cryo-FIB-nt, the following working steps have been performed: freeze frac-turing, cryotransfer to the FIB, in situ deposition of a metal-organic layer and metalization of this layer with the ion beam, cube preparation, and drift corrected serial sec-tioning. The electron images were acquired with an acceler-ating voltage of 3 kV and with spot size 4. The suspensions were analyed at different magnifications ~s1: 15k⫻, s2: 10k⫻ and s3: 6.5k⫻! in order to check the influence of different resolutions on the resulting PSDs. The 3D particle structures obtained after stack alignment and background leveling are visualized in Figure 8. Subsequent data process-ing included binarization, object recognition by splittprocess-ing, compensation of boundary effects with the “specific correc-tion method” as described in Münch et al. ~2006!. In anal-ogy to the previous case study, three different size distribution curves are extracted from the FIB data that are related to volume fractions ~PSD VV, Fig. 9!, to particle number
densities ~PSD NV, Fig. 10!, and to surface area ~PSD SV,
Fig. 11!. According to the findings in case study 2, object recognition was performed with a splitting value of k⫽ 0.6.
Results and Discussion Volume Fractions (VV)
To identify potential solid-liquid fractionation effects during the cryosample preparation, we start the quantitative analysis with a comparison of the theoretical and the mea-sured solid volume fractions ~VV!. As illustrated in
Fig-ure 9a, the total solid volume fractions of samples c2 and c3 are 0.399 and 0.42, which is nearly identical with the theo-retical solid volume fraction of 0.394. Samples c2 and c3 are thus not affected by fractionation. In contrast for sample c1, the solid volume fraction of 0.496 clearly indicates an enrichment of solid particles relative to the liquid phase. Apart from the differences in the total solid volume frac-tions, the shapes of the curves in Figure 9a are very similar to each other. These similarities indicate that reproducibility of PSD measurements is good ~apart from fractionation!. The results are even better when the PSDs are normalized to the total solid volume ~⫽ 100%!, as shown in Figure 9b. Due to the normalization procedure, the fractionation ef-fect is eliminated from sample c1. Nevertheless, the PSD curve ~VV!of the fractionated sample c1 shows an irregular,
step-like shape for the largest particle size classes. Sample c1 was acquired with the highest magnification ~15k⫻!, and thus the analysis is based on the smallest data volume ~13⫻ 13⫻ 9 mm!. It appears that for such a small data volume the local enrichment of a few large particles can cause irregularities in the measured PSD. Thus, in sample c1 the observed increase in the solid-liquid ratio ~Fig. 9a! and the slight irregularities in the PSD ~Fig. 9b! can be attributed to problems of representativity at high magnifications.
Fig-ure 9b also shows that the PSD of the nonhydrated grain size fraction ~sample s3 from case study 2! is slightly shifted to smaller sizes compared to the hydrated suspensions ~c1–c3!. A possible reason for this shift might be particle cracking during sample preparation in a compressive cylinder.
Figure 8. Cryo-FIB-nt analyses from high pressure frozen cement
suspensions. a: Sample c1, 24 min hydration, 15k⫻ magnification.
b: Sample c2, 15 min hydration, 10k⫻ magnification. c: Sample
Particle Numbers (NV)
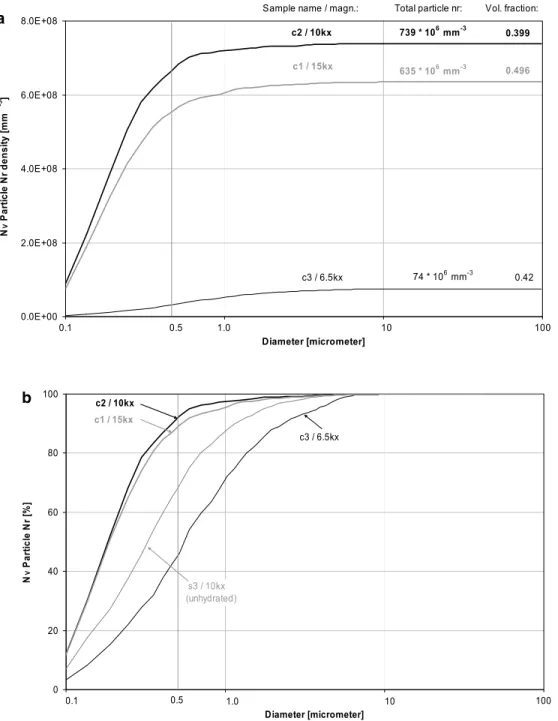
The size distribution curves related to particle numbers ~PSD NV! are illustrated in Figure 10a. The total particle
densities of samples c1 and c2 are similar to each other ~739 ⫻ 106 and 635 ⫻ 106 particles/mm3! whereas in
sample c3 the particle density is 10 times lower ~74⫻ 106
particles/mm3!. In Figure 10b the potential differences caused
by solid-liquid fractionation in sample c1 are eliminated by normalization to the total particle numbers ~⫽ 100%!. Thereby, the PSDs of samples c1 and c2 become nearly
identical. The differences between c1 and c2 in Figure 10a are thus attributed to the fractionation in c1. A characteris-tic feature of these two PSDs is the high amount of small particles. More than 90% of all objects in samples c1 and c2 have diameters smaller than 500 nm. In contrast in sample c3 the amount of small particles with diameters ,500 nm is only 45%. A possible reason for these diverging results may be different voxel resolutions. The volume of a voxel in sample c3 ~603 nm3! is eight times larger as in c1 ~303
nm3!. For example, a particle with a diameter of 200 nm
will be represented by 155 voxels in sample c1 ~magnitude
Figure 9. PSD results from cryo-FIB-nt. a: Shows the cumulative PSDs related to the solid volume fractions ~VV!. b: The PSDs are normalized to the total solid volume.
of 15k⫻! whereas the same particle is represented only by 20 voxels in sample c3 ~magnitude of 6.5k⫻!. During data processing objects as small as 20 voxels can easily fall below the threshold level or, in densely packed regions, these particles can be indistinguishably included into larger ag-glomerates from which they cannot be resolved during the subsequent splitting process. Thus, it is suggested that the numerous small hydration products that are certainly also present in the suspension of sample c3 cannot be detected due to the limited magnification and resolution. The large
numbers of small particles measured with higher magnifica-tions for samples c1 and c2 are attributed to the formation of new precipitates during the early hydration. It is impor-tant to note that this large number of particles ~90%! only represents 2–3% of the total solid volume ~see Figs. 8,9!. Figure 10b also shows the particle numbers of the un-hydrated sample s3 from case study 2. Compared to the suspensions c1 and c2, this sample contains only minor amounts of small particles ~,500 nm! because no hydra-tion reachydra-tions took place in the dry cement powder.
Figure 10. PSD results from cryo-FIB-nt. a: Shows the cumulative PSDs related to the particle numbers ~i.e., particle
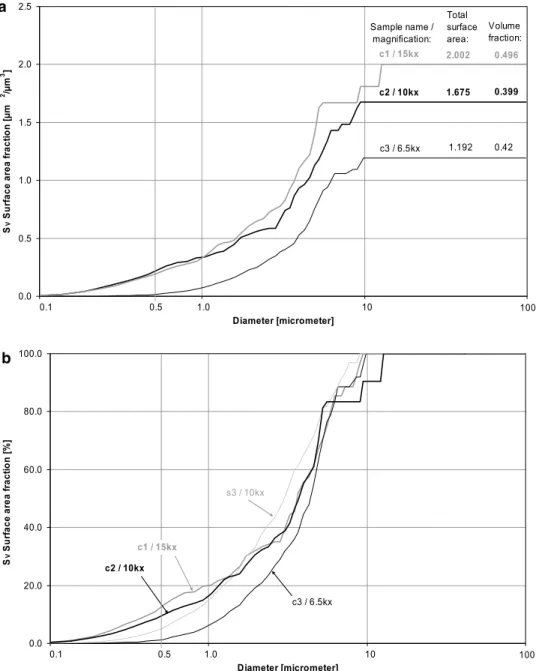
Surface Area (SV)
Size distribution curves related to the surface area ~PSD
SV!are shown in Figure 11a. Sample c1, which was
character-ized by an increased solid volume due to fractionation, also exhibits the highest surface area ~2.0 mm2
/mm3!. In sample c3 ~1.192 mm2
/mm3!, the surface area is lower than in c2 ~1.675 mm2
/mm3! although both samples have nearly the same total solid volume fractions. In sample c3 the contribu-tion of small particles ~sub-mm range! to the total surface area is relatively small. Thus, similar as for the particle num-bers ~NV!, it is also suggested for the surface area fractions
~SV! that the limited resolution of sample c3 leads to an
underestimation of the contribution from particles smaller than 500 nm. In contrast, the PSD curves from samples c1 and c2 are very similar to each other also for the particle size classes in the sub-mm range. These similarities become even clearer in Figure 11b, where the PSDs are normalized to the total surface area ~⫽ 100%! in order to remove fractionation effects in c1. Thereby in samples c1 and c2, the particles smaller than 500 nm ~i.e., 90% of the particles! contribute 10–15% of the total surface area. In contrast, in sample c3 the corresponding surface area fraction is only 1.3%. Obvi-ously, for sample c3 the resolution is not high enough to detect the fine-grained hydration products and hence the corresponding surface area is underestimated.
Figure 11. PSD results from cryo-FIB-nt. a: Shows the cumulative PSDs related to the surface area fractions ~SV!. b: The PSDs are normalized to the total surface area.
Overall, the results in case study 3 confirm a good reproducibility of our particle analysis procedure with cryo-FIB-nt. Nevertheless, the resolution has to be optimized according to the particle size. If the magnification is chosen too high, then the analysis will not be representative ~sam-ple c1!. This may lead to apparent fractionations of the solid-liquid ratio caused by local heterogeneities of the microstructure. On the other hand, if the magnification is chosen too low, this may lead to an underestimation of the small particles ~in PSD NV! and of the corresponding
surface areas ~in PSD SV!.
D
ISCUSSIONReliable particle analysis from complex granular microstruc-tures requires careful evaluation of potential sources of error. For particle analysis with cryo-FIB-nt, the main un-certainties are related to solid-liquid fractionation during sample preparation of suspensions, to drift artifacts during image acquisition and to problems of object recognition during data processing:
Cryosample Preparation
The transfer of small droplets of a suspension into the sample carriers is one of the main potential sources of error in the entire work flow. Thereby fractionation of the solid to liquid ratio can be caused due to the high surface tension of water. Such a fractionation will affect not only the primitive microstructural parameters such as volumetric PSD ~VV!
and particle number densities ~NV!, but also higher order
topological parameters such as contact numbers and coor-dination numbers. Determination of these latter parameters is one of the long-term targets of 3D particle analysis in suspensions, because these parameters can be linked di-rectly with physical models of colloidal stability and with macroscopic flow properties ~as discussed in the Introduc-tion!. Hence, fractionation and also other freezing artifacts during sample preparation must be avoided. Unfortunately, potential effects of fractionation on the overall reproducibil-ity can only be identified by repetitive analyses. In case study 3, cryo-FIB analyses of a cement suspension were performed three times. Overall a good reproducibility of the results can be confirmed. The fractionation in sample c1 can be attributed to a local enrichment of large particles that represents a short range heterogeneity at length scales between 10 to 100 mm. Such a local enrichment is consid-ered to represent a true microstructural phenomenon that is formed during particle agglomeration in the suspension. The apparent fractionation in sample c1 is thus not attrib-uted to artifacts of sample preparation but rather to prob-lems of representativity caused by a small volume of the FIB analysis at high magnifications. Nevertheless, in future cryo-investigations the suppression of fractionation effects will need special attention to prove reproducibility.
Image Acquisition
Serial sectioning with FIB-nt is always accompanied by drift phenomena that become more serious at increasing magni-fication. For this purpose automated drift correction proce-dures are implemented in the FIB-nt serial sectioning. Nevertheless, in case study 1 it is shown that some irregular drift components in z-direction can remain in the image data even after drift correction. This is the case for FIB-nt analyses at high magnification with voxel resolutions ,20 nm. The irregularities caused by remnant drift com-ponents have strong effects on shape reconstruction of individual particles and corresponding surface triangula-tion. During quantification these phenomena have negligi-ble effects on volumetric particle size distributions ~PSD
VV!, but they are strongly affecting surface area
measure-ments ~SV!.
Data Processing
Reliability of any PSD measurement is directly linked to the accuracy of object recognition. This issue was evaluated in case study 2. Specific splitting algorithms ~Münch et al., 2006! open new possibilities to identify the individual par-ticles even from densely packed microstructures. In case study 3, quantitative criteria are presented which document that the splitting with a k-value of 0.6 leads to reproducible and reliable particle recognition in FIB data with cement particles. In this context it has to be emphasized that the splitting algorithm works well for microstructures where the particle contacts are characterized by concave shapes. However, the splitting may fail when small particles are attached on the surface of larger particles and thereby forming “flat” contact geometries that are not concave. Hence, the contribution of small particles to the measured PSDs of particle numbers ~NV!and of surface area ~SV!is
to some degree uncertain because the identification of these particles is difficult. Thereby, sufficient resolution plays a major role. For example, in sample c3 ~case study 3!, the particle numbers of size classes with diameters ,500 nm and associated surface area fractions ~SV!are strongly
un-derestimated due to the insufficient resolution at a magnifi-cation of 6.5k⫻. In contrast the results for volumetric particle size and the corresponding PSD ~VV!are less
sensi-tive to resolution and magnification.
C
ONCLUSIONSIn spite of all the analytical problems discussed in this arti-cle, it can be concluded that the methodological cryo-FIB procedure, which was built up over the last few years, en-ables a reproducible microstructural characterization of com-plex cement suspensions, if the analyses are performed carefully and if the size distribution is not too wide. The reproducible quantification of volume fractions, particle
numbers, and surface areas is considered as a basis for future investigations of higher order topological parameters such as number of contacts and related interfacial areas. The reli-able quantification of these parameters opens new possibili-ties to study the relationship between microscopic particle structures and macroscopic rheological properties of com-plex suspensions and to investigate the effects of agglomera-tion, dispersion, and hydration on a microstructural level.
A
CKNOWLEDGMENTSThe authors would like to thank Philippe Gasser, Martin Müller, Andreas Käch, and Roger Wepf from EMEZ at ETH Zürich and Anatol Zingg from Empa Dübendorf for their contributions to the setup of the cryoprocedure. Robert Flatt ~Sika SA! is thanked for helpful discussions and Markus Wegmann ~Sulzer Innotec AG! for providing the reference sample a1.
R
EFER ENCESBachmann, L. & Mayer, E. ~1987!. Physics of water and ice: Implications for cryofixation. In Cryotechniques in Biological Electron Microscopy, Steinbrecht, R.A. & Zierold, K. ~Eds.!, pp. 3–34. Berlin: Springer Press.
Flatt, R. & Bowen, P. ~2006!. Yodel: A yield stress model for suspensions. J Am Ceram Soc 89, 1244–1256.
Goodwin, J. ~2004!. Colloids and Interfaces with Surfactants and Polymers. Hoboken, NJ: Wiley Press.
Holzapfel, C., Schaef, W., Marx, M., Vehoff, H. & Muecklich, F. ~2007!. Interaction of cracks with precipitates and grain boundaries: Understanding crack growth mechanisms through focused ion beam tomography. Scripta Mater 56, 697–700. Holzer, L., Gasser, P., Kaech, A., Wegmann, M., Zingg, A.,
Wepf, R. & Münch, B. ~2007!. Cryo-FIB-nanotomography for quantitative analysis of particle structures in cement suspen-sions. J Microsc 227, 216–228.
Holzer, L., Indutnyi, F., Gasser, P., Münch, B. & Wegmann, M. ~2004!. 3D analysis of porous BaTiO3 ceramics using FIB
nanotomography. J Microsc 216, 84–95.
Holzer, L., Münch, B., Wegmann, M., Gasser, P. & Flatt, R. ~2006!. FIB-nanotomography of particulate systems—Part I:
Particle shape and topology of interfaces. J Am Ceram Soc 89, 2577–2585.
Inkson, B.J., Mulvihill, M. & Möbus, G. ~2001!. 3D determina-tion of grain shape in a FeAl-based nanocomposite by 3D FIB tomography. Scripta Mater 45, 753–758.
Jones, R.M. ~2003!. Particle size analysis by laser diffraction: ISO13320, standard operating procedures and Mie theory. Am Lab 35, 44–47.
Konrad, J., Zaefferer, S. & Raabe, D. ~2006!. Investigation of orientation gradients around a hard Laves particle in a warm-rolled Fe3Al-based alloy using a 3D EBSD-FIB technique. Acta Mater 54, 1369–1380.
McGrouther, D. & Munroe, P.R. ~2007!. Imaging and analysis of 3-D structure using dual beam FIB. Microsc Res Techn 70, 186–194.
Monaghan, P., Perushinghe, N. & Müller, M. ~1998!. High pressure freezing for immunocytochemistry. J Microsc 192, 248–258.
Moor, H. ~1987!. Theory and practice of high pressure freezing. In Cryotechniques in Biological Electron Microscopy, Steinbrecht, R.A. & Zierold, K. ~Eds.!, pp. 175–191. Berlin: Springer Press. Münch, B., Gasser, P., Flatt, R. & Holzer, L. ~2006!.
FIB-nanotomography of particulate systems—Part II: Particle rec-ognition and effect of boundary truncation. J Am Ceram Soc
89, 2586–2595.
Russel, W.B., Saville, D.A. & Schowater, W.R. ~1989!. Colloidal Dispersions. Cambridge, UK: Cambridge University Press. Suzuki, M. & Oshima, T. ~1983!. Estimation of the coordination
number in a multi-component mixture of spheres. Powder Technol 35, 159–166.
Uchic, M.D., Groeber, M.A., Dimiduk, D.M. & Simmons, J.P. ~2006!. 3D microstructural characterization of nickel superal-loys via serial-sectioning using a dual beam FIB-SEM. Scipta Mater 55, 23–28.
Uchic, M.D., Holzer, L., Inkson, B.J., Principe, E.L. & Munroe, P. ~2007!. 3D microstructural characterization using focused ion beam tomography. MRS Bull 32, 408–416.
Velichko, A., Holzapfel, C. & Mücklich, F. ~2007!. 3D charac-terization of graphite morphologies in cast iron. Adv Eng Mat
9, 39–45.
Wilson, J.R., Kopsiriphat, W., Mendoza, R., Chen, H.Y., Hiller, J.M., Thornton, K., Voorhees, P.W., Adler, S.B. & Barnett, S.A. ~2006!. Three-dimensional reconstruction of a solid-oxide fuel-cell anode. Nat Mater 5, 541–544.
Zingg, A., Holzer, L., Kaech, A., Winnefeld, F., Pakusch, J., Becker, S. & Gauckler, L. ~2008!. The microstructure of dispersed and nondispersed fresh cement pastes—New insight by cryo-microscopy. Cem Concr Res 38, 522–529.