Journal of Gerontology:MEDICAL SCIENCES Copyright 2000 by The Gerontological Society of America
2000, Vol. 55A, No. 9, M508–M515
M508
Prognosis of Functional Recovery
1 Year After Hip Fracture: Typical Patient Profiles
Through Cluster Analysis
Jean-Pierre Michel,
1Pierre Hoffmeyer,
2Claude Klopfenstein,
3Michel Bruchez,
4Bernard Grab,
1and Christian Lalive d’Epinay
51Department of Geriatrics, Divisions of 2Orthopedics and 3Anesthesiology, University Hospitals of Geneva, Switzerland. 4Department of Geriatrics, District Hospital of Sierre, Switzerland.
5Department of Sociology and Center for Interdisciplinary Gerontology, University of Geneva, Switzerland.
Background. Many investigators have identified distinct medical, demographic and psychosocial prefracture condi-tions that influence the functional outcome of patients surgically treated for a fracture of the hip. However, to design ef-ficient intervention care programs addressing the needs of these patients, at optimal economic and social costs, more information is required on the typical combinations of prognostic determinants actually encountered.
Methods. Data on specific descriptors of the prefracture status and on mobility and functioning 1 year after surgical intervention were collected by interview from 253 consecutive patients hospitalized for a fracture of the proximal femur. Cluster analysis was used to form homogeneous groups of patients with similar profiles in terms of the 13 predictive variables and the 7 outcome variables significantly interrelated. The modeling procedure generated four clusters of pa-tients with a typical profile sharply contrasted by their structure.
Results. Subjects of two clusters could walk without difficulty and were functionally independent prior to their hip fracture. One year later, however, mobility and functioning were only fully recovered by the members of one cluster. The majority of predictors were of less favorable prognostic value for the members of the second cluster. The other two clusters regrouped patients with impaired prefracture mobility that were either unaltered or even aggravated 1 year later.
Conclusions. Cluster analysis identified typical profiles of elderly hip fracture patients. Close scrutiny of their re-spective global structure, in terms of combined prognostic determinants and outcomes, may help to develop specific management strategies that are more efficiently adapted to these different groups of patients.
fracture of the proximal femur is the most dramatic consequence of osteoporosis in terms of disability, mortality, and hospital and institutional care (1). With the increasing proportion of older people in the general popula-tion, fractures of the hip are becoming a major public health problem (2). Many investigators have studied hip fracture patients hospitalized for surgical treatment and identified various predictors of functional recovery at different post-discharge times (3–12).
In the conventional research approach, patient character-istics significantly associated with a given outcome are identified through bivariate or multivariate analyses. The same statistical procedures are repeated to recognize predic-tors of any other outcome variable. This means that al-though the prognosis is multifactorial when several out-come indicators are involved, the standard analyses can only separately estimate the independent prognostic determi-nants significantly correlated to each outcome of reference, but do not allow the simultaneous estimation of all predictive variables for a combination of outcome measures.
However, the development of appropriate and efficient prevention, intervention, and rehabilitation programs needs to identify groups of patients characterized by common health conditions, as well as demographic and
socioeco-nomic features that are liable to benefit from such treatment. A more holistic approach is therefore required to create spe-cific categories that differentiate patients into groups with similar prefracture and follow-up characteristics.
In this study, we attempt to classify older patients with a hip fracture according to clearly identified prefracture pro-files associated with their overall outcome, as evaluated by measuring a number of critical indicators at the end of a 1-year follow-up period.
METHODS
Patients
This prospective longitudinal study included 253 consec-utive patients aged 65 years or older with a fracture of the proximal femur admitted to the Geneva University Hospital and the District Hospitals of Sion, Sierre, and Monthey, Switzerland in 1995. Data were collected through structured questionnaires administered in an interview with the patient (assisted by a proxy when necessary) during the first week of hospitalization and, subsequently, at 3 months and 1 year after surgical intervention. Five subjects refused the second or third interview and contact was lost with five other sub-jects. An additional 36 patients died during the year of
fol-A
REHABILITATION AFTER HIP FRACTURE: PATIENT PROFILES M509
low-up, leaving 207 patients for evaluation of functional restoration 1 year after hip fracture.
Outcome Variables
Seven variables evaluated at 1-year follow-up were used for the assessment of functional rehabilitation (Appendix 1). Some of these outcome variables reflect the patient’s status at time of observation, whereas others assess the relative change that occurred during the year of follow-up. Mortality during the period of observation is another important out-come of posthospital discharge, and that evaluation will be treated separately.
Predictive Variables
The independent variables included in this study (Appen-dix 2) are the 20 descriptors of the prefracture status that re-vealed to be significantly correlated to at least one of the seven outcome variables assessed for all the patients who survived 1 year. Gender was not a predictor of the outcome variables assessed for the 1-year postdischarge survivors, but was significantly correlated to mortality during the fol-low-up period of observation.
Statistical Analysis
All the data collected were computerized and processed with programs provided by the Statistical Package for the Social Sciences (SPSS Inc, Chicago, IL) (13).
The statistical procedure called “cluster analysis” was used to form homogeneous groups of patients with similar profiles in terms of both independent and dependent ob-served variables. With this technique, cases are grouped on the basis of their closeness. The combined measure of dis-tance over all of the variables was the squared Euclidean distance based on the standardized variables. The method used to form clusters was the agglomerate hierarchical clus-tering, and the complete linkage or furthest neighbor tech-nique was applied to determine which cases or clusters should be combined at each step.
Because the component of the overall heterogeneity at-tributable to the within-cluster variability decreases with di-minishing cluster size, smaller groups will include more ho-mogeneous and typical patients, and the between-cluster variability will constitute the largest part of the remaining heterogeneity. However, because the number and size of clusters are inversely related for a population of given di-mension, empirical criteria need to be considered in fixing the number of procedure steps, so that a useful and conclu-sive interpretation can be made on distinctive typological categories of patients representative of the population under review.
The variables selected to serve as the basis for cluster for-mation were all the outcomes measured at the end of the fol-low-up period and their predictors that were significantly identified through multivariate analysis. In bivariate analy-ses, statistical significance was tested using the following: (i) the chi-square test or the Fisher’s exact probability test, when both categorical variables were dichotomized; (ii) the Mantel-Haenszel chi-square analysis to test the linear associ-ation between two ordinal variables; (iii) the Pearson corre-lation coefficient when both variables were continuous; and
(iv) the analysis of variance to test the association between a nominal or ordinal variable and a continuous variable.
Stepwise multiple linear regression analysis was used to determine the independent variables with statistically sig-nificant joint impact on the ordinal or continuous outcome variables, whereas the relationship of predictive variables to dichotomized outcomes was established through stepwise multiple logistic regression. Logarithm transformation was applied to the length of hospital stay to normalize the distri-bution.
All reported p values are two-tailed, and the null hypothe-sis of no difference was rejected at a p level of ⬍.05.
RESULTS
Construction of the Typological Model
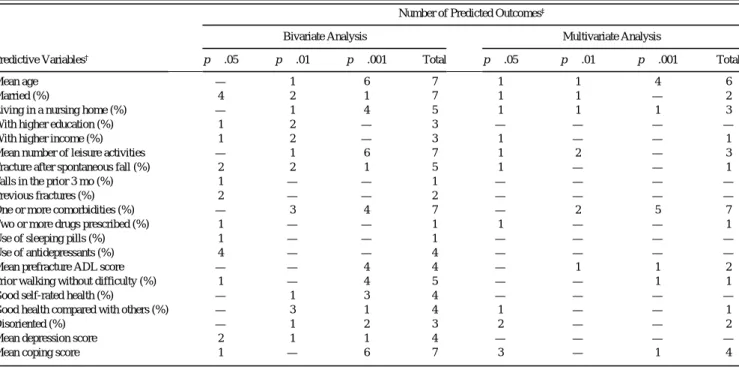
As shown in Table 1, five independent variables (age, marital status, leisure activities, comorbidity, and coping at-titude) were significant predictors of all the seven outcomes according to the bivariate analysis. Three other variables were markers of five outcomes, but the majority were pre-dictors of only three or four outcomes. Because many of the independent variables were strongly correlated, seven of the latter were not retained by the multivariate analysis. Comor-bidity and age were the most powerful predictors and were significantly associated with seven and six outcomes, re-spectively. The other 11 independent variables were simul-taneously associated with no more than one to four out-comes.
Conversely, the number of independent variables that were significant predictors of outcome is displayed in Table 2. The bivariate analysis showed that five outcomes were predicted by at least half of the 20 independent variables in-cluded in the model. After elimination of redundancy due to correlation between independent variables, the multivariate analysis indicated that the activities of daily living (ADL) score, the number of hospital days in the follow-up year, and walking ability appeared to be the outcomes signifi-cantly predicted by the largest number of prefracture char-acteristics (respectively, eight, seven, and six independent variables). The selected variables included in the cluster analysis were the 13 predictive variables retained by the multivariate approach among those listed in Table 1 and the seven predicted outcomes listed in Table 2.
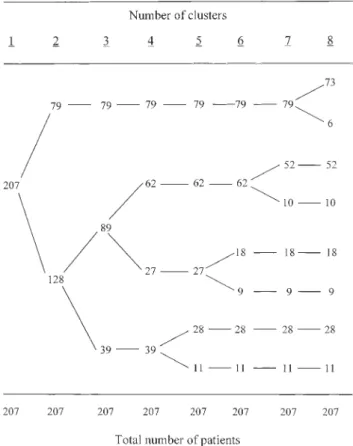
The relationship between the number and size of clusters at successive forming steps is displayed in Figure 1. The first subdivision of the total population (n⫽ 207) created a typological model consisting of an extremely homogeneous cluster (n⫽ 79) that would not break up until the seventh forming step. The second cluster (n⫽ 128) was sufficiently heterogeneous to already subdivide at the second step into a small group of 39 patients and a larger one (n⫽ 89), which generated at the third forming step two more homogeneous and stable clusters of 62 and 27 subjects, respectively. The next step of the procedure affected only the smaller of the two clusters that was created at the second step (n⫽ 39) and resulted in a fifth group of no more than 11 patients (5% of the total study population). Therefore, the analysis and dis-cussion will concentrate on the findings of the typological model with four clusters.
M510 MICHEL ET AL.
Typical Patient Profiles
The profile of the total study population (Table 3) is char-acterized by the 20 variables predictive of at least one of the seven outcome measures evaluated at the end of the follow-up period, plus one additional variable (gender) that ap-peared to be a significant predictor of survival. The propor-tion of men was only 12.6% among the survivors, but reached 30.6% among those who did not survive. Those pa-tients who died during the 1-year follow-up had signifi-cantly diminished prefracture leisure activities, increased disorientation, more comorbidities, greater use of drugs, and unfavorable levels of prefracture ADL scores and relative perceived health. These were all significant predictors of mortality.
The overall profile of the survivors (Table 3, column 2)
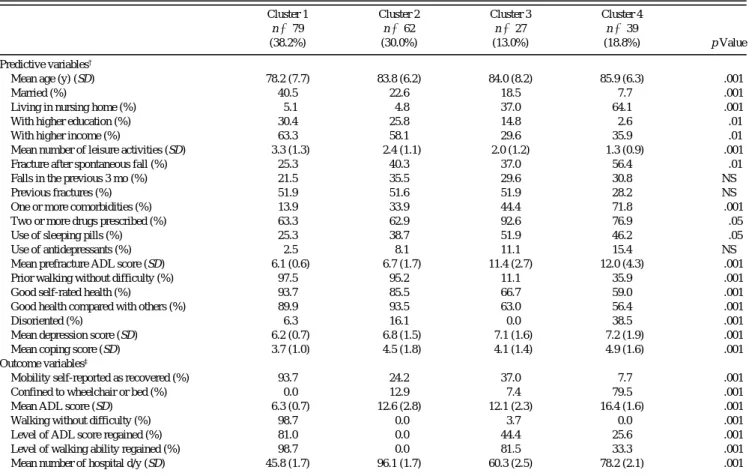
covers the seven outcome indicators evaluated at 1-year fol-low-up. In Table 4, we see the profiles of the typological categories resulting from the breakdown through cluster analysis of the survivors into four homogeneous groups. In terms of recovery prognosis, the best combined pattern of both predictive and outcome variables characterizes the first and largest cluster (cluster 1), grouping almost 40% of the surveyed patients. Out of the 79 members of this cluster, 77 (97.5%) could walk without difficulty before hip fracture and 78 (98.7%) 1 year later, with no patient having been confined to wheelchair or bed. Practically all patients were functionally independent prior to hospitalization for their hip fracture (ADL score of 6.1) as well as at the end of the follow-up period (ADL score of 6.3). Only 5% of these pa-tients had been residing in a nursing home, and in only 10% Table 1. Significant Predictors of One or More Outcomes Recognized by Bivariate and Multivariate Analyses
Predictive Variables†
Number of Predicted Outcomes‡
Bivariate Analysis Multivariate Analysis
p ⬍ .05 p ⬍ .01 p ⬍ .001 Total p ⬍ .05 p ⬍ .01 p ⬍ .001 Total
Mean age — 1 6 7 1 1 4 6
Married (%) 4 2 1 7 1 1 — 2
Living in a nursing home (%) — 1 4 5 1 1 1 3
With higher education (%) 1 2 — 3 — — — —
With higher income (%) 1 2 — 3 1 — — 1
Mean number of leisure activities — 1 6 7 1 2 — 3
Fracture after spontaneous fall (%) 2 2 1 5 1 — — 1
Falls in the prior 3 mo (%) 1 — — 1 — — — —
Previous fractures (%) 2 — — 2 — — — —
One or more comorbidities (%) — 3 4 7 — 2 5 7
Two or more drugs prescribed (%) 1 — — 1 1 — — 1
Use of sleeping pills (%) 1 — — 1 — — — —
Use of antidepressants (%) 4 — — 4 — — — —
Mean prefracture ADL score — — 4 4 — 1 1 2
Prior walking without difficulty (%) 1 — 4 5 — — 1 1
Good self-rated health (%) — 1 3 4 — — — —
Good health compared with others (%) — 3 1 4 1 — — 1
Disoriented (%) — 1 2 3 2 — — 2
Mean depression score 2 1 1 4 — — — —
Mean coping score 1 — 6 7 3 — 1 4
Note: ADL ⫽ activities of daily living. †Evaluated at admission in the study.
‡Out of seven outcome measures evaluated after 1-y follow-up (listed in Table 2).
Table 2. Number of Significant Predictors for Each Outcome Recognized by Bivariate and Multivariate Analyses Number of Predictors‡
Bivariate Analysis Multivariate Analysis
Predicted Outcomes† p ⬍ .05 p ⬍ .01 p ⬍ .001 Total p ⬍ .05 p ⬍ .01 p ⬍ .001 Total
Mobility self-reported as recovered (%) 4 3 6 13 — 1 — 1
Confined to wheelchair or bed (%) 5 2 8 15 1 2 1 4
Mean ADL score 2 4 11 17 4 1 3 8
Walking without difficulty (%) 2 4 11 17 3 1 2 6
Level of ADL score regained (%) 1 1 3 5 1 — 3 4
Level of walking ability regained (%) 4 2 1 7 1 — 3 4
Mean number of hospital d/y 3 4 3 10 3 3 1 7
Note: ADL ⫽ activities of daily living. †Evaluated after 1-y follow-up.
REHABILITATION AFTER HIP FRACTURE: PATIENT PROFILES M511
of cases was the prefracture health status perceived as not good. On average, they did not stay more than 1-1/2 months (45.8 days per patient) in hospitals during the follow-up year.
The second cluster, almost one third of the subjects, ap-pears in some respects quite similar to the first one with good prognostic values for essential features like prefracture capac-ity to walk (95.2% walking without difficulty), functional in-dependence (ADL score of 6.7), self-rated health as good (85.5%), and place of residence (only 4.8% with residence in nursing home). However, in spite of these similarities, the outcome of cluster 2 was particularly unfavorable. There was not one patient who could walk again without difficulty, and 13% of the cluster members were confined to a wheelchair or bed. Their mean ADL score was still as high as 12.6, and they stayed, on average, more than 3 months in hospitals during the follow-up period. In sharp contrast with cluster 1, no member of cluster 2 effectively regained his or her level of functional autonomy, including walking ability. Further scru-tiny of the profiles of the first two clusters shows that, apart from those mentioned above, the majority of predictors were of less favorable prognostic value for the second cluster. In particular, members of cluster 2 were older, more prone to falls, more frequently sustained a hip fracture after a sponta-neous fall, had a higher number of comorbidities, and about half as many were married.
The remaining two clusters, or one third of the surviving patients, represent the older patients with very low potential
for recovery. Cluster 4, 19% of the subjects, is particularly typical in this regard. With a mean age of 86 years, almost two thirds were living in a nursing home prior to fracture, more than 50% sustained their hip fracture after a spontane-ous fall, 72% presented comorbid problems, practically 40% were disoriented, and the same proportion had poor opinion of their health status. They also had the most unfa-vorable mean scores for depression and coping strategy, and less than 8% were still married. Although one third of these patients (35.9%) could walk without difficulty prior to the hip fracture, none recovered total ambulatory capacity 1 year later, and 80% of them were confined to a wheelchair or bed. Furthermore, the levels of their mean ADL score show that functionally they were already seriously depen-dent before hip fracture (12.0) and almost completely de-pendent at the end of the follow-up period (16.4).
Cluster 3 is the smallest cluster (13%) and presents some profile similarities with cluster 2. However, similar to clus-ter 4, it is essentially characclus-terized by a reduced prefracture functional independence (mean ADL score of 11.4) and a low proportion of patients (11.1%) able to walk without dif-ficulty. One year later, only 1 out of 27 patients (3.7%) could again walk without difficulty, but no more than 2 (7.4%) were actually confined to a wheelchair or bed. The mean ADL score had not worsened, remaining close to the relatively poor prefracture level (12.1).
In spite of the poor recovery performances of members of clusters 3 and 4, a substantial proportion regained their pfracture levels of ADL score and walking ability. This re-flects the fact that the majority of these patients were al-ready functionally dependent before their hip fracture and remained so after the surgical intervention. The gradient changes from cluster 1 to cluster 4, in values of predictive and outcome variables, express prognostic deterioration, with the most unfavorable levels for cluster 4. Overall changes in ambulatory mobility and functional indepen-dence are schematically summarized for each cluster in Ta-ble 5.
DISCUSSION
The costs of hip fractures include direct financial costs for acute treatment and long-term care, as well as the consump-tion of society’s resources for the management of this often devastating injury. These costs are already considerable and will increase dramatically in the near future. In a report by Cooper and his associates (14), it was estimated that the num-ber of hip fractures occurring in the world would increase from the 1.66 million noted in 1990, to 6.26 million by the year 2050. This is almost a fourfold increase and will of course become a global problem requiring adaptive preven-tive strategies from the health services concerned.
The acute management of this injury is usually without debate because of the painful and completely disabling na-ture of a fracna-ture of the hip; surgical intervention is re-quired. Even in cases where family and physician see little potential for functional recovery, surgery is ethically indi-cated for relief of pain, mobilization out of bed, and nursing care. Such treatment requires limited-term resources, that is, a brief period of acute hospitalization and surgery and then a return to long-term care.
M512 MICHEL ET AL.
There are, however, a number of patients who can benefit from a more aggressive approach following surgery in terms of an active well-structured rehabilitation program. These are the elderly persons who are functionally indepen-dent prior to their fracture and who have the potential and ability to return to such an existence. Methods and guide-lines are needed to help identify this group of patients, be-cause we do not have sufficient resources to provide all pa-tients with such a program. A study by Jensen and his associates (15) of 518 patients with a fracture of the hip fol-lowed for 6 months, noted use of 17% of the total number of hospital beds for orthopedic surgery in an area of 500,000 inhabitants. The total rehabilitation course was longest for the most dependent patients. They concluded that the goal in treatment of hip fractures in elderly persons is to apply the method with the smallest consumption of resources that leads to the safest technical results, while maintaining the social and functional independence of the patients to the maximum degree possible.
In our preliminary study, we have tried to determine which groups of patients would most benefit from func-tional rehabilitation postsurgery. The convenfunc-tional method-ological evaluation approaches have largely contributed to
the identification of individual predictors. However, further knowledge is needed on the structure of typical patient groups in terms of combination of predictive and outcome variables. As a first step in this direction, we submitted our population to an appropriate cluster analysis and generated a typological model with four different patient categories characterized by highly contrasting patterns. The consider-able underlying heterogeneity of the investigated population is easily put in evidence by a comparison of the overall sur-vivors’ profile (Table 3, column 2) with the corresponding profiles of the four typical components of the surviving population (Table 4). More than two thirds of the subjects were members of the first two clusters. They were all func-tionally independent and able to walk without difficulty prior to hip fracture, were still living in their private home, and had a good perceived feeling of their health status. However, the outcome pictures of the two clusters differ to-tally. After a 1-year follow-up, members of the first cluster (38% of the total sample) had recovered their walking ca-pacity and functional independence, but not those of the second cluster. Precisely distinguishing these two types of patients is of paramount importance for the establishment of efficient intervention programs, and further research is Table 3. Profile of Hip Fracture Patients According to Potential Predictors of Outcomes
Total N⫽ 243 (100.0%) 1 y Survivors n⫽ 207 (85.2%) Dead at 1 y n⫽ 36 (14.8%) p Value Predictive variables† (1) (2) (3)
Mean age (y) (SD) 82.3 (7.7) 82.1 (7.7) 83.6 (7.7) NS
Married (%) 24.3 26.1 13.9 NS
Men (%) 15.2 12.6 30.6 ⬍.01
Living in nursing home (%) 22.2 20.3 33.3 NS
With higher education (%) 21.8 21.7 22.2 NS
With higher income (%) 51.4 52.2 47.2 NS
Mean number of leisure activities (SD) 2.4 (1.4) 2.5 (1.4) 1.7 (1.5) ⬍.01
Fracture after spontaneous fall (%) 38.7 37.2 47.2 NS
Falls in the previous 3 mo (%) 28.0 28.5 25.0 NS
Previous fractures (%) 46.5 47.3 41.7 NS
One or more comorbidities (%) 38.3 34.8 58.3 ⬍.01
Two or more drugs prescribed (%) 72.4 69.6 88.9 ⬍.05
Use of sleeping pills (%) 36.2 36.7 33.3 NS
Use of antidepressants (%) 7.8 7.7 8.3 NS
Mean prefracture ADL score (SD) 8.3 (3.6) 8.1 (3.4) 9.4 (4.2) ⬍.05
Prior walking without difficulty (%) 72.0 73.9 61.1 NS
Good self-rated health (%) 80.7 81.2 77.8 NS
Good health compared with others (%) 75.7 81.2 44.4 ⬍.001
Disoriented (%) 17.3 14.5 33.3 ⬍.01
Mean depression score (SD) 6.7 (1.4) 6.7 (1.4) 6.8 (1.4) NS Mean coping score (SD) 4.2 (1.5) 4.2 (1.5) 4.4 (1.6) NS Outcome variables‡
Mobility self-reported as recovered (%) — 49.3 —
Confined to wheelchair or bed (%) — 19.8 —
Mean ADL score (SD) — 10.9 (4.3) —
Walking without difficulty (%) — 38.2 —
Level of ADL score regained (%) — 41.5 —
Level of walking ability regained (%) — 54.6 —
Mean number of hospital d/y (SD) — 65.6 (2.0) —
Notes: NS ⫽ not significant; ADL ⫽ activities of daily living. †Evaluated at admission in the study.
REHABILITATION AFTER HIP FRACTURE: PATIENT PROFILES M513
clearly needed to identify more specific and sensitive pre-dictors of a bad prognosis for the large number of patients in the second cluster (almost one third of the total sample) who were fully independent before hip fracture, but who had not yet recovered their functional autonomy 1 year later.
We are facing a different situation with the last two clus-ters, which together included one third of the subjects. The functional outcomes of their members were as poor as of those of cluster 2, but, contrary to the latter, the subjects of clusters 3 and 4 already had ambulation problems before their hip fracture and were largely dependent in their ADLs. It seems relatively clear that, apart from the palliative surgi-cal intervention, there is little to be gained from the use of an intensive rehabilitation program.
We acknowledge some limitations in our study. First, there is the question of the specific type of treatment the pa-tients received after their acute hospitalization. This in-cludes the treatment provided during their stay in rehabilita-tion institurehabilita-tions and nursing homes, as well as for those who returned home. Specifically, we are lacking information garding the type of functional rehabilitation the patients re-ceived, and we acknowledge that this could have had an ef-fect on the eventual functional outcome. Another limitation is our inability to precisely identify those exact prefracture variables that could have accounted for the poor results in cluster 2, compared with cluster 1. In fact, the most surpris-ing findsurpris-ing of our study was the different outcomes between these two groups, who were similar in many prefracture Table 4. Profile of Four Homogeneous Clusters of Hip Fracture Patients Grouped According to Outcomes and Their Predictors
Cluster 1 n⫽ 79 (38.2%) Cluster 2 n⫽ 62 (30.0%) Cluster 3 n⫽ 27 (13.0%) Cluster 4 n ⫽ 39 (18.8%) p Value Predictive variables†
Mean age (y) (SD) 78.2 (7.7) 83.8 (6.2) 84.0 (8.2) 85.9 (6.3) ⬍.001
Married (%) 40.5 22.6 18.5 7.7 ⬍.001
Living in nursing home (%) 5.1 4.8 37.0 64.1 ⬍.001
With higher education (%) 30.4 25.8 14.8 2.6 ⬍.01
With higher income (%) 63.3 58.1 29.6 35.9 ⬍.01
Mean number of leisure activities (SD) 3.3 (1.3) 2.4 (1.1) 2.0 (1.2) 1.3 (0.9) ⬍.001 Fracture after spontaneous fall (%) 25.3 40.3 37.0 56.4 ⬍.01
Falls in the previous 3 mo (%) 21.5 35.5 29.6 30.8 NS
Previous fractures (%) 51.9 51.6 51.9 28.2 NS
One or more comorbidities (%) 13.9 33.9 44.4 71.8 ⬍.001
Two or more drugs prescribed (%) 63.3 62.9 92.6 76.9 ⬍.05
Use of sleeping pills (%) 25.3 38.7 51.9 46.2 ⬍.05
Use of antidepressants (%) 2.5 8.1 11.1 15.4 NS
Mean prefracture ADL score (SD) 6.1 (0.6) 6.7 (1.7) 11.4 (2.7) 12.0 (4.3) ⬍.001 Prior walking without difficulty (%) 97.5 95.2 11.1 35.9 ⬍.001
Good self-rated health (%) 93.7 85.5 66.7 59.0 ⬍.001
Good health compared with others (%) 89.9 93.5 63.0 56.4 ⬍.001
Disoriented (%) 6.3 16.1 0.0 38.5 ⬍.001
Mean depression score (SD) 6.2 (0.7) 6.8 (1.5) 7.1 (1.6) 7.2 (1.9) ⬍.001 Mean coping score (SD) 3.7 (1.0) 4.5 (1.8) 4.1 (1.4) 4.9 (1.6) ⬍.001 Outcome variables‡
Mobility self-reported as recovered (%) 93.7 24.2 37.0 7.7 ⬍.001
Confined to wheelchair or bed (%) 0.0 12.9 7.4 79.5 ⬍.001
Mean ADL score (SD) 6.3 (0.7) 12.6 (2.8) 12.1 (2.3) 16.4 (1.6) ⬍.001
Walking without difficulty (%) 98.7 0.0 3.7 0.0 ⬍.001
Level of ADL score regained (%) 81.0 0.0 44.4 25.6 ⬍.001
Level of walking ability regained (%) 98.7 0.0 81.5 33.3 ⬍.001 Mean number of hospital d/y (SD) 45.8 (1.7) 96.1 (1.7) 60.3 (2.5) 78.2 (2.1) ⬍.001
Notes: NS ⫽ not significant; ADL ⫽ activities of daily living.
†Evaluated at admission in the study. ‡Evaluated after 1-y follow-up.
Table 5. Schematic Classification of Patients According to Mobility and Functionality
Ambulatory Mobility Functional Independence
Cluster No. Mean Age Population Fraction A B A B
1 78 y 38% Complete Complete Complete Complete
2 84 y 30% Complete Reduced Complete Reduced
3 84 y 13% Reduced Lost Reduced Reduced
4 86 y 19% Reduced Lost Reduced Lost
M514 MICHEL ET AL.
variables. However, there were several variables that, when examined closely, appear to be of predictive value in differ-entiating these two groups. A higher proportion of patients in cluster 1 were married ( p ⬍ .05) and had fewer comor-bidities ( p ⬍ .01) than those in cluster 2. And although there was a trend for a greater percentage of patients in cluster 2 to be disoriented and to have sustained their fracture after a spontaneous fall, this was not statistically significant as compared with cluster 1. Clearly, this is an area that re-quires further study.
In view of our findings, cluster analysis seems to be a promising starting point for further research in the direction of a more effective hip fracture treatment program for the frail elderly population. It appears that careful consideration of the identified typical profile categories of hip fracture pa-tients could help select the most appropriate intervention approach. For efficient decision making, this implies an ex-tensive overall pretreatment geriatric evaluation to optimize all aspects of management, including reduction of stress, controlling pain, and possible restoration of prefracture mo-bility, while limiting direct and indirect costs.
Acknowledgments
This research was supported by the Swiss Foundation for Scientific Re-search (Grant 4032-35680). The authors gratefully acknowledge Richard Stern, MD, for constructive review of the manuscript and invaluable assis-tance in the preparation of the final version, and Marie-Pascale Limagne, MA, for active participation in data collection.
Address correspondence to J.-P. Michel, Department of Geriatrics, Univer-sity Hospitals of Geneva, Route de Mon Idée, CH-1226 Thônex, Geneva, Switzerland. E-mail: jean-pierre.michel@hcuge.ch
References
1. Schürch MA, Rizzoli R, Mermillod B, Vasey H, Michel JP, Bonjour JP. A prospective study on socio-economic aspects of fracture of the proximal femur. J Bone Miner Res. 1996;11:1935–1942.
2. Barrett-Connor E. The economic and human costs of osteoporotic fracture. Am J Med. 1995;98(suppl 2A):3AS–8AS.
3. Nickens H. A review of factors affecting the occurrence and outcome of hip fracture, with special reference to psychosocial issues. J Am
Geriatr Soc. 1983;31:166–170.
4. Jette AM, Harris BA, Cleary PD, Campion EW. Functional recovery after hip fracture. Arch Phys Med Rehabil. 1987;68:735–740. 5. Mossey JM, Mutran E, Knott K, Craik R. Determinants of recovery 12
months after hip fracture: the importance of psychosocial factors. Am J
Public Health. 1989;79:279–286.
6. Magaziner J, Simonsick EM, Kashner TM, Hebel JR, Kenzora JE. Pre-dictors of functional recovery one year following hospital discharge for hip fracture: a prospective study. J Gerontol Med Sci. 1990;45A: M101–M107.
7. Barangan JD. Factors that influence recovery from hip fracture during hospitalization. Orthop Nurs. 1990;9:19–30.
8. Marottoli RA, Berkman LF, Cooney LM. Decline in physical function following hip fracture. J Am Geriatr Soc. 1992;40:861–866. 9. Marottoli RA, Berkman LF, Leo-Summers L, Cooney LM. Predictors
of mortality and institutionalization after hip fracture: the New Haven EPESE cohort. Am J Public Health. 1994;84:1807–1812.
10. Koval KJ, Skovron ML, Aharonoff GB, Meadows SE, Zuckerman JD. Ambulatory ability after hip fracture. Clin Orthop. 1995;310:150–159. 11. Young Y, Brant L, German P, Kenzora J, Magaziner J. A longitudinal examination of functional recovery among older people with subcapi-tal hip fractures. J Am Geriatr Soc. 1997;45:288–294.
12. Fox KM, Hawkes WG, Hebel JR, et al. Mobility after hip fracture pre-dicts health outcomes. J Am Geriatr Soc. 1998;46:169–173.
13. Norusis MJ. SPSS/PC⫹, Base System User’s Guide, Version 5.0. Chi-cago: SPSS; 1992.
14. Cooper C, Campion G, Melton LJ III. Hip fractures in the elderly: a world-wide projection. Osteoporos Int. 1992;2:285–289.
15. Jensen JS, Tondevold E, Sorensen PH. Costs of treatment of hip frac-tures: a calculation of the consumption of resources of hospitals and rehabilitation institutions. Acta Orthop Scand. 1980;51:289–296.
Received January 13, 2000 Accepted April 3, 2000
Decision Editor: John E. Morley, MB, BCh
APPENDIX 1
OUTCOME VARIABLES
1. Mobility status self-reported through answer to the question: Can you walk or transfer as well as before having fractured your hip?
2. Mode of transfer rated on a 7-point scale (1 ⫽ walks alone and uses stairs, 2 ⫽ walks alone but does not use stairs, 3 ⫽ needs one or two canes, 4 ⫽ needs an assistive device, 5 ⫽ needs a wheelchair, 6 ⫽ is confined to chair, 7 ⫽ is confined to bed).
3. ADLs including bathing, dressing, grooming, walking, eating, and toileting, with ability rated on a 3-point scale for each activity (1 ⫽ without any difficulty, 2 ⫽ with some difficulty, 3 ⫽ complete inability). The ADL score, defined as the sum of the 6-item codes, ranges from 6 (total inde-pendence) to 18 (complete deinde-pendence).
4. The ADL item concerning walking ability, rated as in-dicated previously.
5. Recovery in ADL score, a dichotomous measure consid-ered positive if the ADL score at 1 year was equal or lower than the prefracture ADL score, as derived from the first interview.
6. Recovery in walking ability, a dichotomous measure considered positive if the code of the corresponding ADL item was, at 1 year, equal to or lower than before fracture.
7. Total number of hospital days during the year of fol-low-up obtained by summing all lengths of hospitalization, either for acute or chronic conditions including convales-cence and rehabilitation.
APPENDIX 2
PREDICTIVE VARIABLES
1. Age (mean age and standard deviation in years) 2. Marital status (percent married)
3. Type of residence (percent living in nursing home) 4. Education (percent having received college or univer-sity education)
5. Income (percent receiving more than 2000 Swiss francs per month)
6. Leisure activities (mean number and standard devia-tion; the seven regular activities assessed were: excursions, physical exercise, gardening or manual work, volunteer work, listening to radio or watching television, reading newspapers or books, traveling 3 days or more)
7. Type of fall having caused the hip fracture (percent having sustained fractures consecutive to unexplained spon-taneous fall, in contrast to accidental fall)
8. History of fall (percent having fallen within the 3 pre-fracture months)
REHABILITATION AFTER HIP FRACTURE: PATIENT PROFILES M515
9. History of fractures (percent having already been hos-pitalized for one or more other fractures)
10. Chronic conditions (percent with one or more comor-bid disorders recorded in the hospital medical file)
11. Drugs (percent with two or more drugs prescribed prior to hip fracture)
12. Sleeping pills (percent using sleeping pills) 13. Antidepressants (percent using antidepressants) 14. ADLs (mean prefracture ADL score and standard de-viation; this composite predictive variable is identical to the ADL outcome defined in Appendix 1, but refers to the pre-fracture status of the patient)
15. Walking ability (percent who walked without diffi-culty prior to hip fracture; this variable is the ADL item concerning walking ability)
16. Perceived absolute health level (percent in self-rated good health)
17. Perceived comparative health level (percent in self-rated health as good as other persons of same age)
18. Disorientation (percent having not answered correctly
all four questions on age, birthday, year of birth, and home ad-dress)
19. Depressive signs (mean depression score and stan-dard deviation); the instrument includes six questions rated on a 2-point scale (1 ⫽ never or sometimes, 2 ⫽ often): “Do you feel alone?”; “forgotten?”; “unnecessary?”; “Do you long for company?”; “Are you tired of life?”; and “worried about the future?” The depression score, defined as the sum of the 6-item codes, ranges from 6 to 12.
20. Coping strategy (mean coping attitude score and stan-dard deviation); the instrument includes three attitude state-ments rated on a 3-point scale (1 ⫽ certainly, 2 ⫽ perhaps, 3 ⫽ not at all): “I convince myself that it could have been much worse” (for problem redefinition); “I try to adapt my objectives and wishes to the circumstances” (for self-con-cept modification); “I convince myself that I already faced many more serious situations” (for self-concept bolstering). The coping attitude score, defined as the sum of the 3-item codes, ranges from 3 (most positive attitude) to 9 (most neg-ative attitude).