Diastolic function in hypertrophic cardiomyopathy:
effects of propranolol and verapamil on diastolic
stiffness
O. M. HESS, J. GRIMM AND H. P. KRAYENBUEHL
Department of Internal Medicine, Medical Policlinic, Cardiology, University Hospital, Zurich, Switzerland
KEY WORDS: Myocardial stiffness, hypertrophic cardiomyopathy, propranolol, verapamil, left ventricular relaxation.
In patients with hypertrophic cardiomyopathy (HCM), impaired left ventricular (LV) relaxation and diastolic filling have been reported. Therefore, we determined L V diastolic stiffness in nine patients with HCM before and 10 to 15 min after 0-15 mg/kg propranolol i. v. (group 1) and in six patients with HCM before and 10 to 15 min after 0-1 mg/kg verapamil i.v. (group 2). Simultaneous LV cineangiography and high-fidelity pressure measurements were performed in group 1 and simultaneous M-mode echocardiography and high-fidelity pressure measurements in group 2. Passive LV chamber stiffness was determined in group 1 from the diastolic pressure-volume data using an exponential three-parameter model: P=aePy +C, where P=pressure, a = intercept, ft = constant of chamber stiffness, V= volume and C = baseline pressure. Passive L V myocardial stiffness was estimated in group 2 from the diastolic stress-strain data using a viscoelastic model: o = a'(eP't- \) + r\k, where o = meridional wall stress, a = intercept, P' = constant of myocardial stiffness, e = midwall strain, r\ = constant ofmyocardial viscosity and £ =strain rate. LV relaxation was assessed from the time constant of LV pressure decay (T) by plotting LV pressure versus negative dP/dt. LV diastolic filling was evaluated from peak and mean L V filling rate in group 1 and from peak and mean midwall lengthening rate in group 2.
L V chamber and myocardial stiffness, respectively, remained unchanged before and after administration of propranolol (p = 0-054 and 0-047) and verapamil (ft' = 14-8 and 12-6); however, the time constant of LV pressure decay T increased significantly in group 1 from 45 to 66 ms (P<0-05) and decreased significantly in group 2 from 53 to 43 ms (P<0-05). Parallel to the changes in LV isovolumic relaxation, mean LV diastolic filling rate decreased significantly in group 1 from 257 to 196 ml m~2 s~' (P<0-025) and mean LV midwall
lengthening rate increased significantly in group 2 from 2-37 to 4-31 cm /sec (P<0-05).
It is concluded that L V diastolic stiffness remains unchanged in patients with HCM after propranolol and verapamil. LV relaxation and mean diastolic filling, however, are impaired in patients with HCM following propranolol but are improved after verapamil. Thus, the beneficial effect of verapamil on diastolic mechanics
is related to improved relaxation and diastolic filling rather than to changes in LV diastolic stiffness. Introduction a systolic outflow gradient. A favourable effect of 0
blocking agents on the systolic outflow tract gradient Abnormal left ventricular diastolic function and is well established, whereas it remains controversial impaired left ventricular filling dynamics""41 have whether the passive diastolic chamber stiffness is been reported in patients with hypertrophic cardio- altered by the administration of B blocking myopathy. The increased resistance to ventricular agents'56'. Kaltenbach and coworkers17' reported a filling (diastolic compliance failure) is probably salutary response to verapamil in patients with responsible for clinical symptoms such as dyspnea hypertrophic cardiomyopathy, and recently Lorell and lung congestion, and is considered to be the and coworkers(8) showed a favourable effect of major problem in patients with hypertrophic cardio- nifedipine on abnormal left ventricular relaxation myopathy, irrespective of the presence or absence of and diastolic filling rates in patients with
hypertrophic cardiomyopathy.
Address for correspondence: Otto M. Hess, Department of Internal _., r i_ J . ,
-Medicine, Medical Policlinic, Division of Cardiology, University T n e Purpose of the present Study was, therefore, t o
Hospital, Raemistrasse ioo, 8091 Zurich, Switzerland. evaluate the effects of p r o p r a n o l o l and verapamil on 0L95-668X/83/4F0047+ 10J03.00/0 © 1983 The European Society of Cardiology
RAO
LAO
RAO
LAO
Figure 1 Left ventricular biplane cineangiograms in a patient with hypertrophic cardiomyopathy before (upper panel) and after (lower panel) intravenous administration of propranolol. Note the slight increase in left ventricular chamber size following propranolol ed: end-diastole; es: end-systole; RAO, LAO: right, left anterior oblique projection.
left ventricular diastolic mechanics in 15 patients with hypertrophic cardiomyopathy, and to determine whether or not relaxation and passive diastolic chamber and myocardial stiffness can be influenced by the administration of these drugs.
Patients and methods
Fifteen patients with the typical clinical, haemodynamic, echocardiographic and angiographic findings of hypertrophic cardiomyopathy were included in the present study. All patients were in
24 to 48 h prior to catheterization.
Nine patients (group 1) were studied at rest and 10 to 15 min after intravenous administration of 0-15 mg/kg propranolol, and six patients (group 2) were studied 10 to 15 min after intravenous administration ofO-1 mg/kg verapamil. Three patients of group 1 had undergone previous septal myectomy, and two of them had left bundle branch block following surgery (QRS duration 0-14 s in both). In all other patients QRS duration did not exceed 0-11 s. The mean age was similar in both groups (43 and 47 years, respectively). The nine patients of group 1 have been published previously"1. Four patients of group 1 had no pressure gradient at rest but developed one after postextrasystolic potentiation or Valsalva manoeuvre; in group 2, three patients demonstrated only small systolic pressure gradients (<10 mmHg) at rest.
Standard haemodynamic measurements were per-formed in both groups at rest and 10 to 15 min after the administration of propranolol or verapamil. Left ventricular pressure was measured with a trans-septally introduced Millar micromanometer; simul-taneous aortic pressure was determined by a fluid-filled catheter. Biplane cineangiography was performed at 50 frames/s in the right (RAO) and left anterior oblique (LAO) projection with simultaneous recordings of left ventricular high-fidelity pressure, its first derivative (dP/dt) and a peripheral lead of the standard electrocardiogram*5'. In group 1 patients a second biplane cineangiogram was carried out 10 to 15 min following intravenous adminis-tration of propranolol (Fig. 1).
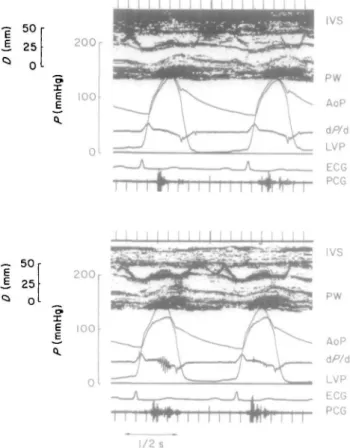
Simultaneous M-mode echocardiography and high-fidelity pressure measurements (Fig. 2) were performed in group 2 patients at rest and 10 to 15 min after intravenous administration of 0-l mg/kg verapamil. Left ventricular high-fidelity pressure, conventional aortic pressure, dP/di, the phonocardiogram and a peripheral lead of the standard electrocardiogram were recorded on an oscillograph (Electronics for Medicine VR-12) at a paper speed of 100 mm/s1".
Data analysis
Frame by frame analysis was performed for deter-mination of left ventricular biplane volume in group 1 according to the area-length method*5'. Matching of the individual cineframe with the left ventricular high-fidelity pressure was carried out by a numerical
-g 50
J 25
Q 0 i E 2 0 0 100 TTT 50 25 0 I E e 2 0 0 100 5 IVS PW 1/2 sFigure 2 Left ventricular simultaneous echo-pressure
measurements in a patient with hypertrophic
cardio-myopathy before (upper panel) and after (lower panel)
intravenous administration of 8 mg verapamil. Note that
there is a small systolic pressure gradient between the left
ventricular (LVP) and the aortic pressure (AoP) tracing after
verapamil. The heavy echo in the mid-portion of the left
ventricular cavity stems from the Millar tip manometer. IVS,
interventricular septum; PW, posterior wall; dP/dt, first
derivative of LVP; ECG, electrocardiogram; PCG,
phonocardiogram; D, diameter; P, pressure.
code which appeared on both the cinefilm and the
pressure tracing'
5*.
The M-mode echocardiograms and high-fidelity
pressure tracings (Fig. 2) in group 2 were digitized by
a computer-assisted system, and instantaneous left
ventricular internal and midwall diameter,
meri-dional wall stress and midwall lengthening rate were
calculated at time intervals of 5 to 10 ms"
1.
For the assessment of left ventricular chamber
stiffness, the pressure—volume data in group 1 were
fitted to an exponential pressure-volume
relationship using a three-parameter model:
where P= pressure (mmHg), a = intercept (mmHg),
P = constant of left ventricular chamber stiffness,
V= volume (ml/m
2) and C= baseline pressure
(mmHg). The mathematical analysis was performed
by an iteration procedure
1101using a non-linear
curve-fitting program"" to determine the three constants a,
P and C.
For the assessment of left ventricular myocardial
stiffness the stress-strain data in group 2 were fitted
to an exponential viscoelastic stress-strain model
incorporating an elastic and a viscous term"
01:
ventricular myocardial stiffness, E = midwall strain, r} = constant of left ventricular myocardial viscosity (g s cm"2) and e = strain rate (s~'). Left ventricular midwall strain (e) was normalized to a reference midwall circumference (0 at a common wall stress of 1 g/cm2 calculated from the viscoelastic stress-circumference relationship"01. This midwall circumference at 1 g/cm2 (/,) was used for the determination of normalized midwall (natural) strain:
The mathematical analysis for the evaluation of the myocardial stiffness constants was carried out by an interation procedure'101 using the non-linear curve-fitting program1'".
For the assessment of left ventricular relaxation the time constant of left ventricular pressure decay (7, in milliseconds) was calculated from the linear regression between negative dP/dt and left ventricular pressure after peak negative dP/dl up to mitral valve opening:
where P=left ventricular pressure (mmHg) and PB = pressure intercept at dP/d/ = 0*9l2).
For the assessment of left ventricular filling, peak filling rate was determined in group 1 from left ventricular cineangiograms. The mean filling rate was calculated from the stroke volume divided by the diastolic (mitral valve opening to end-diastole) filling time interval. Left ventricular peak and mean midwall lengthening rate were determined from the digitized M-mode echocardiograms(9).
Results
ECHOCARDIOGRAPH1C FINDINGS (TABLE 1)
Septal wall thickness ( > l - 3 cm) and the ratio of septal to posterior wall thickness (>l-3) were increased in all patients. Left ventricular internal diameter and systolic shortening were similar in both groups. Systolic anterior motion (SAM) of the anterior mitral leaflet was present in eight of nine patients of group 1 and in five of six patients of group 2.
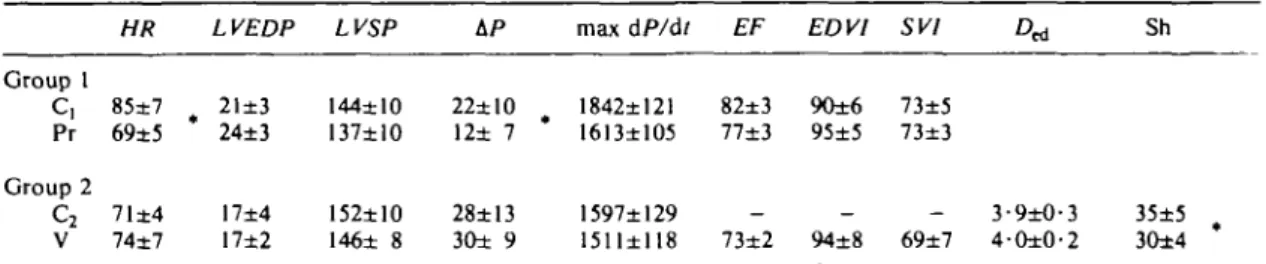
STANDARD HAEMODYNAM1C MEASUREMENTS (TABLE 2)
Heart rate decreased significantly from 85 to 69 beats/min following propranolol but remained
beats/min). Left ventricular end-diastolic and peak systolic pressure was unchanged after propranolol as well as after verapamil. The systolic pressure gradient decreased significantly from 22 to 12 mmHg follow-ing propranolol but remained unchanged after verapamil (28 vs. 30 mmHg). Left ventricular maximum dP/dt decreased slightly although not significantly in both groups after f} blockade and verapamil. Left ventricular angiographic ejection fraction decreased slightly from 82 to 77<7o in group 1, whereas left ventricular end-diastolic volume index and systolic stroke volume remained unchanged after propranolol. Ejection fraction and end-diastolic volume in group 2 after administration of verapamil were comparable to the angiographic data in group 1 after propranolol. However, control data in group 2 were not available according to our protocol. The echocardiographic left ventricular end-diastolic diameter increased slightly from 3-92 to 4-04 cm after verapamil and systolic diameter shortening decreased significantly from 35 to 30%.
DIASTOLIC FUNCTION PARAMETERS (TABLE 3)
The diastolic pressure-volume data showed no significant change before and after propranolol (Fig. 3). The constant of left ventricular chamber stiffness A
(/?) and the intercept (a) decreased slightly although not significantly after p blockade. The baseline pressure (C) increased slightly after propranolol.
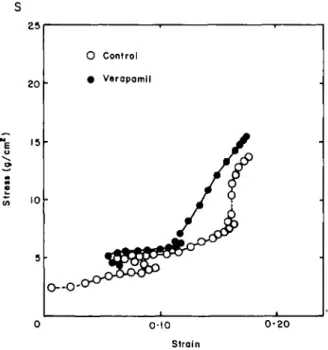
The diastolic stress-strain data in group 2 showed no significant change in diastolic myocardial function after administration of verapamil (Fig. 4). The constant of left ventricular myocardial stiffness (/}') and the intercept (a') remained unchanged following verapamil. The constant of myocardial viscosity (rf) and the reference midwall circumference (/,) increased slightly although not significantly after verapamil.
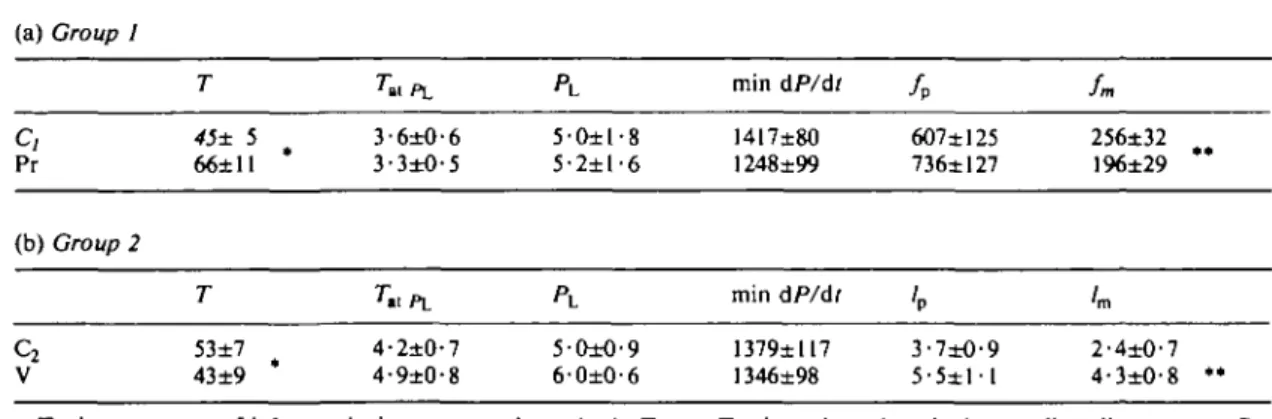
RELAXATION AND FILLING PARAMETERS (TABLE 4) * Tincreased significantly from 45 to 66 ms in group 1 but decreased significantly from 53 to 43 ms in group 2. The number of T values elapsed at the lowest diastolic pressure (7"al p^, decreased slightly after propranolol but increased slightly after verapamil. The lowest diastolic pressure (P,J and t peak negative dP/dt remained unchanged after both propranolol and verapamil.
Left ventricular peak filling rate remained un-changed in group 1 following propranolol, whereas the mean filling rate significantly decreased. The peak midwall lengthening rate in group 2 increased,
Table t Group Group f 1 2 Echocardiographic findings HR 78 (60-94) 75 (50-94) (3 (3 4-5 •7-5-4-4 •6-5-6) 6) Sh 41 (35-38) 39 (32-47) (1 (1 IVS 1-9 •3-2-1-9 •4-2-2) 2) (0 (1 PW 1-1 • 9 - 1 1 1 • 0 - 1 •2) • 2 ) 1VS/PW (1 (1 1-8 •5-2-2) 1-7 •3-2-3) HR, heart rate (beats/min); D^, left ventricular end-diastolic internal chamber diameter (cm); Sh, systolic shortening of the internal diameter (%); IVS, septal wall thickness (cm); PW, posterior wall thickness (cm); IVS/PW, septal to posterior wall ratio.
All data given are mean values and ranges'.
Table 2 Standard haemodynamics
HR LVEDP LVSP max dP/dt EF EDV1 SV1 D* Sh
Group 1 C, Pr Group 2 C2 V 85±7 69±5 71±4 74±7 21±3 24±3 17±4 17±2 144±10 137±10 152±10 146± 8 22±10 12± 7 28±13 30± 9 1842±121 82±3 90±6 73±5 1613±105 77±3 95±5 73±3 1597±129 1511±118 73±2 94±8 69±7 3-9±O-4-0±0' 35±5 3O±4 C|, control run group 1; Pr, propranolol; C2, control run group 2; V, verapamil; HR, heart rate (beats/min); LVEDP, left ventricular end-diastolic pressure (mmHg); LVSP, left ventricular peak systolic pressure (mmHg); AP, systolic pressure gradient (mmHg); max dP/dt, maximal rate of left ventricular pressure rise (mmHg/s); EF, systolic ejection fraction (%); EDV1, left ventricular volume index (ml/m2); SVI, stroke volume index (ml/m2); D^, left ventricular internal diameter at
end-diastole (cm); Sh, systolic shortening of the internal diameter (%); • P<0-05. All data are given as mean values ±1 S.E.M
Table 3 Diastolic function data
(a) Pressure-volume relationship: Croup I
P
Pr 5-8±2-9 4-7±3-3 0-054±0-01 0-047±0-01 0-8±2-l 4-4±2-8 (b) V Stress-strain 4 5 relationship: a' • O d t l - 8 •5±3-9 Group 2P'
14-8±4-4 12-6±4-0 0- 2-1 9±1- 8±0-4 9 /, 13-8±1 14-1±1 •7 •5a, intercept (mmHg); p, constant of chamber stiffness;
C, baseline pressure (mmHg); a', intercept (g/cm2); p',
constant of myocardial stiffness; rj, constant of myocardial viscosity (g s c m "2) ; /,, left ventricular reference midwall
circumference at a common wall stress of 1 g/cm2 (cm); C,,
control run group 1; Pr, propranolol; C2, control run group 2; V, verapamil.
lengthening rate increased significantly from 2-4 to 4-3 cm/sec following administration of verapamil.
Discussion
Improved relaxation and diastolic filling have been reported in patients with hypertrophic cardio-myopathy following administration of nifedipine(8). A beneficial effect of 0 blocking agents on systolic outflow gradient has been well established, whereas the effect of p blocking agents on the passive diastolic properties remains a matter of controversy'5'61. Therefore, the purpose of the present study was to examine the effect of propranolol and verapamil on left ventricular diastolic mechanics in order to determine whether or not left ventricular relaxation, diastolic filling and passive diastolic chamber and muscle properties are influenced by the administration of these drugs. The study group included not only patients with mild to moderate resting gradients but
i E
LV volume (ml/m2)
Figure 3 Left ventricular pressure-volume relationship in a patient before (open circles) and after (closed circles) intravenous administration of propranolol. Note that the diastolic pressure-volume relationship remains unchanged after /3 blockade. 25 20 15 10 O Control • Verapamil O--O-' 0-10 0-20 Strain
Figure 4 Left ventricular viscoelastic stress - strain relationship in a patient before (open circles) and after (closed circles) intravenous administration of verapamil. Note that the stress—strain relationship remains unchanged before and after administration of verapamil.
Table 4 Relaxation and filling data (a) Croup I
c,
Pr (b) Group 2c
2 V T 45±S 66±11 T 53±7 43±9 Tu PL 3-6±0-6 3-3±O-5 7»l PL 4-2±0-7 4-9±0-8 PL 5-O±l-8 5-2±l-6 5-O±O-9 6-0±0-6 min dP/dt 1417±80 1248±99 min dP/dt 1379±117 1346±98 / P 607±125 736±I27 'P 3-7±O-9 5 - 5 ± l l fn, 256±32 196±29 lm 2-4±0-7 4-3±O-8 *• T, time constant of left ventricular pressure decay (ms); 7"al p., rvalues elapsed at the lowest diastolic pressure; PL,lowest diastolic pressure (mmHg); min dP/dt, maximal rate of left ventricular pressure fall ( m m H g / s ) ^ , , left ventricular peak filling rate (ml m~2 s - ' ) ; /m. left ventricular mean filling rate (ml m~2 s-1); /p, left ventricular peak midwall
lengthening rate (cm/s); /m, left ventricular mean midwall lengthening rate (cm/s); *P<0-05; **P<0-025; C,, control run group 1; Pr, propranolol; C2, control run group 2; V, verapamil.
All data are given as mean values±l S.E.M.
also four patients with provocable systolic pressure
gradients in group 1 and three patients with minimal
resting outflow gradients (<10 mmHg) in gToup 2.
Therefore, our results are valid for patients with no or
moderate pressure gradients, and might not be
extrapolated to patients with large outflow tract
gradients who are operated on at our institution.
The data suggest that left ventricular relaxation is
delayed in patients with hypertrophic
cardiomyopathy following 0 blockade probably due
to negative inotropic effect of propranolol and due
to the change in heart rate
(l2). In contrast, left
ventricular relaxation is enhanced after
adminis-tration of verapamil, probably due to a direct effect
of the calcium channel blocker on the deactivation
process in patients with hypertrophic
cardio-myopathy. Since loading conditions were not
significantly altered after verapamil, the changes in
left ventricular relaxation cannot be explained by
unloading of the left ventricle. Usually, 3 to 5 min
-S -500 I E - -1000 • o TJ 1 -1500 -2000 \
\o \
\ * \
\ ' \
\ 25 50 75 100 LVP (mmHg) 25 50 75 100Figure 5 Left ventricular negative dP/dt vs. pressure plot in a patient with
hypertrophic cardiomyopathy before and after propranolol (left hand panel) as
well as before and after verapamil (right hand panel). The control data are
represented by the open symbols and the propranolol and the verapamil data by the
closed symbols. Note that the time constant of left ventricular pressure decay (77) is
increased from 53 to 76 ms after propranolol but is decreased from 57 to 43 ms after
verapamil. LVP, left ventricular pressure; -dP/dt, negative dP/dt.
heart rate and a decrease in aortic pressure due to peripheral vasodilatation. However, our measurements were performed 10 to 15 min after infusion of verapamil, when heart rate and aortic pressure were back to control (Table 1). The mild negative inotropic effect of verapamil with a decrease in systolic shortening of the left ventricular internal diameter would tend to decrease the rate of relaxation rather than to increase it. Thus, verapamil is associated with an improvement in left ventricular relaxation, and, therefore, facilitates diastolic filling by lowering early diastolic filling pressures. Therefore, one would expect an improved diastolic filling rate after administration of verapamil but a decreased filling rate after propranolol. Our data confirm that diastolic filling is improved after verapamil but is impaired after propranolol with a decrease in mean diastolic filling rate. The analysis of diastolic chamber and muscle stiffness, however, showed no change in left ventricular diastolic passive properties after the administration verapamil or propranolol.
Thus, we can conclude that the beneficial effect of verapamil on diastolic mechanics is related to improved relaxation and diastolic filling rather than to changes in myocardial wall stiffness. In contrast, the beneficial effect of propranolol appears to be related to the reduction of systolic outflow gradient rather than to changes in diastolic filling or passive chamber stiffness. This might explain the lack of clinical improvement in some patients with hyper-trophic cardiomyopathy treated with propranolol, especially those without outflow obstruction.
The work reported in this paper was supported by the Swiss National Science Foundation.
References
(1) Sanderson JE, Gibson DC, Brown DJ, Goodwin JF. Left ventricular filling in hypertrophic cardio-myopathy. Br Heart J 1977; 39: 661-70.
(2) Gotsman MS, Lewis BS. Left ventricular volume and compliance in hypertrophic cardiomyopathy. Chest 1974; 66: 498-505.
(3) Stewart S, Mason DT, Braunwald E. Impaired rate of left ventricular filling in idiopathic hypertrophic subaortic stenosis and valvular aortic stenosis. Circulation 1968; 37: 8-14.
(4) Hanrath P, Mathey DG, Kremer P, Sonntag F, Bleifeld W. Effect of verapamil on left ventricular isovolumic relaxation time and regional left
ventri-Cardiol 1980; 45: 1258-63.
(5) Speiser KW, Krayenbuehl H P . Reappraisal of the effect of acute betablockade on left ventricular filling dynamics in hypertrophic obstructive cardio-myopathy. Eur Heart J 1981; 2: 2 1 - 9 .
(6) Swanton RH, Brooksby IAB, Jenkins BS, Webb-People MM. Haemodynamic studies of betablockade in hypertrophic obstructive cardiomyopathy. Eur J Cardiol 1977; 5/4: 327-41.
(7) Kaltenbach M, Hopf R, Kober G, Bussmann WD, Keller M, Petersen Y. Treatment of hypertrophic obstructive cardiomyopalhy with verapamil. Br Heart J 1979; 42: 35-42.
(8) Lorell BH, Paulus WJ, Grossman W, Wynne J, Conn PF. Modification of abnormal left ventricular diastolic properties by nifedipine in patients with hypertrophic cardiomyopathy. Circulation 1982; 65: 499-507.
(9) Eichhorn P, Grimm J, Koch R, Hess O, Carroll J, Krayenbuehl H P . Left ventricular relaxation in patients with left ventricular hypertrophy secondary to aortic valve disease. Circulation 1982; 65:
1395-1404.
(10) Hess OM, Schneider J, Koch R, Bamert C, Grimm J, Krayenbuehl HP. Diastolic function and myocardial structure in patients with myocardial hypertrophy. Circulation 1981; 63: 360-71.
(11) Metzler CM, Elfring GL, McEwen M. A package of computer programs for pharmacokinetic modeling. Biometrics 1974; 30: 562 (ebstr.).
(12) Weisfeldt ML, Weiss JL, Frederiksen J T , Yin FCP. Quantification of incomplete left ventricular relaxation: relationship to the time constant of isovolumic pressure fall. Eur Heart J 1980; 1 (Suppl A): 119-29.
Kaltenbach In some respects your findings are in agreement with ours, but in others there is disagreement. This disagreement concerns systolic function after verapamil. If I am correct you have found a change towards improved diastolic function but no essential change in systolic function. We have found both improved diastolic function and reduced contractility. I assume the reason for this difference is the method of administering verapamil. If you compare a bolus of propranolol with a bolus of verapamil there are significant differences. 1 think a bolus injection of verapamil can only be evaluated if sympathetic activity is blocked or if the substance is given as a prolonged infusion or by oral adminis-tration. But if bolus administration of verapamil is evaluated, then the effect of the calcium blocker and ' the effect of increased sympathetic activity are superimposed.
Hess We did not want to blunt our results by administration of /3-blocking agents before verapamil. It was actually not a bolus injection that
we used but rather an intravenous infusion for about 3 to 4 min. It was very interesting to see that after 2 or 3 min of verapamil administration, we had, first, an increase in most patients' pressure gradient. The measurements which we have presented here were made 10 to 15 min after administration of the drug, when the haemodynamic situation was almost back to the control level. You have seen that the heart rate was not significantly different before and after administration of verapamil.
Kaltenbach It was an increase from 71 to 74 beats/min, this might not be a significant#difference, but . . .
Hess It was more, you know, when you look at the 5 min values after administration of verapamil; we had an increase from about 70 to 80 and then it came back 10 min after to the values which we had had before. Although the pressure gradient was unchanged after 10 min, 5 min after administration we saw in most patients an increase in outflow gradient.
And now to your other question. We have seen in some patients a decrease in contractility. We have studied six patients with verapamil only and we have seen a slight decrease in dP/dtmlLK. And the ejection
fraction was also lower, 73% after verapamil as compared to 82% in group 1 at rest. I think we had a mild effect on systolic function.
Bertrand I have two questions. Have you studied the effects of other calcium antagonists, especially nifedipine, in these particular patients? My second question is: Obviously, when you are injecting verapamil intravenously, you have direct myocardial effects and also peripheral effects. Have you studied the direct myocardial effect by injecting the drug directly into the left coronary artery, in order to separate the two effects of the drug?
Hess To answer the second question first, we did not inject it directly because you know that you get asynchronous contractions when you inject directly in the coronary artery and you may not be sure what you are going to find; you probably see a decrease in everything because you have left ventricular asynchrony.
Now to your first question. In a non-invasive study, we evaluated the effects of nifedipine on relaxation. We have seen an increase in peak lengthening rate and found that filling was improved after the
administration of nifedipine similar to our present study.
Schmiel I would like to make some remarks and put some questions concerning the method you used. First, there exists one paper by Rutishauser from the late 1960s in which he demonstrated that the pressure fall during the relaxation period, during the isovolumic relaxation period, was not constant. That means, the ratio of dP/dT divided by the instantaneous pressure does not remain constant and that means the description by a function as Weiss used it is not adequate. You must use a modified exponential function to do this. The second thing is, how did you determine your strain from the dimensional data? I think it is practically impossible to determine the resting length of the heart muscle. The third point is a remark concerning these parameters that you determined by a non-linear fitting. Our experience is that if you analyse two or three consecutive heart beats, the parameters are significantly different from what you achieve by this analysis.
Hess We are well aware that the downslope might not be linear for the dP/dt vs. P regression. As Dr Murgo pointed out, there might be a biphasic slope and there might be some other problem with this kind of analysis. However, you all know that after propranolol with a decrease in contractility there must be a decrease in the rate of relaxation. With verapamil you can see an increase in relaxation rate, as it was shown in the paper of Lorell and coworkers. The way in which we do our analysis might be wrong. Maybe in patients with hypertrophic cardiomyopathy and asymmetric hypertrophy we should better use a regional relaxation parameter. I do not know an answer, but this is probably the best way as we did it. Now to the second point, we had a publication some years ago where we showed that you can't get zero pressure in patients because you can't do caval occlusion and bring the lowest pressure down to zero. Thus, we use an extrapolation procedure; here we do first a fit to the pressure-circumferential wall length relation and determine the circumferential length at the calculated stress of 1 g/cm2 or the calculated volume of 1 mmHg. This length is used for normalization. This is an assumption, probably the best one, to get normalized data in patients.
Now to the third point, to the analysis of consecutive beats. Our data showed that there was no change before and after propranolol and before and after verapamil. This shows that the model used was
difference between the patients. If you see a difference from beat to beat, then you must have used the wrong model, I should say.
Schmiel You demonstrated only the plots, but not the parameter of the curves, and the plots seem to be identical, but I believe that the parameters of the curves are significantly different.
Hess No, they were exactly the same; the single parameters were on the top of the figure. You could see that the stiffness data were the same.
improvement clinically is often as much as 2 years from the beginning of the administration of propranolol. Do you have any data with repeated invasive studies, assuming that the method of measurement is at least satisfactory from the point of view using the patient as his own control?
Hess No. Professor Rothlin will show some data of a clinical follow-up study of patients with propranolol and verapamil. These patients showed a lower mortality rate than untreated patients. We did not repeat our measurements, otherwise you would have to recatheterize the patients. 1 am not sure if you would find different results.