Publisher’s version / Version de l'éditeur:
Vous avez des questions? Nous pouvons vous aider. Pour communiquer directement avec un auteur, consultez la
première page de la revue dans laquelle son article a été publié afin de trouver ses coordonnées. Si vous n’arrivez pas à les repérer, communiquez avec nous à PublicationsArchive-ArchivesPublications@nrc-cnrc.gc.ca.
Questions? Contact the NRC Publications Archive team at
PublicationsArchive-ArchivesPublications@nrc-cnrc.gc.ca. If you wish to email the authors directly, please see the first page of the publication for their contact information.
https://publications-cnrc.canada.ca/fra/droits
L’accès à ce site Web et l’utilisation de son contenu sont assujettis aux conditions présentées dans le site
LISEZ CES CONDITIONS ATTENTIVEMENT AVANT D’UTILISER CE SITE WEB.
Research Report (National Research Council of Canada. Institute for Research in Construction), 2004-03-01
READ THESE TERMS AND CONDITIONS CAREFULLY BEFORE USING THIS WEBSITE.
https://nrc-publications.canada.ca/eng/copyright
NRC Publications Archive Record / Notice des Archives des publications du CNRC :
https://nrc-publications.canada.ca/eng/view/object/?id=996b19a5-6cde-4a65-8d6a-6402a97c9cb5 https://publications-cnrc.canada.ca/fra/voir/objet/?id=996b19a5-6cde-4a65-8d6a-6402a97c9cb5
NRC Publications Archive
Archives des publications du CNRC
For the publisher’s version, please access the DOI link below./ Pour consulter la version de l’éditeur, utilisez le lien DOI ci-dessous.
https://doi.org/10.4224/20378364
Access and use of this website and the material on it are subject to the Terms and Conditions set forth at
Speech and Noise Levels Associated with Meeting Rooms
Speech and Noise Levels Associated with Meeting Rooms Bradley, J.S.; Gover, B.N. IRC-RR-170 March 2004 http://irc.nrc-cnrc.gc.ca/ircpubs
Speech and Noise Levels
Associated with Meeting Rooms
John S. Bradley and Bradford N. Gover
IRC Research Report, IRC RR-170
March 2004
Contents
Page
Summary 2
Acknowledgements 3
1. Introduction 4
2. Speech Levels During Meetings 5
2.1 Measurement Procedure 5
2.2 Average A-Weighted Speech Levels 7
2.3 More Detailed Effects 9
2.4 Speech Levels for Speech Security Design Calculations 12
3. Noise Levels Near Meeting Rooms 16
3.1 Measurement Procedure 16
3.2 A-Weighted Ambient Noise Levels 16
3.3 One-Third Octave Band Noise Spectra 18
3.4 Background Noise Spectra for Speech Security Design 22
4. Conclusions 23
References 24
Summary
Architectural speech security refers to the inability of eavesdroppers to hear speech sounds from nearby meeting rooms and offices where confidential material is being discussed. (Here ‘architectural’ refers to the security provided by the building structure and associated building systems such as ventilation systems). The audibility of speech sounds from meeting rooms will depend on how loud the transmitted speech sounds are relative to the existing ambient noise levels. It is therefore necessary to know the values of typical speech levels generated in meeting rooms and the levels of typical ambient noises in spaces near meeting rooms.
This report presents the results of extensive measurements of speech sounds in meeting rooms and ambient noises in nearby spaces. The probability of various speech and noise levels occurring is reported and recommendations are made for using these results in calculations to estimate the architectural speech security of particular offices and meeting rooms.
An average speech spectrum shape is determined from previously published results and adjusted to be representative of the speech levels found in the present study.
Measurements of the 1/3 octave band spectra of a large number of noises in office buildings are used to derive a representative spectrum shape for ambient noise in office buildings. Combining this spectrum shape with a noise level having the desired
probability of occurrence provides an ambient noise spectrum for use in architectural speech security calculations.
With the new knowledge of the probability of occurrence of various speech and noise levels and a representative spectrum shape for the speech and noise, two basic
components for the calculation of expected speech security are now established. Further work will develop procedures for predicting and measuring the transmission of speech sounds from the meeting rooms to points just outside these rooms.
For most purposes, these results can be simplified to the following two recommendations for speech and noise levels to be used in calculating the expected level of speech security.
• For situations requiring normal security, a speech level of 65 dBA and an ambient noise level of 30 dBA can be assumed appropriate as this combination would occur no more than 1% of the time. Therefore, a room designed to provide adequate attenuation in combination with these speech and noise levels would be speech secure for 99% of the time.
• For situations requiring high security, a speech level of 70 dBA and an ambient noise level of 25 dBA is more appropriate. This combination of speech and noise levels would result in speech security for about 99.96% of the time for an
Acknowledgments
This project was jointly funded by Public Works and Government Services Canada (PWGSC), the Royal Canadian Mounted Police (RCMP) and the National Research Council (NRC). PWGSC and RCMP personnel were also instrumental in finding suitable rooms for all of the measurements. In particular the authors would like to thank Don Nixon and Bonnie Belwa (at PWGSC) who made this all happen because of their
considerable efforts. The authors also gratefully acknowledge the dedicated efforts of Mr. Chris Garand who carried out all of the measurements and the initial analyses of the results presented in this report while on an engineering coop work term at NRC.
1. Introduction
Architectural speech security refers to the inability of eavesdroppers to hear speech sounds from meeting rooms and offices where confidential material is being discussed. Here ‘architectural’ refers to the security provided by the building structure as well as building systems such as heating and ventilation. It does not include the effects of electronic modification of the speech sounds except for the case of conventional speech amplification systems in meeting rooms.
The audibility of speech sounds in spaces adjacent to meeting rooms depends on how loud the transmitted speech sounds are relative to existing ambient noise levels. In order to estimate the levels of transmitted speech sounds we need to have information on typical speech levels in meetings along with the transmission characteristics of the walls and other components of the periphery of the meeting room. The purpose of the work reported here was to acquire information on the levels of speech found in a variety of meeting rooms and the characteristics of typical ambient noises in spaces near the meeting rooms. The probability of various speech and noise levels occurring is reported, and recommendations are made for using these results in calculations to estimate the architectural speech security of particular offices and meeting rooms.
The spectral characteristics of speech are well known for both male and female talkers at various levels of vocal effort. However, we are less clear about the overall levels of speech sounds that would typically be incident on the boundaries of meeting rooms. Accordingly, A-weighted speech levels were logged at 10 s intervals at several positions in a wide range of meeting rooms both with and without sound amplification systems. From these 10 s A-weighted energy average sound level (Leq) measurements, we can determine the probability of various speech levels occurring in meeting rooms. Because we might expect different speech levels where sound amplification is present, the results for amplified and non-amplified meetings are considered separately. Various parameters related to the meeting room size are also considered as possible predictors of the
measured speech levels.
Ambient noise levels near meeting rooms were expected to vary with the time of day as well as with the location of the noise measurement relative to particular sources of noise. Of course, each particular source of noise could have quite different spectral
characteristics. Two types of noise measurements were used to acquire the ambient noise data presented in this report. Sound level loggers were used to get measures of
A-weighted Leq values of ambient noise at 10 s intervals throughout complete 24 hour periods. These loggers were located in the meeting rooms. Ambient noise levels in the intervals between meetings and throughout the evening and night time periods were expected to be similar to those at locations just outside these rooms. To gain information on the spectral characteristics of the ambient noise, 1/3 octave band ambient noise level measurements were made at many locations near meeting rooms and at various times of the day and evening. These were classified as one of five types of noises and average noise spectra calculated for each type of noise. It is thus possible to indicate the
probability of various noise levels occurring for various time-of-day periods and to give representative spectra for common types of noises found in office buildings.
2. Speech Levels During Meetings
2.1 Measurement Procedure
Speech levels were recorded during 79 different meetings, in 32 different rooms, located in 8 different buildings of a variety of ages and construction styles. Table 1 summarises the range of meeting room sizes and numbers of people present in the meetings.
Complete details of each meeting room are included in the Appendix to this report. Number of meeting room cases* measured 32
Number of meetings measured 79
Number of people in each meeting 2 to 300 people
Range of room volumes 39 to 16,000 m3
Range of room floor areas 15 to 570 m2
Table 1. Summary of meeting rooms measured. ( * includes 30 different rooms, 2 of which were measured with and without sound amplification systems).
Sound levels were recorded using Bruel and Kjaer (type 2236) integrating sound level meters which could log results for each 10 s interval over complete 24 hour periods. The units were fitted with a large external battery to make it possible to run without
interruption for more than 24 hours. The sound level loggers were located at 4 different positions in each room as indicated in the details of the Appendix. Mostly the loggers were located around the periphery of the room to evaluate speech levels incident on the walls and other surfaces bounding the room. In some cases loggers were also located on the meeting room tables. The two types of data are compared in this report. The sound level loggers calculated 3 different quantities for each 10 s interval over a complete 24 hour period. These were energy average sound levels (Leq), the level exceeded 10% of the time (L10) and the level exceeded 90% of the time (L90). All values (L10, L90 and Leq) correspond to A-weighted sound levels. The Leq values are used to indicate speech levels during each 10 s interval. The L90 values, obtained during meetings, are later shown to be representative of the general ambient noise levels. The data obtained for times of the day when there were no meetings is considered in the second half of this report as measures of ambient noise levels.
Knowledge of when the meetings occurred, together with the 24 hour records, made it possible to identify data corresponding to speech levels during meetings. Figure 1(a) shows an example of a complete 24 hour time history of the 10 s Leq values from one logger. Two meeting events are easily identified. One of these is shown enlarged in panel (b) of this graph. By knowing the correct start and finish time for each meeting, the noise of people entering and leaving could be excluded. Figure 1(a) also indicates how ambient noise levels change during the evening and night periods. In this figure there is evidence of ambient noise levels systematically varying, perhaps due to a ventilation system cycling on and off or between modes. Sometime after midnight, there is a stepped reduction in recorded Leq values presumably due to a cut back in the ventilation system. Data such as these were used to assess ambient noise levels as a function of the time of day in the second half of this report.
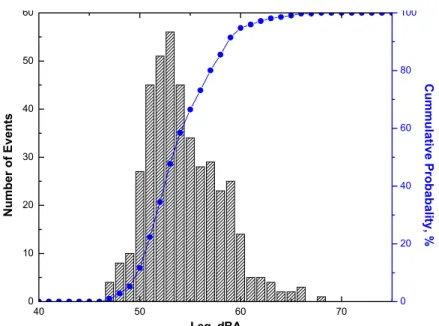
The sound levels during a meeting such as illustrated in Figure 1(b) vary somewhat randomly with time, and they must be considered in a statistical manner. Accordingly, Figure 2 shows the distribution of Leq values taken from the meeting shown in Figure 1(b). Figure 2 shows the distribution of Leq values in terms of the number of
occurrences of each level and also as a cumulative probability distribution. From the cumulative probability distribution in this figure, one can directly read off the probability of a particular speech level being exceeded during this meeting. For example, one can determine from Figure 2 that speech levels (in terms of 10 s Leq values) are no more than 58.5 dBA for 90% of the time. Similar statistical distributions were calculated for each of the 4 sets of logger data from all 79 meetings.
For the meeting results in Figure 2, the meeting-average Leq (energy average sound level) for the complete meeting is 55.8 dBA. The standard deviation of the distribution of 10 s Leq values for this meeting was 3.6 dBA. In this report meeting-average speech Leq values are first used to discuss several more general effects and then the statistics of the more detailed 10 s speech Leq values are used to derive criteria for speech security.
08:00 12:00 16:00 20:00 24:00 28:00 32:00 40 50 60 70 (b) Le q, dB A Time, hours:minutes Ventilation system cycling Ventilation system cut back 09:00 09:30 10:00 10:30 40 50 60 70 Time, hours:minutes meeting #2 L eq, dB A meeting #1 (a)
Figure 1. Recorded time history of 10 s Leq values from one logger, (a) complete 24 hour period, (b) enlarged portion for one meeting. (Hours greater than 24 indicate next day).
40 50 60 70 0 10 20 30 40 50 60 Leq, dBA Number of Ev en ts 0 20 40 60 80 100 C u mmulative Probabali ty , %
Figure 2. Distribution of 10 s Leq values from meeting shown in Figure 1(b) as a histogram of the number of times each value occurred (left hand axis) and a cumulative probability plot (right hand axis).
2.2 Average A-Weighted Speech Levels
The overall Leq values for each logger and over the duration of each meeting were first calculated. Then meeting-average Leq values were determined by calculating averages of the Leq values from the 4 loggers at each of the 79 meetings. Finally overall average Leq values for various subgroups of meetings were determined. These values along with the corresponding standard deviations are given in Table 2. The standard deviations indicate the variation among the meeting-average values for each meeting subgroup.
Condition Meeting-average speech level, Leq, dBA Standard deviation, dBA Number of meetings, N All meetings 60.7 4.1 79
All amplified meetings 62.0 4.5 29
All Non-amplified meetings 60.0 3.4 50
Non-amplified small rooms 61.1 2.6 26
Non-amplified large rooms 58.3 3.4 24
Amplified:
single loudspeaker system
62.1 4.4 14
Amplified:
multiple loudspeaker system
61.8 4.8 15
Table 2. Meeting-average sound levels (Leq, dBA) for various amplified and non-amplified conditions with the standard deviation of each group of N meetings.
Meetings with sound amplification systems in use have, on average, slightly louder speech levels near the room boundaries than those without amplification but the
difference is only 2.0 dBA. This seems to indicate that sound amplification systems are generally used to bring up speech levels near the room boundaries to be similar to those found in smaller rooms without amplification. (Further results below show that when amplified and non-amplified speech levels are compared for the same room, much larger differences are found).
For non-amplified meetings, speech levels are approximately 3 dBA higher in smaller meeting rooms than in larger ones. (Smaller rooms corresponded to those with room volumes less than 100 m3). This is simply due to the microphones used to take these measurements being closer to the talkers in smaller rooms, and smaller rooms having less sound absorptive material to absorb reflected speech sounds.
As a rough estimate of speech levels in meetings, one could use the Leq values from Table 2 or possibly add on 1 or 2 standard deviations to these levels to estimate less frequently occurring extremes. For example, one could assume a conservative estimate of speech levels for speech security design to be the overall average Leq value (60.7 dBA) plus 2 standard deviations higher, to give a final value of 68.9 dBA. However, the probability of various speech levels occurring is derived from the complete distributions of recorded speech levels in Section 2.4.
During the daytime recordings, there were periods with meetings and others without meetings. The periods with meetings provide measures of speech Leq values. The periods without meetings provide Leq values indicative of daytime ambient noise levels.
Additionally, L90 values (such as those obtained during meetings) are often assumed to be representative of more constant ambient noise levels. This idea was tested by
comparing L90 values obtained for periods during meetings with Leq values for daytime periods without meetings in the same room. The results of these comparisons are given in Table 3. On average, the L90 values obtained during meetings are a very good estimate of the general ambient noise levels.
Measure Mean value Standard
deviation
Number of measurements
L90 during meeting 49.4 3.3 149
Leq of ambient noise between meetings
49.3 4.5 57
Table 3. Comparison of ambient noise measurements from daytime L90 values (during meetings) and Leq values (between meetings, i.e. no meeting).
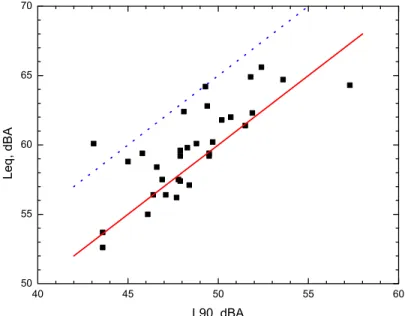
Figure 3 plots the meeting-average Leq values of the speech sounds versus the
corresponding L90 values. Since the L90 values are representative of the ambient noise levels, the differences between speech Leq values and these L90 values are indicative of the speech-to-noise ratios in these rooms. For good speech intelligibility in the meeting room, speech levels should be at least 10 dB higher than the noise levels and preferably 15 dB higher [1]. The solid line in Figure 3 indicates where the speech Leq values would
be 10 dB greater than the L90 values and the dashed line shows where speech levels would be 15 dB greater than the noise levels. These results are important for
understanding speech intelligibility issues within meeting rooms, but also are indicative of how speech security problems are increased by increased meeting room noise levels. First, within the meeting room the results show that as noise levels (given by L90 values) increase, speech levels also increase. This is known as the Lombard effect; people
naturally raise their voice levels to try to overcome ambient noise problems. In these results they are generally successful in attaining moderately acceptable conditions (approximately 10 dB speech-to-noise ratio) but very few examples indicate excellent conditions.
Because increased meeting room noise levels force talkers to use higher voice levels, the speech security problem is also made worse. Rather than solving this architecturally by increased sound attenuation requirements for room the boundaries to obtain a particular level of speech security, it may well be much less expensive to provide a quieter
mechanical system in the meeting room. A quieter meeting room is also the preferred solution functionally because raising voice levels over prolonged periods can lead to voice strain and listeners can communicate more accurately and comfortably in quieter conditions. In this case the functional requirements for speech security and the people using the room coincide.
40 45 50 55 60 50 55 60 65 70 Leq, dBA L90, dBA
Figure 3. Meeting-average speech levels (Leq) versus ambient noise levels in the meeting rooms (L90). The solid line shows situations with a 10 dB speech-to-noise ratio and the dashed line shows the more ideal case of a 15 dB speech-to-noise ratio.
2.3 More Detailed Effects
This section considers three types of more detailed effects. These are: (a) the differences in speech levels recorded at microphones on meeting room tables versus values from those located nearer to the periphery of the rooms, (b) the effects of sound amplification
systems on speech levels in rooms with and without these systems operating, and (c) investigations of various possible systematic variations of speech levels with parameters related to meeting room size. These are all found to be side issues and this section can be omitted by those not interested in these topics.
Comparison of speech levels measured on meeting room tables and near room boundaries
In a number of the rooms one or two of the four loggers were located on the meeting room table in front of the talkers. The levels from the table locations were on average 3.6 dBA higher than from loggers located closer to the periphery of the room. This was the average of the differences for 26 meetings in 11 different rooms and included 30
measurements at on-table locations and 79 locations nearer to the periphery of the room. (The Appendix shows the location of the loggers in each room). Speech levels measured at locations on the meeting room tables were higher simply because they were closer to the talkers and due to the effects of sound reflected from the table. Since these higher levels are not as representative of the levels incident on the boundaries of the room, they were not used in further analyses.
Effects of Sound Amplification on Speech Levels
In two of the rooms, meetings were recorded both with and without sound amplification systems present. In these two moderately large rooms (521 and 520 m3), the sound amplification increased the meeting-average speech levels by about 10 dB, as given in Table 4. In the non-amplified cases, an average speech level of 52.7 dBA measured near the boundaries of the room would not be sufficiently loud for listeners. However, smaller groups of listeners seated closer to the talker would experience higher sound levels than were measured near to the boundaries of the room. The sound amplification systems were quite effective, and were, quite correctly, adjusted to provide near natural or slightly enhanced speech levels at more distant locations within the meeting rooms.
Room Non-amplified
meeting (Leq, dBA)
Amplified meeting (Leq, dBA) Difference (Leq, dBA) Annex (Conference Centre) 52.8 64.9 12.1 Centennial (Conference Centre) 52.6 61.4 8.8 Average 10.8
Table 4. Meeting-average speech levels measured with and without sound amplification systems in two rooms.
Systematic Effects of Room Size
Various possible systematic effects of room size on measured speech levels were tested to examine possible more accurate techniques for estimating expected speech levels for particular room conditions. For example, if lower speech levels were associated with larger rooms it could be possible to more precisely estimate expected speech levels as a function of room size. To look for this type of effect, speech levels and the variation of levels within each room were plotted versus various parameters related to meeting room size and listed in Table 5.
Quantity Units
Meeting room volume m3
Meeting room floor area m2
Volume density of people Number of people/ m3
Area density of people Number of people/ m2
Number of people Number
Table 5. Variables considered for possible systematic variation of speech levels with meeting room details.
In general there were very few significant systematic effects. However, measured speech levels did systematically decrease with room size for non-amplified meetings. Figure 4 plots meeting-average speech Leq values versus room volume for these non-amplified meeting cases. The largest rooms with volumes of about 500 m3 had average speech levels approximately 5 dB lower than the smaller rooms. A similar but less significant effect was found when the same data were plotted versus the meeting room floor area. Although this effect seems quite real and understandable, it is not recommended to include this in subsequent speech security calculations. One might estimate speech levels to be 5 dB lower in larger rooms. However, on many occasions, these same larger rooms would have sound amplification systems in use and speech levels would not show this reduction. For rooms with sound amplification in use, there were no systematic effects of room size. 0 100 200 300 400 500 600 45 50 55 60 65 70 Leq, dB A Volume, m3 Leq = -0.0126 Volume + 61.5 R2 = 0.453
Figure 4. Plot of meeting-average speech Leq values versus meeting room volume for meetings without sound amplification systems.
Figure 5 shows results that indicate how the spatial variations of speech levels within meeting rooms vary with room size for meetings without sound amplification systems. The speech levels in the smaller rooms, with room volumes less than 100 m3, are shown by different symbols than for the larger rooms.
0 100 200 300 400 500 600 0 1 2 3 4 5 Spatial dev iatio n, dB Volume, m3
Figure 5. Plot of the spatial variation of speech levels in meeting rooms versus meeting room volume for meetings without sound amplification systems.
In the smaller rooms there are greater spatial variations of the measured speech levels. This is because some talkers could be quite close to one of the microphones leading to higher sound levels than measured at other microphones. In the larger rooms, the talkers tended to be a little further from the microphones which were intended to record speech levels incident on the room boundary. For the larger rooms there is a small increase in the spatial variation with increasing room size. That is, within the largest rooms (without sound amplification) there is a little more variation in speech levels.
The implications for speech security are that exceptionally high speech levels near the room boundaries are more likely to occur in smaller meeting rooms because some talkers may be located close to the periphery of the room.
2.4 Speech Levels for Speech Security Design Calculations
The main goal of the speech level measurements was to be able to describe the
probability of various speech levels occurring in typical meeting rooms. In doing this, the small systematic effects discussed in the previous section have been ignored as not appropriate for deriving safe estimates of likely speech levels for architectural speech security calculations. Although overall speech levels were on average only 2 dB higher for meetings with sound amplification, the probabilities of various speech levels
occurring have been determined separately for amplified and non-amplified meetings as well as for the group of all meetings.
40 50 60 70 80 0 20 40 60 80 100 95th F requency of occurence, % Leq, dBA All Non-amplified Amplified (a) 90th 55 60 65 70 75 70 80 90 100 98th (b) All Non-amplified Amplified Leq, dBA F requency of occurence, %
Figure 6. Cumulative probability curves obtained from all 10 s speech Leq values as well as separate results for all amplified and all non-amplified meetings (all measured near the room boundaries). Panel (b) shows an enlarged version of the upper portion of the complete distributions and indicates the 90th, 95th and 98th percentile levels .
The probabilities of the occurrence of various speech levels were obtained by calculating cumulative probability distributions similar to that in Figure 2, but for the speech data from all 79 meetings. For non-amplified meetings there were a total of 66,366 ten-second speech Leq values, for the amplified meetings there were 44,415 Leq values and for the combined data there were 110,781 Leq values. The resulting cumulative probability curves are included in Figure 6. Figure 6(a) shows the complete distributions and Figure 6(b) shows an enlarged version of the critical upper parts of the curves.
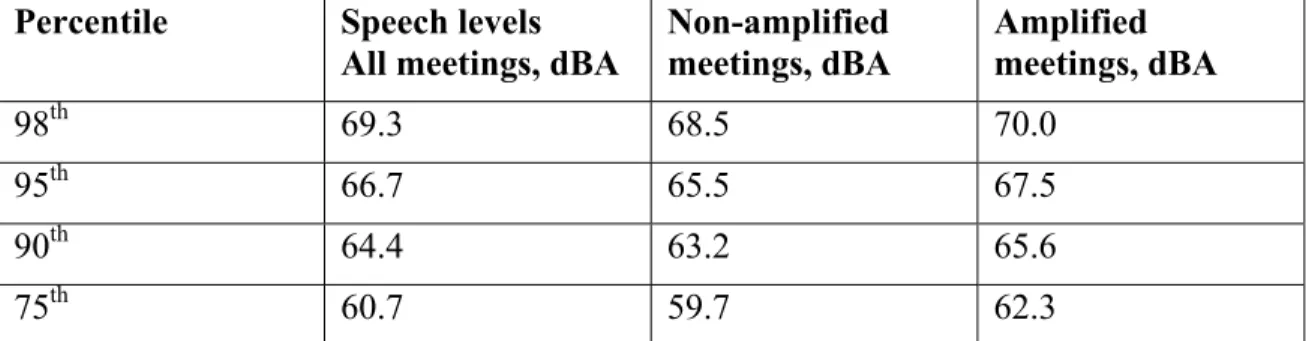
One can read off the probability of various speech levels occurring directly from these graphs. For example, the combined data indicates that the 90th percentile is about 64.4 dBA. That is, only 10% of the values exceed a speech level of 64.4 dBA near the room boundaries. Similarly only 5% of the values exceed 66.7 dBA and only 2% of the speech levels exceed 69.3 dBA. One can similarly read off slightly lower values for the non-amplified cases and a little higher values for the non-amplified meeting cases. These are all listed in Table 6.
Percentile Speech levels All meetings, dBA
Non-amplified meetings, dBA Amplified meetings, dBA 98th 69.3 68.5 70.0 95th 66.7 65.5 67.5 90th 64.4 63.2 65.6 75th 60.7 59.7 62.3
Table 6. Percentile values for speech levels from cumulative probability plots of Figure 6. These indicate the percentage of values below each of these levels. That is, for the All meetings category, 95% of the values are 66.7 dBA or less. Conversely 5% of the values for this case exceed 66.7 dBA.
Having established the probability of various speech levels occurring in meeting rooms, it is next necessary to associate a complete speech spectrum with these levels. Data by Pearsons et al. [2] provide comprehensive results to characterize the spectrum of speech for males and females and for varied vocal effort. These data are included in Table 7. The overall average meeting room speech level in this report in Table 2 (60.7 dBA) is between the Normal and Raised vocal effort in the Pearsons report. However, the
meeting room levels were measured several metres from the talker in meeting rooms and Pearsons’ data were measured at a distance of 1 m in a free field condition. Higher levels would be obtained in the meeting rooms at positions closer to the talker. Therefore, Pearsons’ Raised voice spectra are used as approximately correct to represent the spectrum shape of speech sounds in meeting rooms for speech security calculations. No correction was made for possible frequency dependent effects of sound absorbing
materials in the room because the measured sound absorption values in 11 meeting rooms did not vary greatly with frequency [3]. An average Raised voice level spectrum was calculated by averaging male and female spectra for the Raised voice data in Table 7. This new average spectrum is also given in Table 7 and in Figure 7.
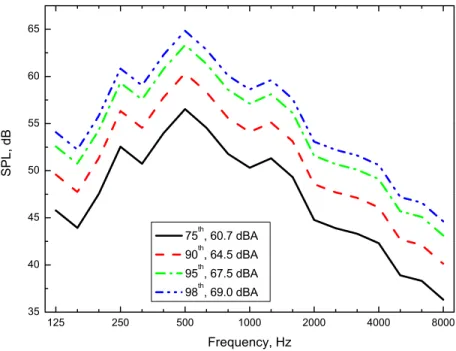
In Figure 7, this average spectrum is plotted corresponding to various percentile speech levels. The lowest curve in Figure 7 corresponds to the overall average Leq of 60.7 dBA, which also corresponds to the 75th percentile in Figure 6. Also shown in Figure 7 is the same average design speech spectrum adjusted to correspond to the 90th , 95th and 98th percentiles of the measured meeting room speech levels. Speech security calculations can be made using this average spectrum shape and adjusting it to match a specific percentile speech level according to the degree of speech security required.
Frequency, Hz 125 160 200 250 315 400 500 630 800 1k 1.2 k 1.6k 2k 2.5k 3.1k 4k 5k 6.3k 8k dBA Females Casual 26 36 47 44 39 45 45 44 39 36 36 36 35 31 30 30 30 32 33 50 Normal 26 37 48 47 42 49 50 48 46 42 43 42 38 36 38 40 36 36 34 55 Raised 25 35 48 53 49 53 57 55 54 52 53 52 47 45 45 45 42 40 39 63 Loud 20 34 45 55 55 55 59 62 62 61 62 62 57 54 53 53 49 47 45 71 Shouted 20 30 40 50 55 61 64 68 70 72 74 74 70 67 67 64 60 57 55 82 Males Casual 44 42 46 46 44 47 48 45 38 37 39 39 35 33 33 35 34 33 32 52 Normal 48 43 48 52 51 53 54 52 46 45 47 44 40 41 41 38 34 35 32 58 Raised 51 49 51 56 55 58 60 58 54 53 54 51 47 47 46 44 40 41 38 65 Loud 50 55 57 60 62 65 68 69 66 65 67 64 59 59 57 55 49 48 46 76 Shouted 42 42 57 66 68 69 74 78 78 78 80 78 73 72 70 68 62 61 59 89
Average Raised Voice Spectrum
44.6 42.7 46.3 51.3 49.5 52.8 55.3 53.3 50.6 49.1 50.1 48.1 43.6 42.7 42.1 41.1 37.7 37.1 35.1 60.7 Table 7. Speech spectra for various voice efforts and for males and females [2] and the calculated average for males and females with Raised voice levels adjusted to 60.7 dBA.
125 250 500 1000 2000 4000 8000 35 40 45 50 55 60 65 SPL , d B Frequency, Hz 75th, 60.7 dBA 90th, 64.5 dBA 95th, 67.5 dBA 98th, 69.0 dBA
Figure 7. New average speech spectrum shape for speech security calculations shown adjusted in level to correspond to various percentile speech levels.
3. Noise Levels Near Meeting Rooms
3.1 Measurement Procedure
Two types of ambient noise level measurements were made. The same sound level loggers used to record meeting room speech levels also recorded ambient noise levels at times when no meeting was in progress. These data provide an indication of how overall A-weighted noise levels vary throughout the complete 24 hour period (see example in Figure 1). Further measurements included 1/3 octave band levels of ambient noises at a large number of locations near meeting rooms. Each 1/3 octave spectrum measurement was an integration over a 20 s period. The predominant source of ambient noise at each location was also noted. These results provide a basis for describing the spectral
characteristics of typical ambient noises in office buildings. 3.2 A-Weighted Ambient Noise Levels
The overall average ambient noise Leq values, from the in-room loggers, are summarised in Table 8. This shows average A-weighted Leq values of ambient noise for four different time of day periods: day, early evening, late evening, and night. Table 8 also shows the standard deviation of Leq values within each time of day group. These indicate the variations among the room-average noise levels.
The results in Table 8 show that ambient noise Leq values are highest during the day and just over 3 dBA lower during the early evening. The ambient noise levels are lowest during the late evening and night periods.
Measure Day (8:00 – 17:00) Early evening (17:00 – 21:00) Late evening (21:00 – 24:00) Night (24:00- 6:00) Average Leq, dBA 49.1 45.9 43.4 43.1 Standard deviation, dB 4.5 5.0 5.3 5.7
Table 8. Summary of room-average ambient noise levels in terms of Leq values for each period of the day. The standard deviations indicate the variation among the rooms for each category.
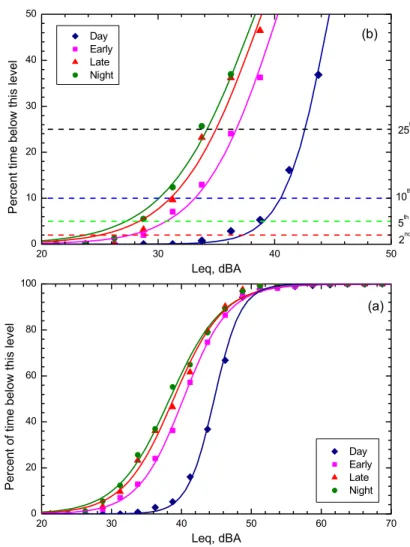
These A-weighted noise level results can be examined in more detail using plots of the cumulative probability of various ambient noise levels occurring within each time of day period. Figure 8 shows the resulting cumulative probability curves for A-weighted ambient noise levels in all of the 32 different meeting rooms. Figure 8(a) shows the complete cumulative probability distributions and Figure 8(b) shows an enlarged view of the critical lower part of the distributions. A number of specific percentile noise levels from Figure 8 are tabulated in Table 9. These include the 2nd , 5th , 10th , and 25th percentile levels for all four time of day periods.
Percentile Day Early evening Late evening Night
25th 43.0 36.5 35.0 34.0
10th 40.5 33.0 31.0 30.0
5th 39.0 31.0 29.0 27.0
2nd 37.0 27.0 25.0 24.0
Table 9. Percentile ambient noise levels for A-weighted 10 s Leq values calculated for 4 time of day periods (rounded to nearest 0.5 dB).
The results in Figure 8 indicate, on average, that a background ambient noise level of 30 dBA (in terms of 10 s Leq values) is exceeded about 90% of the time during the night, 93% of the time during the late evening, 96% of the time during the early evening, and almost all of the time during the day. If one assumes that most meetings occur during the day or early evening and that the 5th percentile level indicates an adequate degree of security, then one should design for the case of ambient noise levels being 31 dBA or higher. 20 30 40 50 60 70 0 20 40 60 80 100 Day Early Late Night Pe rc e n t o f tim e b e low th is le ve l Leq, dBA (a) 20 30 40 50 0 10 20 30 40 50 25th 10th 5th (b) Day Early Late Night Pe rc en t tim e b e lo w th is le vel Leq, dBA 2nd
Figure 8. Cumulative probability plots of A-weighted noise levels for each of four different time of day periods. Figure 8(a) shows the complete curves and Figure 8(b) shows an enlarged version of the more critical lower portion of the distributions.
3.3 One-Third Octave Band Noise Spectra
The results from the sound level loggers give precise results concerning the probability of various ambient noise levels occurring at various times of day. To acquire information about the spectral characteristics of the noise, a total of 347 one-third octave band spectra were measured at locations near meeting rooms and at various times of day. These results were grouped into 5 categories of noise summarized in Table 10.
For each of the five types of noise listed in Table 10, an average spectrum was calculated along with the standard deviations of values in each 1/3 octave band. Figure 9 shows the calculated average spectrum and standard deviations for the ventilation type noises. For reference a simple –5 dB/octave line is also shown. This –5 dB/octave spectrum line is said to approximate a neutral spectrum noise and as indicated in Figure 9 is usually a good approximation to ventilation type noises [4,5].
Type of noise Number of measurements
Ventilation 183
Computer related 24
Indoor road traffic 53
Miscellaneous office 63
Refrigerators and coolers 24
Total 347
Table 10. Summary of 1/3 octave band ambient noise measurements.
Figure 10 shows a similar plot for indoor road traffic noise measurements. Again the results are similar to the –5 dB/octave reference line with small increases at both very low and very high frequencies. The average spectrum and standard deviations for the computer related noises are shown in Figure 11. These noise sources included computer fans, computer printers as well as photo-copiers and fax machines. In this case very low frequency components are reduced relative to the –5 dB/octave reference line. That is these sources have relatively less low frequency energy than does ventilation noise. The results in Figure 12 are for various water coolers and refrigerators including soft drink machines. These devices seem to have pronounced peaks at 125 and 630 Hz but the overall trend again approximately matches the –5 dB/octave reference line. The final example showing the average spectrum for miscellaneous office noises, in Figure 13, is again a good fit to the –5 dB/octave reference line.
63 125 250 500 1000 2000 4000 8000 10 20 30 40 50 60 70 S P L, dB Frequency, Hz
Figure 9. Average spectrum of measured ventilation type noises with standard deviations of results in each 1/3 octave band. Dashed line shows a –5 dB/octave reference line representative of a neutral noise characteristic.
63 125 250 500 1000 2000 4000 8000 10 20 30 40 50 60 70 SP L, dB Frequency, Hz
Figure 10. Average spectrum of measured indoor road traffic type noises with standard deviations of results in each 1/3 octave band. Dashed line shows a –5 dB/octave reference line representative of a neutral noise characteristic.
63 125 250 500 1000 2000 4000 8000 10 20 30 40 50 60 70 SPL , d B Frequency, Hz
Figure 11. Average spectrum of measured computer related noises with standard deviations of results in each 1/3 octave band. Dashed line shows a –5 dB/octave reference line representative of a neutral noise characteristic.
63 125 250 500 1000 2000 4000 8000 10 20 30 40 50 60 70 SPL , d B Frequency, Hz
Figure 12. Average spectrum of measured cooler and refrigerator type noises with
standard deviations of results in each 1/3 octave band. Dashed line shows a –5 dB/octave reference line representative of a neutral noise characteristic.
63 125 250 500 1000 2000 4000 8000 10 20 30 40 50 60 70 SPL , d B Frequency, Hz
Figure 13. Average spectrum of measured miscellaneous office noises with standard deviations of results in each 1/3 octave band. Dashed line shows a –5 dB/octave reference representative of a neutral noise characteristic.
3.4 Background Noise Spectra for Speech Security Design.
While there are some deviations, the average spectra for each of the 5 types of noises all approximate the –5 dB/octave reference spectrum. In only a very small number of cases are the measured 1/3 octave band values more than 1 standard deviation from this line. If the overall average of all of the 5 average spectra is calculated it is very close to a –5 dB/octave spectrum shape.
The –5 dB/octave spectrum shape is therefore recommended for use in speech security design calculations. One should pick a required level of security from the cumulative probability plots in Figure 8 and Table 9, and then use an ambient noise with the overall level determined from Figure 8 and a –5 dB/octave spectrum shape. For this spectrum shape, the overall A-weighted level is 12.1 dB greater than the 1000 Hz 1/3 octave band value. Therefore, if one picked a 30 dBA ambient noise level for design calculations, the ambient noise spectrum would have a 1000 Hz value of 30 - 12.1 = 17.9 dB and a slope of –5 dB/octave.
Figure 14 illustrates examples of ambient noise spectra for architectural speech security design calculations. These examples are for the early evening time period, because this is assumed to be the quietest time of day when meetings are still quite likely to occur. The plot shows the estimated –5 dB/octave ambient noise spectrum adjusted in level to be representative of four different percentile noise levels. The corresponding overall A-weighted levels are those tabulated in Table 9 for the early evening time period.
63 125 250 500 1000 2000 4000 8000 0 10 20 30 40 50 S P L, dB Frequency, Hz 25th 10th 5th 2nd
Figure 14. Ambient noise spectra for architectural speech security calculations corresponding to the 2nd, 5th, 10th and 25th percentile ambient noise levels during the early evening period.
4. Conclusions
The new measurement results and analyses in this report provide a comprehensive basis for estimating the probability of occurrence of various meeting room speech levels and various ambient noise levels near meeting rooms. These can be used as a basis for estimating the speech security of meeting rooms along with information with respect to the estimated sound transmission properties of the walls and other components of the meeting room boundaries.
The new speech measurements have:
• defined an average speech spectrum shape for use in architectural speech security calculations, and
• established the probability of occurrence of various speech levels in meeting rooms.
Using this new information, one can now use this average speech spectrum and adjust the overall level to correspond to the percentile speech level desired to provide the degree of security that is needed. For example, picking a design speech level that only occurs 2% or less of the time (the 98th percentile level) would correspond to higher security than
picking the level that occurs 10% or less of the time (the 90th percentile). However, for many situations a 90th percentile speech level will probably be adequate.
The new ambient noise measurements have:
• shown that a –5 dB/octave spectrum shape is representative of a wide range of noises found in office buildings, and
• established the probability of occurrence of various noise levels in meeting rooms at various times of day.
Using this ambient noise spectrum shape one can now select a noise level corresponding to the degree of security that is needed. For situations where higher security is required, one would assume a lower percentile noise level in calculating the expected degree of architectural speech security. However, in many less critical situations a 10th percentile noise level is probably quite acceptable for predicting expected speech security. If one assumes a speech level that is only exceeded 10% of the time, and a noise level that occurs less than 10% of the time, the combination of these would occur only 1% of the time. Hence, a properly designed room would be speech secure for about 99% of the time. Similarly, if one assumes a speech level that is exceeded less than 2% of the time, and a noise level that occurs less than 2% of the time, the combination of these would occur only 0.04% of the time. Hence, a room designed to provide adequate attenuation in combination with these speech and noise levels would be speech secure for about 99.96% of the time.
For most purposes, these results can be simplified to the following two recommendations for speech and noise levels to be used in calculating the expected level of speech security.
• For situations requiring normal security, a speech level of 65 dBA and an ambient noise level of 30 dBA can be assumed appropriate as this combination would occur no more than 1% of the time. Therefore, a room designed to provide
adequate attenuation in combination with these speech and noise levels would be speech secure for 99% of the time.
• For situations requiring high security, a speech level of 70 dBA and an ambient noise level of 25 dBA is more appropriate. This combination of speech and noise levels would result in speech security for about 99.96% of the time for an
adequately designed room.
References
1. Bradley, J.S., “Acoustical Design of Rooms for Speech”, Construction Technology Update, (51), pp. 6, 2002.
2. Olsen, W.O., “Average Speech Levels and Spectra in Various Speaking/Listening Conditions: A Summary of the Pearsons, Bennett, and Fidell (1977) Report”, Journal of Audiology, vol. 7, 1-5 (October 1998).
3. Room acoustics and sound transmission measurements for 11 meeting rooms will be in a subsequent report for this project.
4. Hoth, D.F., “Room Noise Spectra at Subscribers’ Telephone Locations”, J. Acoust. Soc. Am., vol. 12, 449-504 (1941).
5. Blazier, W.E., “Revised Noise Criteria for Application in the Acoustical Design and Rating of HVAC Systems”, Noise Control Engineering Journal, 16(2), 64-73, (1981).
Appendix. Detailed Descriptions of the Meeting Rooms
Each of the following pages contains detailed descriptions of a meeting room. There are 30 rooms and two of them were measured in two different configurations to give a total of 32 cases. Each page includes the name of the building and the particular room. It also tabulates the approximate dimensions of the room, the room volume in m3, and the floor area in m2. Finally, information about any sound amplification system present and the numbers of people at each meeting that was measured in the room are given.
Each page also includes a sketch plan of the room that shows the locations of key items such as the meeting room tables and chairs. The plan also indicates the location of the measuring sound level loggers as well as the loudspeakers of any sound amplification system in use in the room. The legend below describes the various symbols used in drawing the floor plans. These plans are only approximately to scale with actual dimension included on each plan.
Building Conference Centre
Room Annex
Apox. Room Dimensions (m) 12.25 X 15.0 X 3.1
Approx. Floor Area (m2) 168
Approx. Volume (m3) 521
Amplification Single Speaker
Number of People in Each
Meeting 100, 100, 100, 100
Building Conference Centre
Room Annex Approx. Room Dimensions (m) 12.25 X 15.0 X 3.1
Approx. Floor Area (m2) 168
Approx. Volume (m3) 521
Amplification NO Number of People in Each
Building Conference Centre Room Centennial Approx. Room Dimensions
(m) 12.77 X 9.69 X 4.19
Approx. Floor Area (m2) 124
Approx. Volume (m3) 520
Amplification Multiple Speaker
Number of People in Each
Meeting 25, 25, 25, 25
Building Conference Centre
Room Centennial Approx. Room Dimensions
(m) 12.77 X 9.69 X 4.19
Approx. Floor Area (m2) 124
Approx. Volume (m3) 520
Amplification NO Number of People in Each
Building Conference Centre
Room Colonel By
Approx. Room Dimensions (m) 9.6 X 9.0 X 2.77
Approx. Floor Area (m2) 86.4
Approx. Volume (m3) 239
Amplification NO
Number of People in Each Meeting 30, 30
Building Conference Centre Room Gatineau
Approx. Room Dimensions (m) 10.88 X 10.18 X 3.14
Approx. Floor Area (m2) 111
Approx. Volume (m3) 349
Amplification NO
Building Conference Centre
Room Main Hall
Approx. Room Dimensions (m) 33 X 17.3 X 28
Approx. Floor Area (m2) 570
Approx. Volume (m3) 16000
Amplification Multiple Speaker
Number of People in Each Meeting 60, 60, 60
Building Conference Centre Room Rideau
Approx. Room Dimensions (m) 12.9 X 9.1 X 3.4
Approx. Floor Area (m2) 113
Approx. Volume (m3) 384
Amplification NO
Building Conference Centre Room 305
Approx. Room Dimensions (m) 15.7 X 5.4 X 2.5
Approx. Floor Area (m2) 84.8
Approx. Volume (m3) 212
Amplification NO
Building Conference Centre
Room Sussex Lounge
Approx. Room Dimensions (m) 13.30 X 12.2 X 3.95
Approx. Floor Area (m2) 159
Approx. Volume (m3) 628
Amplification Single Speaker
Building Conference Centre
Room Sussex Room
Approx. Room Dimensions (m) 15.0 X 10.1 X 3.36
Approx. Floor Area (m2) 152
Approx. Volume (m3) 511
Amplification Multiple Speaker
Building M20 Room DGO
Approx. Room Dimensions 6.20 X 4.12 X 2.68
Approx. Floor Area (m2) 25.5
Approx. Volume (m3) 68.3
Amplification NO
Building M20 Room 114
Approx. Room Dimensions (m) 11.25 X 6.70 X 3.02
Approx. Floor Area (m2) 75.4
Approx. Volume (m3) 228
Amplification Single Speaker
Building M20 Room 132
Approx. Room Dimensions (m) 4.78 X 3.96 X 2.96
Approx. Floor Area (m2) 18.9
Approx. Volume (m3) 55.9
Amplification NO
Building M20 Room 134
Approx. Room Dimensions (m) 6.05 X 5.05 X 2.55
Approx. Floor Area (m2) 30.6
Approx. Volume (m3) 78
Amplification NO
Building M24 Room 203
Approx. Room Dimensions (m) 6.23 X 4.25 X3.05
Approx. Floor Area (m2) 26.5
Approx. Volume (m3) 80.8
Amplification NO
Number of People in Each Meeting 4, 6, 5
Room 304
Approx. Room Dimensions (m) 5.14 X 4.23 X 3.02
Approx. Floor Area (m2) 21.7
Approx. Volume (m3) 65.5
Amplification NO
Building M58 Room E101
Approx. Room Dimensions 5.2 X 4.9 X 2.88
Approx. Floor Area (m2) 25.4
Approx. Volume (m3) 73.2
Amplification NO
Building Old City Hall
Room Bytown
Approx. Room Dimensions (m) 17.06 X 12.32 X 2.68
Approx. Floor Area (m2) 193
Approx. Volume (m3) 580
Amplification Single Speaker
Number of People in Each Meeting 25, 25
Building Old City Hall
Room Victoria Hall
Approx. Room Dimensions (m) See plan for approximate dimensions
Approx. Floor Area (m2) 560
Approx. Volume (m3) 3300
Amplification Multiple Speaker
Number of People in Each Meeting 300, 300
Building Place du Portage
Room Outaouais
Approx. Room Dimensions (m) 23.60 X 13.14 X 3.43
Approx. Floor Area (m2) 310
Approx. Volume (m3) 1060
Amplification Multiple Speaker
Building Place du Portage
Room Room 10
Approx. Room Dimensions (m) 13.12 X 5.97 X 2.69
Approx. Floor Area (m2) 78.3
Approx. Volume (m3) 211
Amplification Single Speaker
Number of People in Each Meeting 21, 21
Building Sparks St.
Room 2nd Floor Office
Approx. Room Dimensions (m) 4.36 X 3.88 X 2.58
Approx. Floor Area (m2) 16.9
Approx. Volume (m3) 43.6
Amplification NO
Building Sparks St.
Room 3rd Floor Office
Approx. Room Dimensions (m) 3.73 X 4.72 X 2.55
Approx. Floor Area (m2) 15.3
Approx. Volume (m3) 39
Amplification NO
Number of People in Each Meeting 3
Building Sparks St.
Room Fisher Boardroom
Approx. Room Dimensions (m) 10.3 X 6.0 X 2.5
Approx. Floor Area (m2) 61.8
Approx. Volume (m3) 155
Amplification NO
Building Sparks St. Room 127
Approx. Room Dimensions (m) 6.98 X 4.37 X 2.59
Approx. Floor Area (m2) 30.5
Approx. Volume (m3) 79
Amplification NO
Building Sparks St. Room 226
Approx. Room Dimensions (m) 6.80 X 3.28 X 2.61
Approx. Floor Area (m2) 22.3
Approx. Volume (m3) 58.2
Amplification NO
Building Sparks St. Room 315
Approx. Room Dimensions (m) 6.55 X 3.45 X 2.55
Approx. Floor Area (m2) 22.6
Approx. Volume (m3) 57.6
Amplification NO
Building Sparks St. Room 328
Approx. Room Dimensions (m) 6.94 X 3.88 X 2.55
Approx. Floor Area (m2) 26.1
Approx. Volume (m3) 66.6
Amplification NO
Building Sparks St. Room 401
Approx. Room Dimensions (m) 6.80 X 4.65 X 2.60
Approx. Floor Area (m2) 31.6
Approx. Volume (m3) 82.2
Amplification NO
Room 214
Approx. Room Dimensions (m) 14.10 X 8.53 X 2.72
Approx. Floor Area (m2) 120
Approx. Volume (m3) 327
Amplification Multiple Speaker
Building West Block Parliament Buildings
Room Room 200
Approx. Room Dimensions (m) 23.40 X 14.46 X 8.32
Approx. Floor Area (m2) 338
Approx. Volume (m3) 2810
Amplification Multiple Speaker