Publisher’s version / Version de l'éditeur:
Proceedings of the American Society for Testing and Materials, 60, pp.
1151-1165, 1961-07-01
READ THESE TERMS AND CONDITIONS CAREFULLY BEFORE USING THIS WEBSITE. https://nrc-publications.canada.ca/eng/copyright
Vous avez des questions? Nous pouvons vous aider. Pour communiquer directement avec un auteur, consultez la première page de la revue dans laquelle son article a été publié afin de trouver ses coordonnées. Si vous n’arrivez pas à les repérer, communiquez avec nous à PublicationsArchive-ArchivesPublications@nrc-cnrc.gc.ca.
Questions? Contact the NRC Publications Archive team at
PublicationsArchive-ArchivesPublications@nrc-cnrc.gc.ca. If you wish to email the authors directly, please see the first page of the publication for their contact information.
NRC Publications Archive
Archives des publications du CNRC
This publication could be one of several versions: author’s original, accepted manuscript or the publisher’s version. / La version de cette publication peut être l’une des suivantes : la version prépublication de l’auteur, la version acceptée du manuscrit ou la version de l’éditeur.
Access and use of this website and the material on it are subject to the Terms and Conditions set forth at
The Importance of freezing rate in frost action in soils
Penner, E.
https://publications-cnrc.canada.ca/fra/droits
L’accès à ce site Web et l’utilisation de son contenu sont assujettis aux conditions présentées dans le site LISEZ CES CONDITIONS ATTENTIVEMENT AVANT D’UTILISER CE SITE WEB.
NRC Publications Record / Notice d'Archives des publications de CNRC:
https://nrc-publications.canada.ca/eng/view/object/?id=f7f0f24a-7e0a-4a3e-93de-f061c7b60001 https://publications-cnrc.canada.ca/fra/voir/objet/?id=f7f0f24a-7e0a-4a3e-93de-f061c7b60001
S e r
T
H1
N2lr2 no. 126 c . 2NATIONAL
RESEARCH
COUNCIL
CANADA
DIVISION O F BUILDING RESEARCH
THE IMPORTANCE OF FREEZING RATE
I N FROST ACTION IN SOILS
BY E. PENNER
REPRINTED FROM
PROCEEDINGS O F THE AMERICAN SOCIETY FOR TESTING MATERIALS VOL. 60, 1960. P. 1151
-
1165.RESEARCH PAPER NO. 126 O F THE
DIVISION O F BUILDING RESEARCH
PRICE 2 5 CENTS
$-yr&zss
OlTAWA
T h i s publication i s being d i s t r i b u t e d by the Division of Building R e s e a r c h of the National R e s e a r c h Council. It should not be r e p r o d u c e d in whole or i n p a r t , without p e r m i s - s i o n of the o r i g i n a l publisher. The Division would be glad to be of a s s i s t a n c e i n obtaining s u c h p e r m i s s i o n .
Publications of the Division of Building R e s e a r c h m a y be obtained by mailing the a p p r o p r i a t e r e m i t t a n c e , ( a Bank, E x p r e s s , o r P o s t Office Mane-y O r d e r o r a cheque m a d e p a y - able a t p a r in Ottawa, to the R e c e i v e r G e n e r a l of Canada, c r e d i t National R e s e a r c h Council) to the National R e s e a r c h Council, Ottawa. Stamps a r e not a c c e p t a b l e .
A coupon s y s t e m has been i n t r o d u c e d to m a k e pay- m e n t s for publications r e l a t i v e l y s i m p l e . Cgupons a r e a v a i l - able in denominations of 5, 2 5 and 50 c e n t s , and m a y be ob- tained by making a r e m i t t a n c e a s indicated above. T h e s e coupons m a y be u s e d for the p u r c h a s e of a l l National R e s e a r c h Council publications including specifications of the Canadian Government Specifications B o a r d .
Authorized Reprint from the Copyrighted Proceedings oi the
A Y E R I C ~ N SOCIETY FOR TESTING MATERIALS
Philadelphia, Pa. Volume 60, 1960
ANALYZED
T H E I M P O R T A N C E O F F R E E Z I N G R A T E IN FROST ACTION I N SOILS*
BY E . PENNER'
This study was concerned with determining the effect of rate of freezing on frost action under laboratory conditions. This was done for the saturated and near-saturated moisture conditions of the soil. The rate of freezing was measured both in terms of heat flow and rate of frost penetration. Three soils of widely differing properties were used to bring out major differences in behavior to freczing.
The results show a positive relation between net heat flow or frost pene- tration rate and heaving rate. Increasing the rate of heat flow away from the freezing plane in all cases increased the rate of moisture flow to the freezing plane and consequently also the heaving rate. This was shown to be true for the three soils studied a t high moisture contents.
I t is not correct to compare the frost susceptibility of different soils in laboratory freezing experiments on the basis of equal rates of frost penetration when, in fact, this does not occur in the field. The rate of heat extraction used in laboratory tests of frost heaving should be related to the actual heat flow in the environment of the soil.
The results presented should be useful in setting up practical laboratory freezing procedurcs for the realistic evaluation of the frost susceptibility of soils in the field.
With the commonly used frost action criteria based on grain-size distribution, it is not always possible under field con- ditions to predict the frost susceptibility of all soil materials As a n alterna- tive, the field performance of these soils might be determined from a laboratory freezing experiment, which approach is now fairly common practice in soil engineering.
Resorting to such performance freez- ing experiments is a n admission that
*
Presented at the Sixty-third Annual Mect. ing of the Society, June 27-July 1 , 1960.Rcscarch Officer, Soil Mechanics Section, Division of Building Research, National Re- search Council, Ottawa, Canada.
The boldface numbers in parentheses refer to the list of refereilces appended t o this paper.
knowledge of the physicochemical char- acteristics of soil is not yet sufficiently advanced to allow prediction of frost susceptibility. This is particularly true of soils which are borderline with respect to grain-size criteria when both freezing temperatures and high-moisture condi- tions exist.
The most pressing problem is the evaluation of the degree of frost suscepti- bility b y a relatively simple a n d meaning- ful laboratory freezing experiment. I n the long run, however, the aim in soil engineering is to develop a better under- standing of the soil characteristics that make a potentially frost heaving soil.
Two of the most important conditions that influence the results of a laboratory
1151
freezing experiment are the rate at which the specimen is frozen and the water supply. The differences between these conditions imposed on a soil specimen in the laboratory as against those that occur naturally in the field are thought to account for the unsatisfactory results often obtained in the past.
The research reported here is an at- tempt to formulate a more realistic basis for laboratory freezing experiments. The main variable studied was the rate of
the rate of freezing (2). After further experiments, he stated "the tests have fully proved, as the previous tests did not fully show, that for a constant pres- sure the rate of heaving is independent of the rate of freezing." H e further stated, "it should be noted, however, that this is completely valid only for relatively permeable soil." Beskow did recognize that for all soils under condi- tions where the frost line was stationary various rates of heave were possible and
L F L E x m L E I N s u L B T l o N GLUED T O P L A T E S
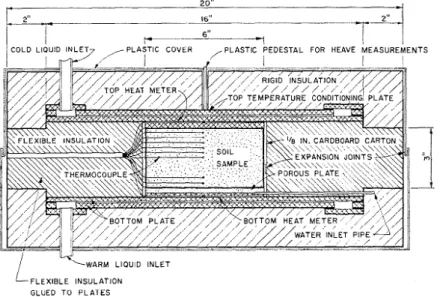
FIG. 1.-Frost Cell MK 11.
freezing at constant-moisture conditions external to the specimen. To a lesser extent. the second variable (water supply) was studied, but much further work is necessary in the unsaturated state, particularly because of the inter- relationship between unsaturated perme- ability and moisture content. Three soils with widely different properties were used to show major differences, if any, in behavior to freezing.
Beskow's early work suggested that the rate of heaving was independent of
dependent on the heat flow, but this did not hold for a penetrating frost line.
The U. S. Army Corps of Engineers state, "rate of heave has been found to be relatively independent of rate of freezing over a range of freezing rates employed in the investigation" (3). This is the basis for the frost susceptibility classiiication that holds for freezing rates between
5
to2
in. frost penetration per day.In recent investigations on the effects of freezing rate on heaving rate for one soil, Higashi @) indicates that heaving
rate varies inversely as the freezing rate metal plates that determined the tem- according to the expression: peratures at the top and bottom of a
d f l d t = 11 - B ( d x / d t ) 3 in. long soil specimen. The 6-in. diam-
eter specimen was contained in a wax- where: impregnated cardboard cylinder closed
d[/dt is the rate of heaving, at the upper end by a metal plate and
dx/dt is the rate of frost penetration, and at the lower end by a porous plate. The
- - -
-
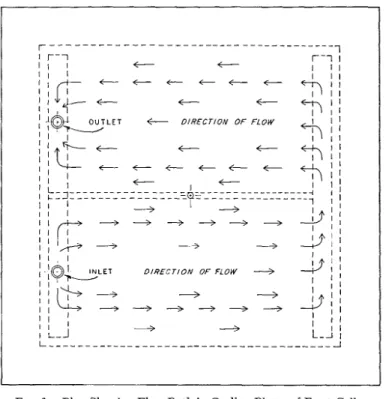
- - - 1 I r-i t t r-1 I I / I I I I t t t t C t C t C t t t t t t t t t t 4 ' - 3 , + + , + + 3 I I I I 1 I L-J 4 3 L - - - _IFIG. 2.-Plan Showing Flow Path in Cooling Plates of Frost Cell. A and B are constants depending on the
original density.
The findings by Higashi are in complete contradiction to results obtained by all other research workers to date.
Previous experiments carried out by the author indicated there was a strong positive correlation between the rate of heat removal and rate of heaving (5).
Descriptiolz of Frost Cell:
The frost cell (Figs. 1 and 2) consisted of two large temperature-conditioned
porous plate was uniformly supplied lvith water through a spiral groove sys- tem in a metal backing plate.
A Gier and Dunkle heat transducer. embedded in an epoxy resin slab $ in. thick, was placed at each end of the specimen holder. The heat meters were calibrated and checked periodically by imposing a known temperature gradient across a 2-in. hard rubber slab for which the thermal conductivity coefficient was accurately known. I n the calibrating system, the heat meters were also placed a t each end of the rubber slab. Calibra- tion was carried out in the same tem-
perature range as the freezing experi- ment.
The temperatures, a t known positions in the soil specimen, were measured using 30-gage constantan-copper thermocou- ples. The thermocouple points were positioned a t various elevations along the center line of the 3 in. long specimen. The holes were drilled a t right angles to the heat flow direction using a long, thin bit in a drill press. Thermocouple and heat meter measurements were recorded with a specially modified high- precision millivolt recorder.
The cylindrical specimen was sur- rounded by 5 in. of glass fiber insulation. This appeared to be sufficient to prevent any appreciable thermal disturbance from the outside. To facilitate heaving and still provide insulation from top to bottom, the glass fiber insulation was glued to the top and bottom plates with ordinary rubber cement. As the soil samples heaved, the "accordion" action of the insulation provided continuous insulation from outside thermal disturb- ances.
The cardboard sample holder was provided with a lap joint one third the distance from the bottom to allow heav- ing at a very low friction between con- tainer and specimen. The joint was sealed with grease to prevent moisture loss as were the holes in the sample holder for the thermocouples. The sys- tem as a whole was checkcd thermally using a number of different heat and moisture flow balances which are de- scribed later.
The plates were temperature condi- tioned by circulating ethylene-glycol mixtures controlled to within &0.05 C. The closeness of the temperature control was considered adequate, as no variation in heat meter output was created by the off-on cycles of heating and cooling. This temperature controlling apparatus has been described in more detail in a previ- ous paper (6).
Constant Water Head Device:
Water was supplied to the specimen from the outside by a plastic tube that fed the demands of the porous plate through a spiral groove system. The water used by the specimen was supplied a t a constant head with an automatic balance especially constructed and ac- curate within f0.01 ml.
The balance consisted of an analytical balance which had one end of the beam fixed through a spring to the balance floor. Hung on the other end of the beam was a plastic water container with a bubbler hole. A soft rubber hose was attached to the container for the water outlet. A variable differential transformer core that was fixed above the spring was adjusted to move not more than f 0.1 in. from the horizontal beam position. The electromotive force output from the secondary was demodulated and re- corded on a standard millivolt recorder. The balance was calibrated periodically and proved to be reliable. The water loss per unit deflection was linear over the complete range of beam displacement. Description of Soil:
The three soil materials selected were of widely differing properties. The clay sample was from the Ottawa Valley marine clay. Both its geology and geo- technical properties have been described by Eden and Crawford (7). A block sample, approximately 1 cu f t in volume, was procured from a depth of 16 ft, which was well below the brown oxidized zone but within the fissured crust.
The soil designated as PFRA silt was procured by The Prairie Farm Re- habilitation Administration from the basement of a partially constructed house in Saskatoon, Sask., which had suffered severe frost action when left unheated during one winter.
The coarsest material was supplied by the Ontario Department of Highways and was obtained from a gravel pit near
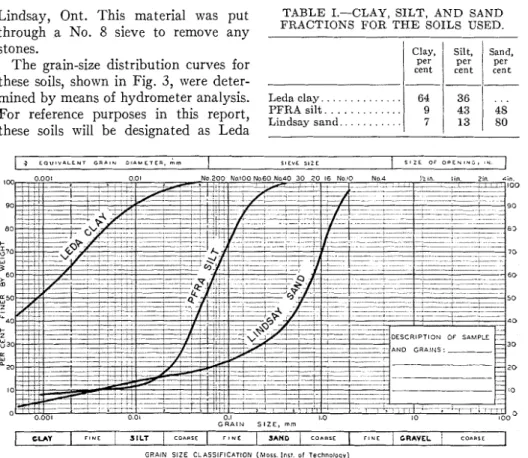
Lindsay, Ont. This material was put TABLE I.-CLAY, SILT, AND SAND through a No. 8 sieve to remove any FRACTIONS FOR THE SOILS USED.
[ 4 r a u ~ v n ~ r ~ i G a n l r r a ~ n u ~ ~ c a , & m I I l E V L S I Z E 5 1 Z L O F O O E N I Y G , I U . stones.
The grain-size distribution curves for these soils, shown in Fig. 3, were deter-
mined by means of hydrometer analysis. Leda clay.. . . . . . .
For reference purposes in this report,
~ ? ' ~ ~ ~ ; ; i , :
: :
:
: : : : :
:
G R A I N S I Z E , m m
C U Y
I
F l w F S I L T / C O A a I CI
r l H EI
SAND / C O I m I EI
F l U E 1 GRAVEL / C O l i l l i1
G R A I N S I Z E C L A S S I F I C A T I O N (hlorr. l n r t o f Technology) FIG. 3.-Mechanical Analysis o f Soils.
clay for the heaviest soil, PFRA silt for the intermediate soil, and Lindsay sand for the coarsest soil. According to the Massachusetts Institute of Technology classification, the percentage clay, silt, and sand are as given in Table I.
these soils will be designated as Leda
Clay,
per
rent 64
Q
Soil Specimen Preparation:
The specimens of Lindsay sand and PFRA silt were prepared with an auto- matic compaction apparatus in a 6-in. diameter mold which had been cut down in height from 5 in. to 3 in. These soils were first air-dried and thoroughly mixed to obtain uniformity. The moisture con- tent at maximum dry density was deter- mined using the modified AASHO proce- dure (8). All the specimens of Lindsay
Silt,
1
Sand,per per
c e n t
I
c e n t---
sand and PFRA silt were prepared a t this determined maximum density. Fol- lowing compaction, the samples were placed in a pressure-vented oven at 105 C
and left for 48 hr. Very little shrinkage in either soil occurred on drying.
The water saturating procedure was as follows. The oven-dry sample was placed in a vacuum desiccator and con- tinually evacuated for 24 hr. Follo~ving this, vacuum deaired water was intro- duced into the desiccator under vacuum conditions. The sample was allowed to remain in contact with water for at least 24 hr. The dry densities for the Lindsay sand samples were between 2.19 and 2.21 g per cu cm (136.5 to 138.5 lb per cu ft) and for the PFRA silt 1.76 to 1.77 g per cu cm (110 to 110.5 lb per cu ft).
The moisture content achieved with this saturating technique ranged from 7.96 to 8.46 per cent for the Lindsay sand and 18.9 to 19.5 per cent for the PFRA silt.
The Leda clay specimens were pre- pared differently because compaction di5culties were anticipated and large attendant shrinkage would occur on drying. Once air- or oven-dried in a block sample, resaturating the clay with any sort of reproducibility would be time- consuming and difficult. The clay was procured in an undisturbed block, and since considerable grain-size and mois- ture-content variations were shown to occur throughout, the sample was thor- oughly puddled a t its natural moisture content using a paddle-type paint mixer. Liquefaction was easily achieved since the liquidity index was 1.2 (7).
The semifluid mix was then poured into the 6-in. diameter compaction mold to a height of 3 in. and consolidated under static pressures in progressive steps to a maximum of 6 kg per sq cm. The densities achieved in this way
ranged from 1.44 to 1.47 g per cu cm (90 to 91.7 lb per cu ft) with a moisture con- tent range from 32.4 to 33.9 per cent. From this consolidated material, a sam- ple 2 in. high was cut and directly placed into the frost cell.
Ice Contetzt Deternzi~aations for Prozett Soil:
For one soil (Lindsay sand), the rela- tion between temperature and ice con- tent was determined. These determina- tions were necessary to check the heat flow quantities indicated by the heat meters in the case of frost heaving in a closed system. How these values were used will become evident below.
The samples were compacted to the same density as in the frost-heaving experiment. This was done by increasing the compactive effort in the Harvard
compaction apparatus until the desired density mas achieved. The moisture con- tent used in the preparation of these small specimens was the same as that previously determined at the maximum density. The saturating procedure was also the same as described previously.
Samples were frozen at various tem- peratures at the bottom of a 2-gal well inside a tank under closely controlled temperatures. (This tank has already been described (g).) The temperature variations between samples in the well a t any one time were usually as close as could be read on the recorder chart except for one case where a difference of OM
C
occurred.The heat released was determined calorimetrically in a 1-qt thermo flask using a glass stirrer. The water equiva- lent, El of the calorimeter was deter- mined b y melting ice cubes in the same temperature range in which the ice content determinations of the soil speci- mens were made. An average value for E, 29.85 cal per deg Cent, was based on six separate determinations: 29.29,28.12, 30.26, 30.70, 30.73, and 29.98. The statistical standard error is ~k0.41 cal per deg Cent.
Temperature changes occurring in the calorimeter were evaluated according to the method described by Love11 (10). This allowed for the different heat loss rates of the calorimeter fluid before frozen soil or ice was introduced and after it had thawed. The temperature was continuously measured with a curve- drawing millivolt recorder. The equal area measurements were done on the recorder chart using a simple polar- planimeter.
Values for the specific heats of water, ice, and the latent heat of fusion of ice were taken from the literature. The value of 0.17 for the specific heat of the soil was taken from results determined by
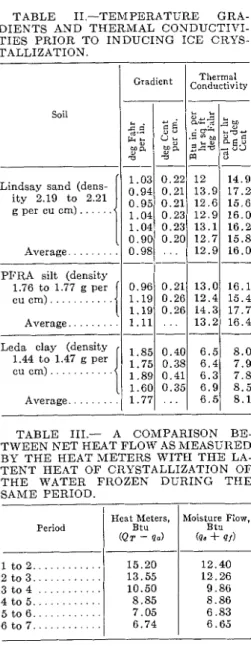
TABLE 11.-TEMPERATURE GRA- D I E N T S AND T H E R M A L CONDUCTIVI- T I E S PRIOR TO I N D U C I N G ICE CRYS- TALLIZATION. 1.03 0.22 12 14.9 Lindsay sand ( d e n s
11
0 . 9 4 0.211 1 7 . 2 ity "19 . . . 2'21 0.95 0.21 12.6 15.6 g per cu em) 1.04 0.23 1 2 . 9 16.0 Soil 1 . 0 4 0.23 13.1 16.2I/
0.90/ 0.201 . . . 12.71 15.8 . . . Average 0.98 12.9 16.0 L. s 6'- c k k ,a uLeda clay (density
1.89 0.41 6 . 3 7 . 8 1.60 0.35 6 . 9 8 . 5 PITRA silt (density
1.76 to 1.77 g per cu em) . . .
1
Average . . . Average 1.771 . .1
6.51 8 . 1 - . g $ UI, ,a uTABLE 111.- A CO&IPARISON BE- T W E E N N E T HEAT PLOW AS MEASURED BY T H E HEAT M E T E R S W I T H T H E LA- T E N T HEAT O F CRYSTALLIZATION O F T H E WATER FROZEN DURING T H E SAME PERIOD. 0.96 1 . 1 9 1.19 1 . 1 1 Period L L Ee2;ko .-,: 2s- Heat Meters, B t u (QT - q o ) SEE ;"a 0.21 0.26 0.26 . . . Moisture Flow, B t u
Kersten (11) for a similar soil in the same
13.0 1 2 . 4 14.3 1 3 . 2
----
temperature range. 1 6 . 1 15.4 17.7 16.4Freezifig Procedures for Heaving Experi- ments:
After the specimen was placed in the frost cell, the porous plate was connected to the outside water supply (except in the case of closed systems) and a pre-
determined temperature gradient was imposed across the specimen with the temperature a t the top near 0 C. When the heat flow into and out of the sample were the same within the limits of error, freezing was started by first lowering the temperature of the cold end of the soil slightly below freezing and inducing crystallization with a thin wire. The prefreezing thermal conductivities and temperature gradients for the soils studied are given in Table 11. These values are for the saturated condition and density previously described.
RESULTS AND DISCUSSIONS
Discussions of Heat Flow and Moisture Bala~zce:
The amount of heat, QT, flowing out of the freezing soil system (over a given period of time) while frost heaving and penetration of the frost line is occurring is the sum of the following quantities:
g, = heat entering specimen,
qb = heat removed in cooling of wet unfrozen soil,
q, = heat removed in cooling of ice and soil above ice lens,
qd = latent heat released on freezing of
in-silu water.
q, = latent heat released on freezing water moved to freezing plane, and
q, = cooling of moisture during move- ment along the temperature gra- dient in unfrozen soil.
That is,
Q T = 40
+
q e + qc+
qd+ q s + q , . . ( l )A reduction in the rate of frost-line penetration reduces the values of qb
,
qc,
and qd
.
When the rate of frost-line penetration is zero and the moisture flow is small, qb,
g p , , and gd approach zero, and :or, by transposing,
Both Eqs 1 and 2 describe heat flows water is small, a quasi-equilibrium or in the unsteady state. Equation 2 de- nearly steady-state condition is achieved. scribes a condition where the length of In an open system, balancing the the frozen portion is increasing due to the difference between heat-in and heat-out freezing out of water that has moved against moisture flow provides an ap- to the freezing plane. When the flow of proximate check on the operation of the
in. SAMPLE. 5 6 -7
-
I y8 in. DEPTH 1 % in. DEPTH-
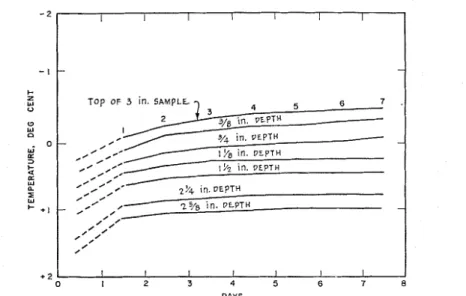
2% i n . VLPTH I I I 1 1 1 - I 2 3 4 5 6 DAYSFIG. 4.-Temperature Distribution versus Time a t Various Positions in the Specimen. NOTE.-Numbers indicate periods used for heatdow and moisture-flow comparisons.
apparatus. This was done a number of times. The results of one such trial are given in Table I11 for the condition of temperature distribution given in Fig. 4 for the periods marked from 1 to
7
inclu- sive. Each period is approximately 24 hr long. The periods between 4 and7
ap- proximate the conditions of Eq 2.When no moisture is allowed to flow into the sample after freezing starts and the initial and final temperature gradi- ents are known together with the amount of unfrozen water as a function of the temperature, another check on the func- tioning of the system is possible. In this case QT - qa = 95
+
q e+
q d+
q ef
qf-
Such a check was made on a specimen of Lindsay sand between the limits of
10 I i I
1 I I I
s o l L LINDSAY SAND 9 DRY DENSITY 2 21 -
TEMPERATURE DEG CENT
FIG. 5.-Unfrozen Moisture Content versus initial and final temperature gradients.
Temperature. From the curve of unfrozen water
: 8 - u %
z.
7 . - - - ,- W z u2
i 3 -
P 2 3 I Oo 011
- - 4 - 0 --Lo
-\
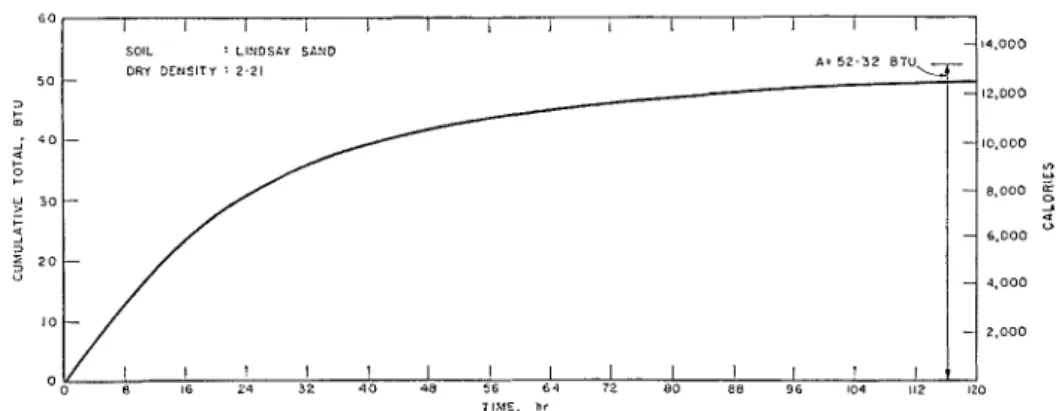
- O l e - - I t I I -Il - 2 - 3 - 4 - 5 - 6 - 7 - Bcontent as a function of temperature given in Fig. 5, together with a knowl- edge of the specific heat of sand, the balance given in Fig. 6 was obtained. The curve is a cumulative plot of Q ,
-
q, based on results obtained from the heat meters. To the right side of the graph the value A = 52.32 Btu is the total value of 46
+
qc+
qd+
q e+
q,.
This value, although 4 per cent higher than that based on the heat meters, is considered a fairly good balance in view of the many difficulties involved in such an experiment.
line was allowed to propagate down without ally further change in the cold- side temperature. The water table was kept level with the bottom of the speci- men. Temperatures, heat flow, and moisture movement in to the sample were continuously recorded. I n the next run, with a new specimen, the cold-side temperature was set slightly lower, thus inducing a faster frost-line penetration and also a more rapid heat extraction rate. I n this way a number of different rates of freezing mere carried out for each soil.
Numerous checks on the functioning of the frost cell similar to those already mentioned were carried out from time to time. Rechecking the calibration of the
5 0
heat meters was also carried out peri- odically as a means of maintaining the best possible values for the heat-meter constants.
SOIL : LINDSAY SAND
Heaving Rate Experiments:
J l 4 . 0 0 0 3 ; s o - 4 + +
Series 1.-To determine the effect of
varying the rate of heat extraction on the rate of moisture flow to the frost line, two series of experiments were carried out. In the first series, after crystalliza- tion had been induced, the temperature of the top plate was set at a given tem- perature below freezing and the frost
The results of the heat-flow and mois-
7h
sb
8)8 2 6 104 1!2 ' 1 2 01
Tlh<E, hr
FIG. 6.-Net Difference Between Heat Out and Heat I n as a Function of Time in a Closed Sys- tem. DRY DENSITY : 2.21 A: 5 2 . 3 2 B T U - - -
-
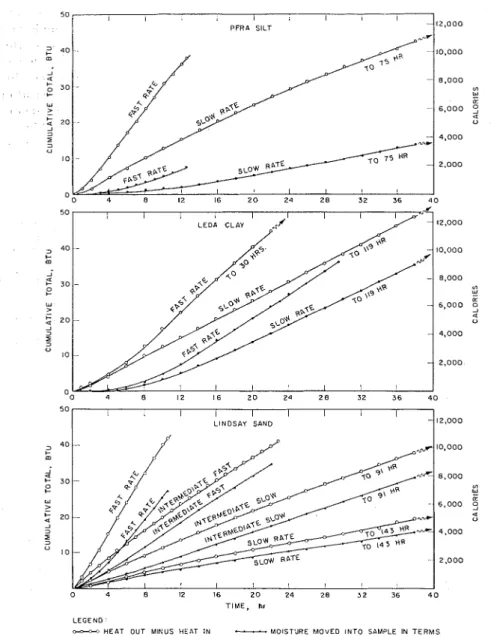
-ture-flow measurements are given in Fig.
7
for the three soils. The curves with the circles are the cumulative- 10.000 0 u 8 . 0 0 0 < 0 6 . 0 0 0 4 , 0 0 0 2 . 0 0 0
difference between heat flow out of the sample and heat flow into the sample in terms of Btu's or calories. The curves with the dots give the moisture flow in to the sample as demanded by the freez- ing front. This is expressed in terms of its latent heat in Btu's when frozen, 80 cal per g or 144 Btu per lb.
The obvious conclusion from these results is that an increase in the rate of
-
heat extraction from the s a m ~ l e increases
12.000
the moisture flow into the specimen and, consequently, its heaving rate is in- creased. This was true for all three soils,
but it must be remembered that the summarized in Fig. 8. The points on the external water source was a t the level of graph are the average rate of moisture the base of the specimen; that is, satura- flow into the sample for an average rate
5 0 1 I 1 I I I I I PFRA S I L T - 1 2 . 0 0 0 5 0 I 1 1 I I 1 1 I I L I N D S A Y SAND 1 2 . 0 0 0 T I M E , hr L E G E N D .
c-c---= H E A T OUT MINUS H k A T I N -MOISTURE M O V E D I N T O SAMPLE IN T E R M S OF L A T E N T H E A T O F C R Y S T A L L I Z A T I O N
FIG. 7.-Cumulative Value of Net Heat Flow and Moisture Flow versus Time.
tion or near-saturation conditions pre- of heat extracted. Again, the heat-flow vailed. parameter is heat flow out of the sample The results of these experiments are minus heat flow into the sample. On the
is, when heat flow out of minus heat flow into the sample is zero, no ice segregation can occur. This is theoretically the case and is shown experimentally for Lindsay sand in Fig. 8. I n the other soils, the plotted points have been connected by curves pointing to zero. There appears to be no question that the heave rate is closely related to the net heat flow, al- though there is some dropping off in the amount of water that flows to the freez- ing plane per unit heat extracted as the rate of net heat flow is increased.
m l PER D & l
8
m I PER HR IIEAYE. I N P E R D b l 8 B T U PER il? ( 2 4 0 1 10 - 0 2 '1 4 8 72 9 6 BTU PER DL?R l T E O F HEAT F L O H l i l F I I T O U i IIhUS HEAT Ili I
0.5
FIG. 8.-Moisture Flow and Heave versus Net Heat Flow.
NOTE.-1. BY separate experiment for each rate and for each soil. 2. Water table a t base of speci- men.
m l PER DAY
+ m i PER HR HEAVE IN. PER DAY
6
(2'01 10 I I
0.5
AVERAGE FROST PENETRATION, IN. P E R DAY
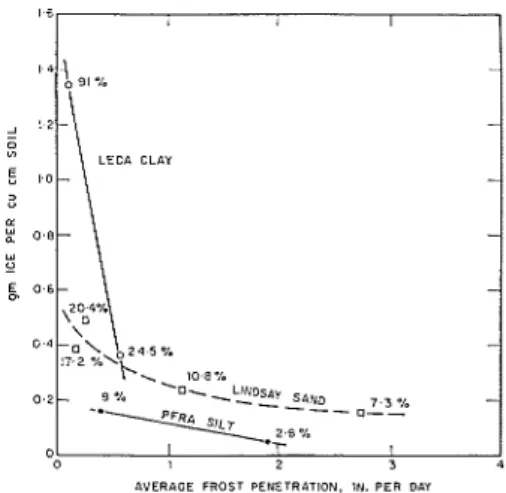
FIG. 10.-Average Amount of Ice Accumula- tion per Unit Original Volume of Soil versus Frost Line Penetration.
NOTE.-Numbers indicate per cent moisture content by weight added by the frost action process (g water per g dry soil).
I I
2 3 4 A V E R A G E FROST PENFTRIITiON. IY P E R D i l l
FIG. 9.-Rates Moisture Flow and Heave versus Frost Penetration.
right side of Fig. 8 are given the rates of heave in terms of inches per day. These curves must, of course, go to zero, that
Figure 9 is a plot of the average rate of frost-line penetration per day versus rate of heave and moisture flow. Frost- line penetration was determined b y dividing the measured frozen layer at the end of the experiment b y the time. If the curves in Fig. 9 are extrapolated to zero frost penetration, Eq 2 is approximately applicable and represents frost heaving without frost-line penetration. For Lind- say sand, this was determined experi- mentally as is shown by the plotted point.
When the frost-line penetration has stopped, heave rate does not stay con- stant in a freezing system such as has been described here. As the ice lens grows, the thickness over which the temperature difference is applied in- creases and so reduces the temperature gradient. This situation is true unless the temperature on the cold side is teduced. If this is not done, the heaving rate gradually decreases. This is shown in Table I11 and is also evident in many of the graphs.
soil frozen, becomes infinitely large as the rate of frost-line penetration ap- proaches zero and has no real meaning when the frost line becomes stationary. The greatest accumulation of ice oc- curred in Leda clays a t the slowest rate when more than 50 per cent of the vol- ume in the frozen state consisted of ice frozen out from moisture moved in the specimen.
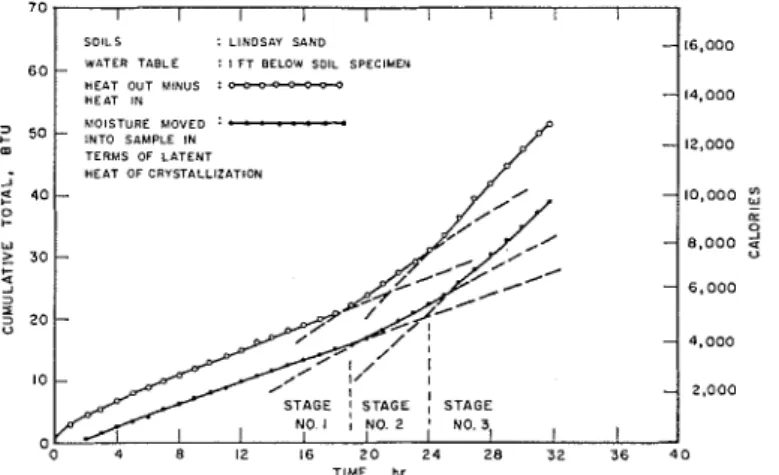
Series 2.-In the second series of experiments on heaving rates, the water table was dropped 12 in. below the
SOILS : LINDSAY SAND
t
WATER T A B L E : I F T BELOW SOIL SPECIMENH E A T O U T hllNUS : P H E A T In hlOlSTURE M O V E D : ? - l N T O SIIMPLE I N T E R M S OF L A T E N T H E A T O F C R I S T l L L l Z l T l O N > 2 4 0 - 0 C W 2 30 - t 3 5 20- TIME, hr
FIG. 11.-Cumulative Values of N e t Heat Flow and Moisture Flow versus Time. The average amount of ice accumu-
lated per unit volume of original soil also varies with the rate of frost-line penetration. The results shown in Fig. 10 indicate that the amount of ice per unit volume of soil varies inversely to the rate of frost-line penetration. The numbers beside the plotted points are the average moisture contents of the frozen layer. These figures do not include the original water content of the soil but merely that moved in due to the frost action process. This has obvious implications when applied to spring break-up under field conditions and will be discussed later. The parameter, grams of ice per cu cm of
bottom of the specimen rather than level with the bottom of the specimen as in the first series. Following this, the tem- perature gradient was applied with the cold end of the soil close to zero. When heat into and heat out of the sample were equal, the cold end of the soil was super- cooled. Crystallization was induced and the temperature of the cold plate was set to a predetermined value. After allowing the system to run for 20 to 22 hr, the cold-side temperature was further reduced. Sometimes the temperature on the cold side was lowered a third time, resulting in three distinct stages of cool- ing rates.
heat flow out of the sample and heat flow into the sample as measured with the heat meters is shown for one soil in Fig.
11. The moisture flow into the sample is again shown in terms of Btu's based on the latent heat of fusion.
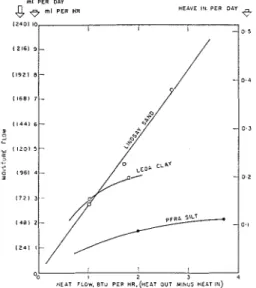
I n all cases when the rate of heat extracted from the sample was increased, an increase in moisture flow resulted. The summary results are shown in Fig.
12. The similarity between results given
rnl PER D&Y
8
e rnl PER HR HEAVE I N PER DAYe-
I Z I O l 10 I
I I 0 5
I I
OA 2 I
HEIT FLOW, B T Y PER HR.(MEII o u i M I ~ U S n e1.4) ~ ~ FIG. 12.-Rates Moisture Flow and Heave versus Net Heat Flow.
NOTE.-A~~ rates on each soil determined in one experiment. Low water table 12 in. below bottom of specimen.
in Fig. 8 and Fig. 1 2 are striking. With these soils a t the densities given, lower- ing the water table by 12 in. had very little effect on the heaving rate. This means that the unsaturated permeability was not limiting frost heaving.
Dependence of Ice Distribution on Rate of Freezing:
Results of these experiments show how different rates might influence the sever-
ity of spring break-up. A slow penetra- tion of the frost line gives a higher con- centration of ice in the frozen layer than a fast penetration. More water would be released per unit volume of soil in the spring in a year when the frost-line penetration was slow. The implication is that softer conditions might result in the road during the thawing period if other factors, such as drainage and rate of thaw, were equal. This is, however, only one aspect of frost action damage. When frost heaving is the destructive element as opposed to loss of strength, the situation is reversed: the faster the rate of freezing, the greater the total amount of heave for a given period.
Frost Heawing in the Field, Simulated
in
the Laboratory:
Soil freezing and the associated ice segregation process are closely related to the heat flow phenomenon. The experimental evidence presented here indicates that it is misleading to compare the frost susceptibility of different soils in a laboratory freezing experiment where the frost-line penetration rate is the same. Indeed, a knowledge of tem- perature changes in different soils ex- posed to the same climate leads to the same conclusion. What in fact deter- mines the depth of frost penetration is the rate of heat removal, the water supply, the frost susceptibility of the soil, the in-situ water content, etc.
The field work done recently by the Division of Building Research with regard to heat flow into and out of the ground at various seasons provides pertinent information that may well serve as a guide for establishing the rate of cooling in laboratory freezing experi- ments for the Ottawa area. Obviously, this will vary depending on the climate in a particular area.
Gold (12) found the average heat flow from the ground in the winter at one
site in the Ottawa area to vary con- same rate of heat extraction is the more siderably during two winters of observa- realistic basis.
tion. %the period Dec. 10, 1955, to Jan. 26, 1956, and Jan. 26 to April 3, 1956, the average heat flow was 27 and 5.7 cal per sq cm per day respectively. I n the period Nov. 5, 1956, to Jan. 4, 1957, and Jan. 4 to March 7, 1957, the correspond- ing values were 27.6 and 17.9 cal per sq cm per day. He concluded the average heat flow from the ground in the Ottawa area to be of the order of 20 cal per sq cm per day. Further results published by Pearce and Gold (13) show the meas- ured heat-flow rate from January to early March, 1958, to be about the same on the average. Information such as this can be found in the literature for various parts of the world.
Soil temperature changes due to diurnal variations or cold spells in the weather decrease with depth. Therefore, the heat flow a t the frost
lane
will fluctuate considerably more near the surface. As the frost line penetrates, these fluctuations will be attenuated to some extent depending on the depth. Simu- lating such fluctuations in the laboratory may-not prove to be necessary; a t the same time, applying an average rate of heat removal has its shortcomings.The greatest heaving rates are usually reported during freezing-and-thawing periods. This has led some workers to believe a fluctuating frost line to be a necessary prerequisite to ice lens forma- tions. Since these are periods of greatest heat flow with the frost line near the surface, they are probably also periods of greatest ice lensing activity if the moisture contents are high. I t is noted here that if the rate of ice segregation was not related to the rate of heat ex- traction, the rapid growth of spring frost boils would not be possible. I t is incorrect to compare the frost suscepti- bility of two different soils on the basis of equal rates of frost penetration; using the
SUMMARY AND CONCLUSIONS
The results presented in this paper, which apply to saturated or near-satu- rated conditions, show the strong in- fluence of net heat flow from the soil on the heaving rate. Increasing the rate of heat flow away from the freezing plane in all cases increased the rate of moisture flow and, consequently, the heaving rate. This was shown to hold for three soils of widely different properties.
The average concentration of ice in the frozen soil, resulting from water moved to the freezing zone, increased as the rate of freezing was decreased for all soils.
For these three soils at the densities used, the proximity of the water table was not a critical factor. Lowering the water table by 12 in. made no essential difference to the frost heaving rate; therefore, the unsaturated permeability did not limit frost heaving.
At the slower rates of freezing, a larger proportion of the net heat extracted from the specimen was derived from the latent heat of crystallization.
It is unsatisfactory to compare the frost susceptibility of different soils in laboratory freezing experiments on the basis of equal rates of frost penetration because the same amount of heat ex- tracted for two different soils does not produce the same frost penetration.
The rate of heat extraction used in the laboratory should be related to the actual heat flow in the environment in which the soil exists. Finally, it is be- lieved these results are useful in setting up practical laboratory freezing proce- dures for the realistic evaluation of the frost susceptibility of soils in the field.
Ackizowledgments:
The author wishes to acknowledge the assistance of his colleagues in the Divi-
sion of Building Research and in particu- ant Director, N. 13. Hutcheon in frost lar that of D. Eldred of the technical action research. This is a contribution staff in operating the frost cell equip- from the Division of Building Research, ment. The author is also grateful for the National Research Council (Canada) encouragement and continued interest and is published with the approval of the of the Director, R. F. Legget, and Assist- Director of the Division.
REFERENCES
(1) R. M. Hardy, Discussion in Symposium ternational Conference on Soil Mechanics on Frost Action, Proceedings, 38th Con- and Foundation Engineering, Vol. 1, vention, Canadian Good Roads Assn., Division 1, pp. 22-27 (1957).
Sept. 25-27, 1957, pp. 26C261. (8) T. W. Larnbe, "Soil Testing for Engineers," (2) G. Beskow, "Soil Freezing and Frost Heav- Mass. Institute of Technology, John Wiley
ing with Special Application to Roads and & Sons Inc., New York, N. Y. (1951). Railroads (1935)," The Swedish Geological (9) E. Penner and P. Robillard, "The Use of Society, Series C, No. 375, 26th year, Waste Sulfite Liquor to Reduce Frost Book No. 3. Translated by J. 0. Osterburg. Heaving in Soils," fiansactions, Engineer- Published by the Technological Institute, ing Inst. Canada, Vol. 3, No. 4, Dec. Northwestern University, Evanston, Ill- 1959, pp. 107-109.
inois, pp. 14-21 (1947). (10) C. W. Lovell, "Temperature Effects on (3) "Cold Room Studies-Third Interim Re- Phase Composition and Strength of Par- port of Investigations," Technical Report tially Frozen Soil," Bulletin No. 168, High-
No. 43, U. S. Army, Corps of Engineers, way Research Board, pp. 74-96 (1957). Oct. 1958. (11) M. S. Kersten, "Laboratory Research for (4) A. Higashi, "Experimental Study of Frost the Determination of Thermal Properties Heaving," Research Report No. 45, U. S. of Soils," ResearcIi Laboratory Invesliga- Army, Corp of Engineers, Snow, Ice and lions, Engineering Experiment Station,
Permafrost Research Establishment, Aug. University of Minnesota (1949).
1958. (12) L. W. Gold, "Influence of Snow Cover on (5) E. Penner, "The Mechanism of Frost Heav- Heat Flow from the Ground," Association ing in Soils," Bzrllelin No. 225, Highway Internationale D'Hydrologie Scientifique Research Board, Jan. 1959, pp. 1-13. Union Geodesique et Geophysique Inter-
(6) E. Penner, "Pressures Developed in a nationale Assemblee Generale d e Toronto, Porous Granular System as a Result of Ice Tome IV, pp. 13-21 (1958).
Segregation," Special Report No. 40, High- (13) D. C. Pearce and L. W. Gold, "Observa- way Research Board, pp. 191-199 (1958). tions of Ground Temperature and Heat (7) W. J. Eden and C. B. Crawford, "Geo- Flow a t Ottawa," Journal of Geopliysicul technical Properties of Leda Clay in the Research, Vol. 64, NO. 9, Sept. 1959, pp.