Publisher’s version / Version de l'éditeur:
Vous avez des questions? Nous pouvons vous aider. Pour communiquer directement avec un auteur, consultez la première page de la revue dans laquelle son article a été publié afin de trouver ses coordonnées. Si vous n’arrivez Questions? Contact the NRC Publications Archive team at
[email protected]. If you wish to email the authors directly, please see the first page of the publication for their contact information.
https://publications-cnrc.canada.ca/fra/droits
L’accès à ce site Web et l’utilisation de son contenu sont assujettis aux conditions présentées dans le site LISEZ CES CONDITIONS ATTENTIVEMENT AVANT D’UTILISER CE SITE WEB.
Proceedings 19th International Congress on Acoustics, pp. 1-15, 2007-09-02
READ THESE TERMS AND CONDITIONS CAREFULLY BEFORE USING THIS WEBSITE.
https://nrc-publications.canada.ca/eng/copyright
NRC Publications Archive Record / Notice des Archives des publications du CNRC : https://nrc-publications.canada.ca/eng/view/object/?id=72971fab-585d-42cc-938b-7ea1fc1b5a1e https://publications-cnrc.canada.ca/fra/voir/objet/?id=72971fab-585d-42cc-938b-7ea1fc1b5a1e
NRC Publications Archive
Archives des publications du CNRC
This publication could be one of several versions: author’s original, accepted manuscript or the publisher’s version. / La version de cette publication peut être l’une des suivantes : la version prépublication de l’auteur, la version acceptée du manuscrit ou la version de l’éditeur.
Access and use of this website and the material on it are subject to the Terms and Conditions set forth at
From speech privacy to speech security
http://irc.nrc-cnrc.gc.ca
F r o m s p e e c h p r i v a c y t o s p e e c h s e c u r i t y
N R C C - 4 9 5 0 0
B r a d l e y , J . S .
A version of this document is published in / Une version de ce document se trouve dans: 19th International Congress on Acoustics, Madrid, Sept. 2-7, 2007, pp. 1-15
The material in this document is covered by the provisions of the Copyright Act, by Canadian laws, policies, regulations and international agreements. Such provisions serve to identify the information source and, in specific instances, to prohibit reproduction of materials without written permission. For more information visit http://laws.justice.gc.ca/en/showtdm/cs/C-42
Les renseignements dans ce document sont protégés par la Loi sur le droit d'auteur, par les lois, les politiques et les règlements du Canada et des accords internationaux. Ces dispositions permettent d'identifier la source de l'information et, dans certains cas, d'interdire la copie de documents sans permission écrite. Pour obtenir de plus amples renseignements : http://lois.justice.gc.ca/fr/showtdm/cs/C-42
19
thINTERNATIONAL CONGRESS ON ACOUSTICS
MADRID, 2-7 SEPTEMBER 2007
From Speech Privacy to Speech Security
PACS: 43.55.Hy Bradley, John S.
National Research Council, 1200 Montreal Rd., Ottawa, Canada, K1A 0R6
ABSTRACT
Consideration of speech privacy in indoor environments started with the recognition of the importance of speech-to-noise ratios and the introduction of the Articulation Index (AI) as a measure of speech privacy. The AI has been successfully employed in open-plan offices where little reflected sound is desired. More recently the design and assessment of the speech security of meeting rooms has been considered. The audibility and intelligibility of speech from a meeting room can be related to the probability of higher speech levels in meeting rooms and of lower ambient noise levels outside the room as well as to the sound transmission characteristics of the room boundaries. Because eavesdroppers may be close to the room, transmitted speech levels are measured and predicted at 0.25 m from the outside of the room. While the speech-to-noise ratio is the most important factor, the intelligibility of the transmitted speech is also influenced by reverberation and spectral changes on transmission through walls. This is further complicated by the spatial relationship between the directions of arrival of the speech and noise sounds. New results demonstrate the separate effects of early reflections and reverberation of the speech and the relative direction and diffuseness of the ambient noise on the level of speech privacy.
INTRODUCTION
Speech privacy refers to conditions where our ability to understand some speech sounds is reduced. Speech privacy may be desired because we want a conversation to remain confidential and not be understood by others, or in other cases we may want speech privacy because the conversations of others are an unwanted disturbance. In either case we would like to make acoustical modifications to reduce the intelligibility of the speech sounds at particular listener locations. We therefore can measure speech privacy in terms of the intelligibility of the speech and specify speech privacy criteria in terms of adequately low speech intelligibility scores. Approaches to achieving adequate speech privacy will vary depending on the acoustical environment. In this paper speech privacy in open-plan offices will first be discussed followed by discussion of speech privacy for enclosed offices and meeting rooms.
Our current approaches to speech privacy issues have developed from the pioneering work of Cavanaugh et al. [1]. They first made it clear that a sense of privacy was related to the intelligibility of the speech. They also introduced the use of the Articulation Index (AI) [2] as an appropriate measure of the degree of speech privacy. AI is a frequency-weighted signal-to-noise ratio measure developed after extensive research [3] and is well related to speech intelligibility scores. Thus, one can establish speech privacy criteria in terms of maximum allowed AI values.
This initial work was followed in the 1970s by the application of these ideas to open-plan offices [4-6], which is summarized in [7]. A later study by Moreland [8], based on a large number of measurements in actual open-plan offices, related office design parameters to AI values. Several ASTM measurement standards were developed including one for evaluating speech privacy in open-plan offices in terms of AI values [9]. A general consensus developed, for achieving acceptable acoustical conditions in open-plan offices, that included the addition of absorbing surfaces and partial height workstation panels to block and attenuate the propagation of speech sounds and that an acceptable goal was that the resulting combination of the ambient
noise level and intruding speech level should correspond to an AI ≤ 0.15. Although increasing ambient noise levels can reduce AI values, and hence increase privacy, Warnock et al. [5] pointed out that too much ambient noise was counter productive because occupants found it annoying and simply talked more loudly. They recommended a maximum ambient noise level of no more than 48 dBA.
NEW STUDIES OF SPEECH PRIVACY CRITERIA FOR OPEN-PLAN OFFICES
IRC-NRC recently carried out a large multi-disciplinary project to investigate the often-interacting acoustical, lighting and air quality requirements for an optimum open-plan office (referred to as COPE, Cost-Effective Open Plane Environments). The acoustical components of this work included new physical measurement and subjective assessment studies to evaluate the generally accepted acoustical requirements and to develop improved procedures for achieving acoustical design goals. The open-plan office is by far the most common type of office space in North America. Almost all new office construction is for open-plan offices and there are strong pressures to reduce the average floor area of each workstation to reduce building costs.
Appropriate Speech Privacy Design Goals for Open-Plan Offices
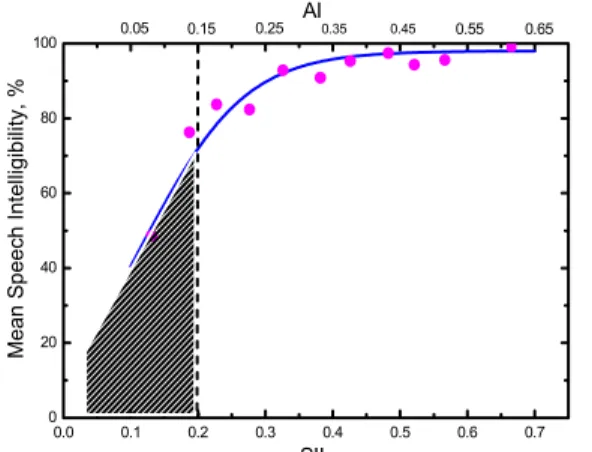
Concerning acoustical design goals it was a generally accepted that one should strive to achieve conditions in which AI ≤ 0.15. However, no particular study could be found that produced this conclusion. The ANSI standard defining AI [2] has been changed and the new version defines the Speech Intelligibility Index (SII) [10]. Comparisons of the two measures in open-plan office situations show that above about AI = 0.05, SII values are about 0.06 larger than the corresponding AI values [11, 12]. An approximate difference of 0.05 is used in some of the following discussions for convenience. Similarly, although it was recognized that ambient noise could be too loud, there was no study that suggested what an optimum ambient noise level should be to maximize the masking of unwanted speech while not unduly disturbing occupants of open plan offices. Accordingly, new studies were carried out to better understand acoustical design requirements for open-plan offices.
The appropriateness of the AI design goal was investigated by carrying out speech intelligibility tests in conditions that modelled those in an open-plan office [13]. The tests used the Harvard sentences [14] and the speech sounds were spectrally modified so that they would represent speech propagated from and adjacent workstation. Subjects heard this speech from loudspeakers in front of them and simulated ambient noises from loudspeakers above them as illustrated in Figure 1. Twenty-nine subjects each listened to 100 combinations of speech and ntervals of 0.05 AI are shown in Figure 2. noise. Their mean intelligibility scores aggregated into i
igure 1. Experimental set up for tening tests of simulated open-plan
t the design goal of AI = 0.15 (or approximately SII = 0.20) the average intelligibility score is bout 70%. This is certainly not perfect privacy but does represent a significant improvement
Ambient noise loudspeakers Ceiling Curtain Transmitted speech loudspeakers Foam Listener F lis office conditions. A a
over doing nothing, which would result in intelligibility scores close to 100%. It also can be shown that it is difficult to achieve lower AI values than about 0.15 in real open-plan offices. Therefore, designing to achieve AI ≤ 0.15 is a reasonable design goal in that it leads to significantly improved privacy and is about as much privacy as can be practically achieved in an open-plan office.
Figure 2. Mean speech intelligibility versus AI op axis) or SII (bottom axis) for simulated open-lan office conditions. The hatched area
presents the recommended design goal. (t
p re
Additional tests were made to evaluate subjec
eard speech modified to represent propagation from n adjacent workstation. At the same time they also experienced various simulated ambient oises. They were asked to rate how distracting they found the conditions immediately after t’s impressions of the conditions. While doing an arithmetic task or an editing task, subjects h
0.0 0.1 0.2 0.3 0.4 0.5 0.6 0.7 0 20 40 60 80 100 0.05 0.25 0.35 0.45 0.55 0.65 M e a n S p e e c h I n te llig ib ility , % SII 0.15 AI a n
completing the tasks. Figure 2 plots the mean ratings versus the SII values describing each condition. For the SII = 0.0 case, subjects experienced only simulated ambient noise and no simulated speech from an adjacent workstation. The criterion of SII = 0.20 corresponds to a mean rating between ‘A little distracting’ and ‘Moderately distracting’
4 5
Very Extremely
igure 3. Mean distraction rating for simulated pen-plan office conditions while performing rithmetic and editing tasks.
iv
eech privacy on ial’. Figure 4 shows that when there was no disturbing id have approximately ‘confidential conditions.
igure 4. Mean ratings of the perceived speech rivacy of conditions while performing various
sks.
4
enced recorded orkstation and simulated ambient noise from
test conditions changed every 20 minutes [15], subjects had a longer time to experience e
F o a
ed speech privacy of conditions. For the same bjects were asked to rate the sp
A second subjective test evaluated the perce conditions and tasks as in the previous test, su a 5-point scale from ‘None’ to ‘Confident speech (SII = 0.0 case), subjects thought they
0.0 0.1 0.2 0.3 0.4 1 2 3 Not at all A little Moderately After Editing test Math test Both tests Distractin g SII d
However, for the criterion value of SII = 0.20, the mean rating was a little less than ‘Acceptable’.
5 Confidential After Editing test Math test Both tests F p ta
from a completely different experiment (labelled ental open-plan office and experi
There is an additional set of results in Figure IERF), where subjects worked in an experim telephone conversations from an adjacent loudspeakers above the ceiling. Because in thi
0.0 0.1 0.2 0.3 0.4 0.5 0.6 1 2 3 4 None A little Acceptable Moderately good IERF test Speech P rivacy SII w s
Although the results are from two quite different experiments, there is good agreement between the two sets of results for conditions with similar SII values. In both cases conditions with SII = 0.20 would be rated less than ‘Acceptable’ speech privacy. That is, even if we meet our design goal of AI = 0.15 (or SII = 0.20), occupants of the office will find the speech privacy not quite acceptable. One can estimate from these results that ‘Acceptable’ speech privacy would correspond to conditions with an SII ≤ 0.15 (corresponding to AI ≤ 0.10).
In the second experiment (referred to above as IERF), which was carried out in an experimental open-plan office, subjects were also asked to rate the relative loudness of the simulated ambient noises. Of course, this was done in the presence of unwanted speech in the form of telephone conversations from an adjacent workstation and while the subjects were carrying out arious computer based tasks. After each 20-minute session, they were asked to rate the
ent noise in open-plan ffices in presence of unwanted speech ounds.
pen-Plan Office Design Requirements
cause it is very difficult to create acoustical conditions in an open-plan office that occupants ill find to represent acceptable speech privacy, it is particularly important that the design rocess results in the best possible solution within various practical constraints. We can never chieve a high enough level of speech privacy, but if done well it can be ‘almost acceptable’. arious studies were carried out to explore the relationships between various open office design arameters and the resulting AI or SII ratings of the office, so that an improved design process
easurements of sound propagation between a pair of mock-up workstations were used to valuate the influence of the dimensions and acoustical properties of the components of the
e relative importance of the various parameters .
as used to explore the importance of individual design parameters. Figure illustrates the calculation results used to determine the minimum required ceiling absorption. It
d v
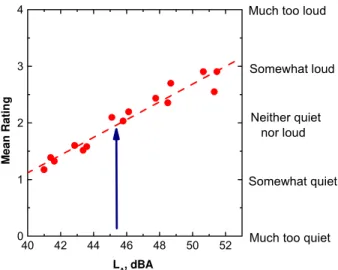
ambient noise on a 5-point scale from ‘Much too quiet’ to ‘Much too loud’. The mid-point was the neutral, ‘Neither quiet nor loud’. This intermediate neutral point is assumed to correspond to an optimum level of ambient noise for these subjects. The result, shown in Figure 5, is that an ambient noise level of about 45 dBA is judged to be optimum for an open-plan office. That is, subjects seem to find an ambient noise level of about 45 dBA to be an optimum compromise that maximizes masking and hence increases speech privacy without being too disturbing.
Figure 5. Mean rating of loudness of simulated ambi 40 42 44 46 48 50 52 0 1 2 3 4 Mean R a tin g LA, dBA
Much too loud
Somewhat loud
Neither quiet nor loud
Somewhat quiet
Much too quiet os
O Be w p a V p could be developed. M e
workstations [11, 16]. Table 1 summarises th
and lists recommended values. An open-plan office can only meet the design goal of AI ≤ 0.15, if the various parameters given in Table 1 have values close to these recommended values A computer model of sound propagation between workstations was developed based on an image sources model [17-20]. This was validated with respect to the systematic measurements and also in real open-plan offices. This computer design tool is available free [21]. Once validated, the model w
6
is based on calculations for an adjacent pair of workstations for which all parameters, except ceiling absorption, met those recommended in Table 1. Only the ceiling absorption was varie by using the sound absorption data from a variety of ceiling tiles. These results indicate that when all other details are near ideal the sound absorption of the ceiling must correspond to a Sound Absorption Average (SAA) [22] of at least 0.90 to meet the design goal of AI ≤ 0.15.
Relative Importance Parameters Preferred values
Most important Ceiling absorption Panel height
SAA ≥ 0.90
Panel height ≥ 1.7 m Less Important Workstation plan size
Panel absorption Panel transmission loss
Length ≥ 2.5 m SAA ≥ 0.70 STC ≥ 20 Least important Lighting
Ceiling height Floor absorption Office layout
Open grill fixtures Height ≥ 2.7 m Carpet
Avoid inter workstation paths
Table 1. Relative importance of workstation design parameters and their preferred values for
achi y ≤ 0.15.
Figure 6. Calculated SII values for varied ceiling absorption for otherwise ideal workstation designs.
Figure 7 illustrates possible c f the two mo rameters
that II ≤ 0.20 .15). s some possibility of
selecting different combinatio aramete bination will not provide
Figure 7. Resulting SII values for combinations of various ceiling absorptions and workstation panel heights. The shaded area shows where SII ≤ 0.20.
ls used by occupants of open-plan offices. Although so called ‘normal’ voice levels are ften used [10], they are not appropriate for most open-plan office situations. Measurements of oice levels of open-plan office occupants [23] have shown average voice levels are close to ose described as ‘Casual’ by Pearsons [24]. In our design calculations we have used the
d the apparent consensus of many previous practical studies and provided a quantitative understanding of the importance of various design parameters as well as the meaning of particular design goals. The results support the basic idea that for an open-plan office to be at all acceptable, there must be extensive sound absorption treatments and appropriate ambient/masking noise levels. If this is not the case then near-to-acceptable speech
eving the speech privac design goal AI
ombinations o st important office design pa will results in S (approximately AI ≤ 0 Although there i
ns of these two p rs, most com
0.20 1.9 0.2 0.4 0.6 0.8 1.0 1.2 0.10 0.15 0.20 0.25 0.30 0.35 0.40 S peec h p riv ac y, S II
Ceiling absorption, SAA
Required minimum ceiling absorption
conditions with SII ≤ 0.20.
0.35 0.30 0.25 0.4 0.5 0.6 0.7 0.8 0.9 1.0 1.1 1.3 1.4 1.5 1.6 1.8 P anel hei 1.7 ght , m Ceiling SAA
When predicting expected speech privacy in an open-plan office, one must also consider the voice leve
o v th
spectrum of an Intermediate Office Speech Level (IOSL) [11,12] which is one standard deviation higher in level than mean voice levels found in the open-plan offices.
privacy is not possible. Of course, the amount vacy desired will depend on the types of tasks that the occupants are performing.
ARCHITECTURAL SPEECH SECURITY FOR ENCLOSED OFFICES AND MEETING ROOMS
There is often a need to design enclosed offices and meeting rooms to be ‘speech secure’. ‘Speech secure’ means that it is very difficult or impossible for eavesdroppers outside the room to understand or in some cases even hear speec m the meeting room. That is, ‘speech secure’ simply implies a high level of speech priv y associated with the architectural aspects of speech propagation from the meeting room. This work does not include electronic techniques for enhancing the detection of speech from adjac
direct transmission through walls and floor-ceiling paths with less sound attenuation such as throug
sound leaks and weak components in the sound hose
associated with doors. Thus, a measurement pro dure is required that is capable of detecting weaknesses in individual components of the soun insulation of an office or meeting room.
of pri
h fro ac
ent rooms. Figure 8 shows, that in addition to s, speech can be transmitted through various h ventilation ducts. There are often various insulation of the room, such as t
ce d
the Speech Security of Enclosed Meeting Rooms
he new procedure for assessing the architectural speech security of a meeting room is based
.
the
mil r to conventional sound transmission sitions are used to accurately characterise the
ba ds from 160 to 5k Hz. In adjacent spaces d at positions where an eavesdropper might f these receiver positions would be located would be specifically located to assess s near doors but usually at a distance of l
s
su is
to o
the test sound in the source room (Ls) using equation (1).
Figure 8. Speech from a meeting room can be transmitted to the position of an
eavesdropper outside the room by direct paths, flanking paths and through sound leaks.
Measurement Procedure for Assessing
T
on sound level differences from room-average levels in the meeting room to spot-receiver ation positions outside the meeting room. This is different than conventional sound insul measurements that are based on differences between room-average levels in two adjacent rooms [25,26]. However, the conventional approaches are not appropriate for assessing speech security for several reasons. First, the conventional approach assumes diffuse sound fields in both rooms and measures only the average transmission characteristics of the separating partition. For speech security situations, the adjacent space is quite frequently not at all diffuse For example, it could be very small or very large or of quite unusual dimensions. Second, we need to assess the sound transmission characteristics of individual components and not just the average properties of the separating partition. Third, an eavesdropper is not likely to stand in middle of the adjacent space, but is much more likely to stand close to the outside of the meeting room and at some weak point in the sound insulation such as near a door.
In the source room, measurements are si measurements. Multiple source and receiver po average source room sound levels in 1/3 octave sound levels of the same test source are measure detect speech sounds from the meeting room. Most 0.25 m from the outside of the meeting room. So potential weak points in the sound insulation such a 0.25 m from the door. A distance of 0.25 m was se reverberant sound field but is not so close to the te microphone will cause large variations in the re approach was developed, it is essentially the same measure sound transmission from indoors to outdo
a n o me
ected because it minimizes the effect of any t surfaces that small errors in positioning the
lts. Although it was not known when th as a Japanese standard [27] that is used rs through windows.
The measured transmitted sound level 0.25 m from the outside of the meeting room (L0.25) can
provide sound levels at 10 s intervals in a range meetings. Table 2 lists some details of the meeting around the periphery of the rooms so that the spee sounds incident on the room boundaries. Although data without sound amplification systems, the resulting spee data were combined. (Although amplification was used in incident on the room boundaries were similar to the rooms). In total more than 100,000 measured speech le The cumulative probability distribution of the combined dotted cross lines indicate the example that for 90% o were 64 dBA or less. That is, for only 10% of the time the meeting rooms.
regression ±
aged over the speech r
60 to
.2 s) and larger meeting rooms
3
ion aracteristics can either be measured using the new measurement procedure or can be
in meeting rooms was determined by installing data loggers to of meeting rooms and for a number of rooms included. Data loggers were located ch levels were representative of speech was acquired for meetings with and levels were very similar and so the larger rooms, the speech levels unamplified speech levels found in smaller
v s f d -14 -12 -10 -8 -6 -4 -2 -2 0 dB k TL L L0.25 = S − + , (1)
The constant k is estimated to be -3 in some textbooks [28]. However, in this work it was determined experimentally by measuring the sound transmission characteristics of several walls in a reverberant test suite to provide standard TL values as a function of frequency. Transmission measurements were then made to an array of points 0.25 m from the test wall and the reverberation time of the test rooms varied by adding sound absorption to them. This made it possible to determine the effect of reverberant sound levels on k for a range of conditions.
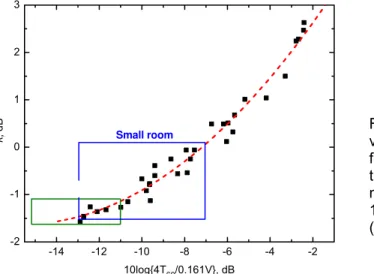
Figure 9 plots the resulting k values (as frequency averaged values over the speech frequencies from 160 to 5k Hz), versus the reverberant sound level (10 log{4T60/V}, where T60 is
reverberation time, s; V is room volume, m3 ). Although the standard error about the
line is quite small ( 0.19 dB) and hence k values could be estimated quite accurately, for most common types of meeting rooms, k ≈ -1 ±0.5 dB. Thus, equation (1) with a k value of -1 should usually provide good estimates of expected transmitted levels at points 0.25 m from the outside boundaries of a meeting room.
Figure 9. Experimentally determined values for k aver
1 2 3 k, dB Small room
frequencies 160-5k Hz. Boxes refer to the results expected in smalle meeting rooms (150 m3, T 0.3 1
-1 Large room
(500 m , T60 0.5 to 1.6s).
The Statistics of Speech Security
The audibility and intelligibility of speech sounds transmitted to adjacent spaces will depend on 3 factors: (1)) the sound transmission characteristics of the room boundaries, (2) the speech levels in the meeting room and especially those incident on the boundaries of the room, and (3) the ambient noise levels at listening points outside the meeting room. The sound transmiss
10log{4T60/0.161V}, dB
ch
estimated using equation (1). The speech levels in the meeting room and the ambient noise levels outside the meeting room will vary from moment to moment and must be described statistically. We can think in terms of the probability of speech being heard or understood determined from the likelihood of particular higher speech levels occurring in the meeting room and particular lower ambient noise levels existing outside the meeting room.
The distribution of speech levels
ch some
els over 10 s intervals were acquired. peech data is shown in Figure 10. The
the time, the measured speech levels id the speech levels exceed 64 dBA in
Number of meeting room cases* 32
Number of meetings measured 79
Number of people in each meeting 2 to 300 people
Range of room volumes 39 to 16,000 m3
Range of room floor areas 15 to 570 m2
Table 2. Summary of meeting rooms measured. ( * includes 30 different rooms, 2 of which were measured with and without sound amplification systems).
60 80 100
ity, %
oms and for different times of day. As would be expected, ambient noise levels were highest
ed lines in Figure 11 illustrate the example that during the early
evening, the am 33.5 dBA for 10% of the time.
igure 11. Cumulative probability distributions measured ambient levels in spaces
jacent to meeting rooms.
vel was greater than 64 dBA for 10% of the p es were less than 33.5 dBA for 10% of the m aces, it is reasonable to assume
e th
d ct of their separate probabilities, or 1%.
Measures of the Audibility and Intelligibility of
Figure 10. Cumulative probability distribution of measured speech levels in meeting rooms.
Ambient noise levels in spaces adjacent to meeting rooms were similarly sampled. Figure 11 shows plots of cumulative probability distributions of noise levels in spaces adjacent to meeting
30 40 50 60 70 80 0 20 40 Cu m u la Level, dBA ro
during the daytime and lowest at night. The distribution for ambient noise levels in the early evening (17:00-21:00) is used in for estimations of speech security because noise levels were lower than during daytime (8:00-17:00), but meetings were still frequently held in this time period. The crossed dott
bient noise levels were less than
40
ive prob
In the examples above, the meeting room speech time and the ambient noise levels in adjacent s time. Since the speech and noise levels are fro that the distributions of source room speech lev independent. In this case the probability of bo ambient noise level less than 33.5 dBA is the pro
20 30 40 50 60 0 20 C u mulat Level, dBA Time of day Daytime Early evening Late evening Night time tive probabil 60 80 100 abili ty, % F of ad le ac separate sp
ls and spot-receiver ambient noise levels are a speech level exceeding 64 dBA and an u
Speech
The audibility and intelligibility of speech sounds transmitted into adjacent spaces will depend on the noise ratio at the listener’s position outside the meeting room. New signal-to-noise ratio measures were developed [29] from extensive listening tests because existing measures were not found to be sufficiently accurate predictors of the intelligibility and audibility of the transmitted speech sounds. The listening tests used the Harvard Sentences [14] and exposed subjects to speech that was spectrally modified to represent the effects of transmission
through various walls. The speech was heard in combination with simulated ambient noises in the experimental set up shown in Figure 1.
dicators of the intelligibility of speech than an noise levels. Figure 12 illustrates this by us AI values and differences of A-weighted vious difference in the amount of scatter in the predictor of the speech intelligibility scores.
ersus AI values and S/N(A) values [29]. The circle indicates
not efined. For rating the speech security of meeting rooms, one is interested in rating conditions zero. In some cases one would like
llowing equation, (where Sb and Nb are the speech
nd noise levels respectively at the listener’s position in 1/3 octave band b). It is well known that AI values are more accurate
simple differences of the A-weighted speech comparing plots of speech intelligibility scores ve speech and noise levels (S/N(A)). There is an ob two plots and AI values are clearly a more accurate
20 40 60 80 100 eech Intell igi b ili ty, % in d rs Figure 12. Comparison of speech intelligibility scores v where AI is a less successful measure.
Although the AI values are superior to the S/N(A) values, the AI values do not provide accurate ratings of conditions close to AI = 0 and cannot rate conditions below AI = 0 where AI is
0.0 0.1 0.2 0.3 0.4 0 S p Articulation Index -20 -15 -10 -5 0 5 10 15 20 S/N(A), dB d
where the intelligibility of the transmitted speech is close to
to determine whether the transmitted speech will be audible. This is not possible using AI values.
The new listening tests [29] showed that frequency-weighted sums of signal-to-noise ratios in decibels could be much better predictors of both the audibility and intelligibility of transmitted speech for conditions where close to 0 intelligibility is expected. Figure 13 shows results used to determine the thresholds of audibility and intelligibility of speech in terms of a uniform-weighted signal-to-noise ratio SNRuni32, given by the fo
a
∑
− = b b b uni S N dB SNR max( ,32), 16 1 32 (2)The points at which 50% of the listeners could just understand o cadence of the speech, or just hear any speech sounds at all, are thresholds’. These are indicated in Figure 13 and listed in Table 3. De that conditions will normally correspond to the just noticeable thre result in conditions for which transmitted speech is very in eavesdroppers outside the room.
Threshold SNRuni32
Intelligibility -16 dB
Cadence -20 dB Audibility -22 dB Table 3. Just noticeable thresholds of: intelligibility, detection of cad
ne word, just detect the defined as the ‘just noticeable
ng a meeting room so shold of intelligibility should
fr signi
equently understood by
just understanding one word (upper), (b) Figure 13. Percentage of subjects: (a)
st detecting the cadence of the
From the definition of the uniform-weighted signal-to-no ju
speech (middle) and (c) just able to hear any speech sounds (lower).
ise ratio in equation (1), the following is approximately true, dB avg L avg LD avg L SNRuni32 ≈ S( )− ( )− N( ), (3)
where the averages are over f m 16 to 5k (avg) is the average speech level in the source room and LN(av age noise le receiver position. LD(avg) is
the level difference indicating n of a test sig een the average source room level and the transmitted level at the listener position outside the room. .
quation ) becomes,
(4)
hat is, for some measured LD(avg) and a design goal of SNRuni32 = -16, a specific difference
etween speech level in the meeting room and noise levels at the listener position is implied. e can estimate the probability of this combination of meeting room speech level and ambient oise level at the listener position occurring by combining the results of Figures 10 and 11. By ssuming that the probability of a particular speech level occurring is independent of the robability of a particular noise level occurring in the adjacent space, the probability of a ombination of speech and noise levels is the product of their individual probabilities. By ligning the results of Figures 10 and 11 at equal probabilities and calculating the probability of arious combinations of meeting room speech level and ambient noise level in the adjacent pace, we obtain Figure 14 that can be used to estimate the probability of a particular (speech vel) - (noise level) difference occurring. Of course from equation (4) we know that this is an stimate of the likelihood of the speech being just intelligible at the listener position. .
he example shown by the arrow on Figure 14 corresponds to an average measured level ifference (LD(avg)) of 46 dB. When this is reduced by –16, the graph indicates that there is a % probability of the combination speech and noise leading to intelligible speech at the listener osition. If the LD(avg) value were higher, then this figure would indicate an even smaller robability of the transmitted speech being intelligible. These probabilities can be translated to
requency fro Hz, LS
v g) is the aver
th tio
el at the
e attenua nal betw
0
If we wish to design to achieve SNRuni32 = -16 dB, (the threshold of intelligibility), then e
(3 dB avg LD L LS − N = ( )−16, T b W n a p c a v s le e T d 1 p p
condition Figure 16 subjects ju word ver transmissio and data p simulated -30 -25 -20 -15 -10 -5 0 0.0 SNRUNI32, dB -30 -25 -20 -15 -10 -5 0 0.0 0.2 0.4 0.6 0.8 1.0 Frac ti on resp on din g -10.7 dB -15.64 dB
dicate that speech could be intelligible so many times per day or week or can be adapted to how the probability of speech being just audible rather than just intelligible.
Figure 14. Probability of speech ured LD(avg) values. The arrow
just intelligible.
OOM ACOUSTICS AND SPATIAL EFFECTS ON SPEECH PRIVACY
he procedure for assessing the eting
oms was evaluated using trans with
[29] for simulated s ashed line). . c in s 10 6 0.1
Probability of intelligible speech, %
4
being just intelligible for meas
2
illustrates the example of an LD(avg) reduced by –16 leading to a 1% probability of the transmitted speech being 1E-4 1E-3 1 LD(avg) - 16, dB 15 20 25 30 35 40 45 50 55 0.01 1 100 Risk category 5 3 R
T expected speech security of enclosed offices and me
ro mission of recorded speech sound between two rooms
separating walls having known sound transmission characteristics. Subjects stood 0.25 m from the test wall to listen to the same Harvard sentences [14] used in the original tests [29]. The test conditions were a little less well controlled than the original speech tests, but the set up more accurately represented the transmission of speech from one room to another.
Figure 15 compares the mean trends of this test with those of the earlier studies based on simulated conditions [29], showing the fraction of subjects just able to hear at lest some speech sounds. The results are remarkably similar and the two estimates for the just noticeable threshold of audibility of transmitted speech sounds are different by only 0.7 dB.
0.8 1.0
Figure 15. Comparison of the fraction of subjects just able to detect speech sounds versus SNRuni32 from speech transmission
between two rooms (solid line and data points) wit earlier results
0.2 0.4 0.6 F rac ti on resp ondi ng -21.7 dB -22.4 dB h (d
Comparison of the fraction of st able to understand at least one
sus SNRuni32 from speech
n between two rooms (solid line oints) with earlier results [29] for onditions (dashed line).
The new results also investigated the influenc noise sounds. Published studies have shown scores when the speech and noise come from the However, in real rooms speech and noise sou many reflected paths in addition to the simple di sounds (D), early-arriving reflections of sounds arriving sounds (L) affected the resulting spee
-10 -5 0 5 10 0 20 S/N(A), dB RT = 0.5 s RT = 1.0 s RT = 2.0 s
owever, the comparison of mean responses for the fraction of subjects able to understand at ast one word in Figure 16 indicates quite large differences between the two sets of results. hile Figure 15 indicates the audibility of the transmitted speech sounds were similarly related the new tests indicate
sounds. Very cent work has systematically investigated these effects and a few results will be presented
studies of the effects of reverberation on speech i
q various
se were simulated [30] in an anechoic room of speech intelligibility tests in conditions s he magnitude of the effect of reverberation
ent on the signal-to-noise ratio. For higher meeting room, the degradation of speech er al-to-noise ratios, the negative effect of security concerns, where lower signal-to-noise
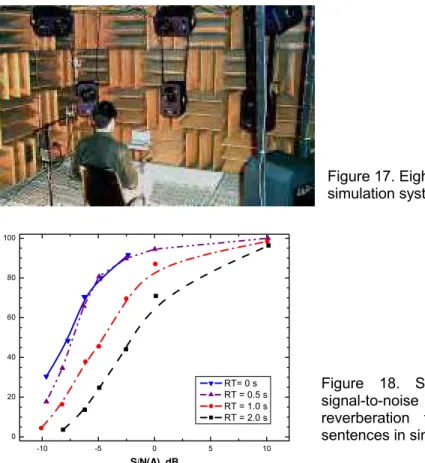
Figure 17. Eight-channel sound field simulation system in anechoic room. H
le W
to SNRuni32 values, Figure 16 suggests, that for the same SNRuni32 value,
transmitted speech is less intelligible than in the original tests and this difference results in an estimate for the threshold of intelligibility that is about 5 dB higher than the previous estimate from simulated conditions.
The differences are assumed to be due room acoustics effects such as the influence of reverberation and spatially different directions of arrival of speech and noise
re here.
It is well known that reverberation can degrade the intelligibility of speech. However, most ntelligibility are for conditions of relatively high uite well understood. Conditions with
signal-to-noise ratios for which speech can be combinations of reverberation and signal-to-noi shown in Figure 17. Figure 18 shows new results extending down to quite low signal-to-noise ratio time on intelligibility scores is seen to be depen signal-to-noise ratios, which might be found in intelligibility is relatively small. However, at low reverberation is much larger. Thus, for speech ratios are encountered, added reverberation will b effects on the intelligibility of speech.
. T d a
sign
e more important and will have larger negative
100 40 60 80 In te ll igi b ili ty , %
Figure 18. Speech intelligibility versus
e
th reater effect on intelligibility same direction in free field conditions [31]. nd
r w ch
RT= 0 s
signal-to-noise ratio for 4 different reverberation times, using the Harvard sentences in simulated sound fields [30].
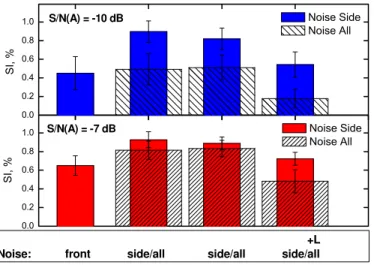
of the directions of arrival of the speech and at noise has a g
s arrive from many directions because of the ect path. The new tests investigated how direct ithin 50 ms of the direct sound (E), and later intelligibility scores. Figure 19 shows results
illustrating the effects of direction of arrival of speech and noise for two signal-to-noise ratios. The lower graph is for a signal-to-noise ratio of -7 dB and the upper for a signal-to-noise ratio of -10 dB. In each part of the graph the solid bars indicate speech intelligibility scores when the simulated ambient noise arrived from a single loudspeaker approximately 32 degrees to the side of straight ahead. The hatched bars are the results when the simulated ambient noise arrived incoherently from all 8 loudspeaker directions.
The left hand bar in both upper and lower panels is the case where speech and noise both arrive from only straight ahead of the listener. That is, for the speech there is only a direct sound. In the second solid bar from the left there is only direct speech sound from ahead of the gr es to the right of straight ahead. For both ity scores result than when speech and noise
h in the third bar from the left of each plot r s. This was because the speech level was fl ction energy. If the speech level had been -arriving refection energy, the effective signal-ch intelligibility scores would have increased.
tion energy is effectively integrated with the
h t the
g speech energy is added by adding a added late-arriving speech energy reduces which the total speech level is again held
re tly from all directions (hatched bars), it has s. That is, all hatched bars in Figure 16 indicate s lid bars. The magnitude of the effect of the ave lower intelligibility scores. For
o
lower panel –7 dB signal-to-noise, e
listener but the noise arrives from a source 32 de examples of this case higher speech intelligibil both come from straight ahead of the listener. When early-arriving reflections are added to the spe there is no significant change to the intelligibility sco held constant in spite of the addition of the early re allowed to increase with the addition of the early to-noise ratio would have increased and spee Because of the precedence effect, the early reflec direct speech sound and would increase speec reflections arrive from various directions.
ec e e
intelligibility in spite of the fact tha
Finally in the fourth bar from the left, late-arrivin reverberant decay with a 1 s reverberation time. The speech intelligibility scores for these cases in constant.
When the simulated ambient noise arrives incohe a greater negative effect on intelligibility score lower speech intelligibility than the corresponding change in noise characteristics, increases for condi example, when the signal-to-noise ratios are lower noise from all directions is larger than in the low arriving sound (reverberation), the negative effect to noise from all directions is larger.
S/N(A) = -10 dB No
n o
tions that h
as in the upper panel, the negative effect of er panel. Similarly, for the cases with late f going from noise arriving from one direction
Figure 19. Mean speech intelligibility scores for various combinations of speech and noise. D = direct speech, E = early reflection speech, L = late-arriving speech. Noise from side loudspeaker, solid bars; noise from all loudspeakers hatched bars. Upper panel –10 dB signal-to-noise,
0.0 0.2 0.4 0.6 0.8 1.0 Noise Side Noise All S I, % S/N(A) = -7 dB
Speech: +D +D +D+E +D+E
0.0 0.2 0.4 0.6 0.8 1.0 Noise All S I, %
gibility scores. When they are accounted for, the ifferences shown in Figure 16 can be quite well explained.
These results give an initial indication of the complexity of accurately assessing speech intelligibility and speech privacy in real rooms. However, actual rooms are further complicated by spectral changes to the speech transmitted through walls and by the actual amount of diffusion of the noise sounds. If the various room acoustics effects are ignored, one cannot accurately estimate the expected speech intelli
Condition
d
is Sidee
+L
oise: front side/all side/all side/all
CONCLUSIONS
Although our knowledge of the basic concepts of speech privacy are now over 50 years old, there are still some unresolved issues. The special case of speech privacy in open-plan offices has been most thoroughly investigated and it is possible to specify achievable design goals that will help to improve the work environment for occupants of open-plan offices. For enclosed offices and meeting rooms, we can give procedures and design goals that can provide practical solutions to achieving an adequate degree of speech security. However, there are many details remaining to be explored to better understand how we can help to improve speech
ommunication or speech privacy for all listeners in all types of listening environments. For
urrent forms to more completely explain conditions in room for speech.
] Cavanaugh, W.J., Farrell, W.R., Hirtle, P.W., and Watters, B.G., “Speech Privacy in Buildings”, J. Acoust. Soc. Am. 34 (4), 475-492 (1962).
] ANSI S3.5-1969, “American National Standard Methods for the Calculation of the Articulation Index”, Standards Secretariat, Acoustical Society of America, New York, USA
.
] French, N.R., and Steinberg, J.C., “Factors Governing the Intelligibility of Speech Sounds”, J.
ce”, (DBR Internal Report No. 400). Ottawa, ON: National Research Council of Canada, Division of Building Research.
ur ie p So io 034, s p r a c
example, more work is required to evaluate the use of measures that combine the effects of signal-to-noise ratios and room acoustics effects such as the Speech Transmission Index and Useful-to-Detrimental sound ratios. They may need to be expanded beyond their essentially monaural c
ACKNOWLEDGEMENTS
The author would like to acknowledge the many significant contributions to this work by his colleague Dr. Bradford Gover. He would also like to acknowledge that Ms. Marina Apfel, as a student from the Fachhochschule fűr Technik in Stuttgart Germany, spent two work terms working on aspects of this research including the subjective evaluations of the effects of room acoustics, which formed the basis for her Diploma Thesis.
EERENCES R
[1 [2 [3
Acoust. Soc. Am. 19(1) 90-119 (1947).
[4] Pirn, R., “Acoustical Variables in Open-planning”, J. Acoust. Soc., Am. 49, (5) pp. 1339-1345 (1971).
[5] Warnock, A. C. C., Henning, D. N., & Northwood, T. D. (1972, November). “Acoustical Survey of an Open-Plan Landscaped Offi
[6] Warnock, A.C.C., “Acoustical Privacy in the Landscaped Office”, J. Acoust. Soc. Am., 53, 1535-1543 (1973).
[7] “Acoustical Environment in the Open-Plan Office”, ASTM task Group E33.04C (1976). -Plan Offices Using the Articulation ement of Speech Privacy in Open ty for Testing and Materials, West eech Intelligibility Index”, American
ciety of America, New York, USA. nal Open Plan Offices”, Canadian
n”, Paper N1 [8] Moreland, J.B., “Speech Privacy Evaluations in Open
Index”, Noise Control Eng. J., 33(1) 23-32 (1989). [9] ASTM E1130-02, “Standard Test Method for Meas
Offices Using the Articulation Index,” American Soc Conshohocken, PA, U.S.A.
[10] ANSI S3.5-1997, “Methods for Calculation of the S National Standard, Standards Secretariat, Acoustical [11] Bradley. J.S., “The Acoustical Design of Convent
Acoustics, 27(3) 23-30 (2003).
[12] Bradley, J.S., “A Renewed Look at Open Office Proceedings Inter Noise 2003, Seogwipo, Korea, Augu [13] Bradley, J.S, and Gover, B.N, “Describing Levels of S Institute for Research in Construction, National Resea 138, (2003).
[14] Anon, “IEEE Recommended Practice for Speech Qu Audio and Electroacoust., pp. 227-246 (1969).
Acoustical Desig t 25-28, 2003.
eech Privacy in Open-Plan Offices”, ch Council, Ottawa, report, IRC-RR-lity Measurements”, IEEE Trans. On [15] Veitch, J.A., Bradley, J.S., Legault, L.M., Norcross, S.G. and Svec, J.M., “Masking Speech in Open-Plan Offices with Simulated Ventilation Noise: Noise Level and Spectral Composition Effects on Acoustic Satisfaction”, NRC-IRC report, IR-846, 2002.
[16] Bradley, J.S. and Wang, C., “Measurements of Sound Propagation between Mock-Up Workstations”, April 2000, IRC RR-145.
[17] Wang, C. and Bradley J.S., “A Mathematical Model for a Single Screen Barrier in Open--plan Offices”, App. Acoust., 63(8), 849-866 (2002).
[18] Wang, C. and Bradley, J.S., “Prediction of the Speech Intelligibility Index Behind a Single Screen in an Open-plan Office”, App. Acoust., 63(8), 867-883 (2002).
[19] Wang, C. and Bradley J.S., “Sound Propagation between Two Adjacent Rectangular Workstations in an Open-plan Office, I: Mathematical Modeling”, App. Acoust. 63(12), pp.
ular ), 1335-1352 (2002).
[20] Wang, C. and Bradley J.S., “Sound Propagation between Two Adjacent Rectang Workstations in an Open-plan Office, II: Effects of Office Variables”, App. Acoust. 63 (12 1353-1374 (2002).
[21] COPE-Calc software is available at http://irc.nrc-cnrc.gc.ca/ie/cope/07_e.html
[22] Sound absorption average, SAA, is defined in ASTM C423-99a, “Standard Test Method for Sound Absorption and Sound Absorption Coefficients by the Reverberation Room Method”,
ociety for Testing and Materials, West Conshohocken, PA, U.S.A.
[28] s and Applications”,
[29] Bradley, J.S., “Measures for assessing architectural speech security
[31] ing and attention related to the cocktail party problem”, Acoust. American S
[23] Warnock, A.C.C. and Chu, W., “Voice and Background Noise Levels Measured in Open Offices”, IRC Report IR-837, (2002).
[24] Olsen, W.O., “Average Speech Levels and Spectra in Various Speaking/Listening Conditions: A Summary of the Pearsons, Bennett, and Fidell (1977) Report”, J. Audiology, 7, 1-5 (1998).
[25] ASTM E336-97, “Standard Test Method for Measurement of Airborne Sound Insulation in Buildings,” American Society for Testing and Materials, West Conshohocken, PA, U.S.A. [26]ISO 140/III, “Laboratory Measurement of Airborne Sound Insulation of Building Elements –
Part IV: Field Measurements of Airborne Sound Insulation Between Rooms”, 1998-08-15. [27] JIS A 1520, “Method for Field Measurements of Sound Insulation of Windows and Doors”,
Japanese Industrial Standard, Japanese Standards Association Pierce, A.D., “Acoustics: An Introduction to its Physical Principle
McGraw Hill, New York (1981). Gover, B.N., and
(privacy) of closed offices and meeting rooms”, J. Acoust. Soc. Am., 116, (6), 3480-3490 (2004).
[30] Whittington, J.E. and Bradley, J.S., “Quantifying the Effects of Room Acoustics on Speech Intelligibility in Very Low Signal-to-Noise Ratio Environments”, J. Acoust. Soc. Am., 120 (5) Part 2, 3359 (2006).
Ebata, M., “Spatial unmask


![Figure 15 compares the mean trends of this test with those of the earlier studies based on simulated conditions [29], showing the fraction of subjects just able to hear at lest some speech sounds](https://thumb-eu.123doks.com/thumbv2/123doknet/14170818.474561/13.892.139.485.680.1164/figure-compares-earlier-studies-simulated-conditions-fraction-subjects.webp)