HAL Id: hal-03042020
https://hal.univ-lorraine.fr/hal-03042020
Submitted on 5 Dec 2020HAL is a multi-disciplinary open access archive for the deposit and dissemination of sci-entific research documents, whether they are pub-lished or not. The documents may come from teaching and research institutions in France or abroad, or from public or private research centers.
L’archive ouverte pluridisciplinaire HAL, est destinée au dépôt et à la diffusion de documents scientifiques de niveau recherche, publiés ou non, émanant des établissements d’enseignement et de recherche français ou étrangers, des laboratoires publics ou privés.
Distributed under a Creative Commons Attribution - NonCommercial - NoDerivatives| 4.0 International License
Oxygen-promoted hydrogen adsorption on activated and
hybrid carbon materials
Sébastien Schaefer, Asma Jeder, Giuseppe Sdanghi, Philippe Gadonneix, A.
Abdedayem, M.T. Izquierdo, G. Maranzana, A. Ouederni, Alain Celzard, V.
Fierro
To cite this version:
Sébastien Schaefer, Asma Jeder, Giuseppe Sdanghi, Philippe Gadonneix, A. Abdedayem, et al.. Oxygen-promoted hydrogen adsorption on activated and hybrid carbon materials. International Jour-nal of Hydrogen Energy, Elsevier, 2020, 45 (55), pp.30767-30782. �10.1016/j.ijhydene.2020.08.114�. �hal-03042020�
1
Oxygen-promoted hydrogen adsorption on
activated and hybrid carbon materials
S. Schaefer
a, A. Jeder
a,b, G. Sdanghi
a,d, P. Gadonneix
a, A.
Abdedayem
b, M.T Izquierdo
c, G. Maranzana
d, A. Ouederni
b,
A. Celzard
a, V. Fierro
a,*a
Université de Lorraine, CNRS, IJL, F-88000, Epinal, France
b
Laboratory of Research: Process Engineering and Industrial Systems (LR11ES54), National
School of Engineers of Gabès, University of Gabès, 6026 Gabès, Tunisia
c
Instituto de Carboquímica (ICB-CSIC), Miguel Luesma Castán, 4. Zaragoza. E-50018,
España
d
Université de Lorraine, CNRS, LEMTA, F-54500 Vandœuvre-lès-Nancy, France
*
Corresponding author. Tel: + 33 372 74 96 77. Fax: + 33 372 74 96 38. E-mail address :
2
Abstract
The effect of heteroatoms on hydrogen adsorption properties of activated and hybrid
carbon materials is critically described. For that purpose, olive stones were activated
chemically with KOH, and subsequently washed or not, and oxidised with ozone or not. Olive
stones were also activated physically with CO2. A series of activated carbons prepared by
chemical activation of sucrose was also investigated for comparison. As a result, many
activated carbons with different pore-size distributions, surface areas, average micropore
widths, oxygen contents and amounts of mineral matter could be compared. All were
thoroughly characterised by adsorption of N2, CO2 and H2O, elemental analysis, XPS,
thermogravimetry, and adsorption of H2 at different pressures. Many correlations between
textural parameters, composition and adsorption properties could be evidenced, and were
critically discussed. We show that the hydrogen uptake at 77 K is controlled by the following
parameters, listed by decreasing order of importance: specific surface area, average micropore
size, surface chemistry and shape of the pore size distribution. At room temperature (i.e., at
298 K), the adsorbed hydrogen uptake was in the range of 0.19 to 0.42 wt. %; the presence of
large amounts of alkali metals can further improve the hydrogen adsorption properties, but
surface chemistry still has a major influence, especially through the acidic surface functions.
Keywords: Activated carbons; Surface chemistry; Hydrogen adsorption; Acidic groups;
3
Introduction
Olive stones (OS) are by-products of olive oil extraction that are mainly burnt for heating
and cooking in domestic applications, or which are used for energy co-generation in the
industry. OS represents 16-18 wt. % of the olive mass, and therefore huge amounts of OS are
produced every year only in the Mediterranean basin. OS-derived activated carbons (ACs)
have been produced and principally used for pollutant removal in the aqueous phase [1-6]. In
these researches, the activation was carried out either physically, with CO2 or steam [1], or
chemically, with KOH or H3PO4 [2-6]; KOH activation of OS produced ACs with surface
areas as high as 1300 m2 g-1 [3].
Hydrogen adsorption at cryogenic temperatures in Metal Organic Frameworks (MOFs) [7]
exceeds the hydrogen storage capacities recommended by the US Department Of Energy (US
DOE) for automotive applications (i.e., 7.5 wt. % of the whole mass of the storage system)[8].
However, MOFs are quite expensive and, most of the time, moisture-sensitive [9]. ACs also
exhibit high hydrogen storage capacities, around 6.4 wt. % in excess at 77 K and 4 MPa [10],
but only 1 wt. % at 293K and 10 MPa [10-14]. Moreover, ACs are cheaper, easier to
synthesise than MOFs, and are often biosourced. In order to increase hydrogen–AC
interactions, and hence hydrogen adsorption capacities, doping with metal nanoparticles or
heteroatoms has been tested. On the one hand, doping with transition metal nanoparticles
improves the adsorption of hydrogen by chemisorption and spill-over [15-21] or polarised
physisorption mechanisms whenever hydrogen is adsorbed on alkali earth or Si/SiC-doped
carbon structures [22-26]. On the other hand, doping with heteroatoms such as boron [27-29],
nitrogen [30-34] or even sulphur [35] also increases the hydrogen adsorption potential of
carbon-based materials [36-38]. This increase is due to the existence of permanent
4
N and B are the heteroatoms most often introduced, and their positive effect on hydrogen
adsorption has been demonstrated [32, 34, 40-42]. The effect of oxygen content is not so
clear. Some theoretical studies have shown that the oxygen-containing functionalities in
well-ordered materials, such as carbon nanotubes or graphene-like materials, should decrease
hydrogen storage capacities both by steric hindrance in the pores and by increase of the mass
of sorbent [43]. On the contrary, other theoretical studies concluded that carbon oxidation
could lead to significantly more attractive surfaces at low pressure and low coverage degree
[44, 45]. As the amount of adsorbed hydrogen on ACs at room temperature is quite low
(typically less than 1 wt. % in excess at 10 MPa [10-13]), the coverage remains very low and
the effect of surface groups may be significant. Experimental studies showed that, after AC
oxidation with nitric acid, hydrogen peroxide, ammonium persulfate, potassium permanganate
or orthophosphoric acid [46-49], the hydrogen storage capacities decreased. This finding was
explained by the corresponding combined effects of decreased microporous volume, increased
steric hindrance, and more disordered nature of the adsorbed hydrogen layer after oxidation of
the carbonaceous surface [47, 48]. Other authors showed that, despite the decrease of textural
properties after oxidation, there is a positive effect of acidic and oxygen-containing
functionalities on adsorption energy [48], evidenced using the Dubinin-Astakhov model [50]
and explained by their strong electron-acceptor character [49].
Finally, some authors did not conclude about the effect of oxygen content on hydrogen
adsorption [51], mainly due to the cryogenic adsorption temperature that was chosen (77 K),
and for which the surface area has much more impact than small changes of surface chemistry
[51]. Besides, the corresponding materials also contained potassium residues in the form of
salts (mainly K2CO3) or metallic K, and such potassium-containing carbon structures may
induce polarised physisorption effects. Therefore, their hydrogen adsorption properties could
5
In order to definitely state on the contribution of oxygen to hydrogen adsorption, the
present study focuses on the hydrogen storage capacities obtained on activated carbons and
hybrid carbon materials. The hybrid carbon materials were synthesised following a route
similar to that used for the synthesis of activated carbons (i.e., KOH activation). The only
difference was that the materials were washed only with water instead of HCl + water, leading
to hybrid materials with a high carbonate content in the porous carbons. The latter were called
so because of their very high content of minerals, instead of just ACs despite the fact that they
followed the same classic activation process, using OS as precursor and KOH as activating
agent. We unquestionably confirmed the positive effect of oxygen, and especially acidic
functions, on the hydrogen adsorption properties at 273 K.
2. Experimental
2.1. Materials synthesis
Olive stones (OS) were provided by a local factory in Gabès (Tunisia). They were already
crushed with a particle size lower than 3 mm. OS were washed with hot distilled water for
further production of hydrochars and activated carbons (ACs).
OS-derived hydrochars were prepared by hydrothermal carbonisation (HTC) at two
different temperatures. For that purpose, 32 mL of water and 4 g of OS were poured in a
Teflon-lined autoclave (inner volume 100 mL), which was introduced in a preheated oven at
either 453 or 513 K. The autoclave remained inside for 6 hours. After cooling, the hydrochars
were washed with bi-distilled water, dried at 378 K and labelled according to their HTC
temperatures in degrees Celsius (i.e., HTC-180 and HTC-240).
Hydrochar activation was carried out by physical mixing with KOH using a
KOH/hydrochar weight ratio equal to 2:1. The mixture was next submitted to thermal
6
The latter temperature was held for 2 hours. After cooling under inert atmosphere, the
resultant ACs were washed first with hot bi-distilled water, then with a 1 mol L-1 hydrochloric acid solution, and finally with hot bi-distilled water again until neutral pH. The ACs were
labelled 180-KOH-W and 240-KOH-W. Part of them was also kept unwashed in order to
investigate the effect on hydrogen adsorption of oxygenated functionalities in such
carbonate-rich ACs. These hybrid carbons were labelled 180-KOH-UW and 240-KOH-UW.
The materials 180-KOH-W and 240-KOH-W were also oxidised with ozone in a fixed bed
reactor loaded with 0.85 g of sample under a constant ozone flow of 55 mg L-1 at 30°C for 2 hours. The as-modified materials were labelled 180-KOH-W-O3 and 240-KOH-W-O3,
respectively.
In order to compare the aforementioned chemically activated carbons with a physically
activated one, the remaining HTC-180 hydrochar was treated in a tubular furnace heated at 5
K min-1 up to 1173 K under nitrogen flow (100 mL min-1). Once the set point was reached, the N2 flow was maintained 1 hour and then replaced by a CO2 flow (50 mL min-1) for 2
hours. At the end, the oven was flushed with nitrogen again during cooling. The resultant AC
was labelled CO2_2h.
Finally, six carbonaceous materials were characterised in depth: W,
180-KOH-UW, 240-KOH-180-KOH-UW, 180-KOH-W-O3, 240-KOH-W-O3 and CO2_2h. The hydrogen
adsorption and textural properties of these carbons were compared to those of ACs prepared
by chemical activation of sucrose with KOH. Additional details about these materials, in
terms of preparation method and main characteristics, can be found elsewhere [13].
2.2. Characterisation
7
Elemental analyses (EA) of samples were carried out with a CHONS elemental analyser
(Vario El Cube, Elementar, Germany) to determine carbon, hydrogen, nitrogen and sulphur
contents (wt. %) by combustion of the samples in a stream of pure O2. In a second step,
oxygen was analysed with the same equipment using a different procedure.
The ash content was obtained by thermogravimetric analysis, using a protocol adapted
from the ASTM D2866 – 11. First, the sample was extensively dried at 383 K, and then the
temperature was increased up to 923 K at 10 K min-1 in air and was maintained for 3 h at 923 K. Next, the temperature was increased a second time up to 1023 K and held for 1 h. The ash
content was calculated as follows:
(1)
where is the final mass after the two ramps, i.e., after treatment at 1023 K. The mass after the first ramp is expected to be similar to the one after the second ramp. Indeed, the
oxidation/gasification of the carbonaceous part is supposed to be achieved at 923 K whereas
the thermal decomposition of the carbonates occurs at much higher temperature (i.e., around
1173 K or slightly less [52]).
2.2.2 X-ray photoelectron spectroscopy
X-ray photoelectron spectroscopy (XPS) was carried out with an ESCAPlus OMICROM
system equipped with a hemispherical electron energy analyser. The spectrometer was
operated at 10 kV and 15 mA, using a non-monochromatised MgK X-ray source (hν = 1253.6 eV) under vacuum (< 5 10-9 Torr). Analyser pass energies of 50 eV and 20 eV were used for survey and detailed scans, respectively. The C1s peak at 284.5 eV was used for
binding energy correction. A survey scan (1 sweep/200 ms dwell) was acquired between 1100
and 0 eV. Current region sweeps for N1s (410-390 eV), O1s (545-520 eV), C1s (300-280 eV)
8
element. The CASA data processing software allowed smoothing, Shirley-type background
subtraction, peak fitting and quantification. Atomic percentages of each element were
calculated from intensity ratios using Scofield sensitivity factors [53]. The K2s region was
used instead of using the classical K2p region (310-290 eV) for potassium quantification,
because the range of characteristic energies of K2p overlaps that of C1s [54].
2.2.3. Textural characterisation
The textural characterisation was performed by nitrogen and carbon dioxide adsorption at
77 and 273 K, respectively, using an automatic adsorption apparatus (ASAP 2020,
Micromeritics). Adsorption data were treated using the Microactive® software from
Micromeritics. Prior to gas adsorption, the samples were degassed under vacuum at 373 K
until the pressure stabilised around 0.2 to 0.4 mPa for more than 48 h. Further degassing was
carried out at the measuring port for at least 6 h. Cool and warm volumes were determined
after nitrogen or carbon dioxide adsorption to avoid helium entrapment in the narrowest
pores.
The pore size distributions (PSDs) were obtained using the non-local density functional
theory (NLDFT) from the Solution of Adsorption Integral Equation Using Splines
(SAIEUS®) routine and combining N2 (77 K) and CO2 (298 K) adsorption data [55]. The
smoothing parameter λ was set constant and equal to 4.5 for all samples in order to allow
comparison between the different PSDs. The average micropore width, L0, NLDFT (nm) was
calculated using this PSD. The mesopore volume was calculated by subtracting the micropore
volume obtained from the NLDFT method, Vmic NLDFT (cm3 g-1), to the total pore volume, Vtot
9
method was also used to determine the surface area, (m2 g-1), by integrating the PSDs
over the whole range of pore sizes [56].
2.2.4. Water adsorption
Water adsorption experiments were carried out using a 3-Flex (Micromeritics) automatic
adsorption apparatus. 0.2 g of each material were first degassed as described in subsection
2.2.3, and dead volumes were determined after adsorption-desorption. Water adsorption
isotherms were carried out at 293.15 K and analysed in two ranges of relative pressure. The
water uptake in the lowest pressure range (P/P0 < 0.15) was assumed to be related to the
surface chemistry of the material, and essentially to oxygenated groups in agreement with
previous studies [57-61]. Water isotherms were linearized in the low-pressure range using Henry’s law, Eq. (2), where Q (cm3
g-1) is the STP amount of adsorbed water, and the as-obtained Henry’s constants, K, were then compared for the different materials.
(2)
2.2.5. Hydrogen adsorption
Hydrogen adsorption experiments were carried out at 288.15, 298.15 and 308.15 K using a
HPVAII automatic adsorption apparatus (Micromeritics). The temperature control was set to
293.15 K for the cold volume measurement and then was changed to 298.15 K for the warm
volume measurement and for the experiments. The pressure steps for adsorption were in the
range 0.05 to 10 MPa, while those for desorption were in the range of 10 to 2 MPa. A 10 cm3 cell was used for an average sample amount of 1 g. The contribution of the empty cell was
systematically measured and subtracted to all data in order to improve the accuracy. The
absolute adsorbed amount was calculated from the excess, using the following equation [18]:
10
where excess Nex and absolute Nabs adsorbed amounts are both expressed in ,
(Pa) is the absolute pressure, (g mol-1) is the molecular weight of H2, its
compressibility factor at the considered pressure and temperature T (K), is the density of liquid hydrogen (70.849 kg m-3) and R is the molar gas constant (8.314 J mol-1 K-1) [18]. The isosteric heat of adsorption, Qst (kJ mol-1), was calculated using the Microactive® software
from Micromeritics, based on the Clausius-Clapeyron equation:
(4)
applied to the three obtained isotherms. A (weighted) average Qst value was also calculated
over the 0 – 1 mmol.g-1 range of adsorbed hydrogen amounts.
3. Results and discussion
3.1 Composition and surface chemistry
C, N and K contents can be found in Table S1 of the supplementary information. Usually,
the oxygen contained in quinoid carbonyls is named OI and modelled by a
Lorentzian-Gaussian (70 % - 30 % mix, respectively) peak centred in the 531-531.9 eV range [62]. Using
the same model of peaks, the carbonyl oxygens in esters, anhydrides and hydroxyls can be
assigned to the 532.3-532.8 eV range and are usually named OII [62-64]. The peak for
non-carbonyl oxygen (ether type) in esters or anhydrides is located in the 533.1-533.8 eV range
and is named OIII. The peak for oxygen contained in carboxylic acids is assigned to the
534.3-535.4 eV range and is named OIV. One last peak, which concerns adsorbed water or
oxygen present on the surface of the material during the XPS analysis is assigned to the
536-536.5 eV range and is named OV [63, 64]. In our case, the contributions of the OII and OIII
11
of these groups. Thus, here, OI still stands for the peak assigned to oxygen in the quinoid
carbonyl groups, OII stands for the peak assigned to oxygen either contained in esters and
anhydrides (in carbonyl groups and ether-like bridges) and in hydroxyl groups, OIII stands for
oxygen in carboxyl groups, and Oads* corresponds to adsorbed oxygen (i.e., water or O2), in
agreement with other authors [65, 66]. Due to the high content of inorganic matter, the
assessment of the elemental composition using EA does not allow reaching 100 wt. %.
Indeed, the inorganic fraction, which mainly contains potassium carbonate, remains partly
undetected when using the CHONS elemental analyser. This undetected inorganic fraction
can be composed of K2CO3 (i.e., having survived the combustion of the sample), K2O
(potassium oxide), KHCO3 (potassium bicarbonate) or KOOCH (potassium formate). The
latter chemical species can be formed from K2CO3 in the presence of CO2 [67], CO2/H2O mix
and H2 [68]. Potassium can also be volatilised in equivalent processes [67]. Consequently, the
missing mass fraction from the EA (up to 15.7 wt. % for the material 180-KOH_UW) was
modelled as a fifth compound, in addition to the four aforementioned chemical species. For
each model compound and materials, the elemental composition from EA was corrected and
presented in Table S2. The comparison of the K contents using EA and XPS is also given in
Figure S1. Due to the similarity of results between EA and XPS when only considering
volatilised potassium (K) and taking into account the high temperature of the heating elements
of the elemental analyser (> 1273 K), we can deduce that the missing fraction most likely
contains gaseous potassium (K).
Figure 1.a) shows the XPS spectra in the O1S region and Figure 1.b) shows a comparison
between the oxygen content determined by XPS and EA for all the materials. The comparison
between potassium contents obtained by XPS and EA is also presented in the insert of Figure
1.b). Oxygen contents determined by XPS were always higher than obtained by EA, which
12
likely to be found at the surface due the higher reactivity of the carbon atoms located at the
edges of the carbon layers [69] and to the easier contact with the activation agent [70]. Similar
reasoning can be applied to potassium. Due to the activation process of olive stones,
potassium carbonate is most likely located on the surface of the activated carbon.
Figure 1: a) XPS spectra for the O1S region of the materials, b) oxygen content from
elemental analysis (EA) versus the one from XPS, c) deconvolution of the O1S spectrum of the 180_KOH_UW material, d) oxygen content in different oxygen-containing functions (XPS) versus total oxygen content obtained by XPS (all the results are expressed with respect to the total mass/quantity of matter).
Figure 1.c) shows an example of O1s peak deconvolution for the sample 180_KOH_UW,
whereas Figure 1.d) shows the O content in each type of surface function for all materials.
13
followed by quinoid carbonyl groups (OI) and O from adsorbed water and O2 (Oads*).
Finally, oxygen content in carboxylic groups (OIII) was always lower than 5 at. %. The
importance of the oxygen from esters, anhydrides, hydroxyls and from quinoid carbonyl
groups (OII and OI, respectively) might be due to carbon oxidation either by direct contact
with potassium hydroxide and carbonate or through oxidation by steam and/or carbon dioxide
produced in the chemical activation reaction. Some studies indeed showed that ACs prepared
under oxidising atmospheres at high temperatures have a more basic character than those
oxidised in solution [70, 71]. Despite such globally basic character, carboxylic acids as well
as anhydrides and hydroxyls were detected, evidencing the amphoteric nature of the ACs in
agreement with previous studies [72] [73]. The different oxygen groups and their
concentrations at the surface are shown in Figure 1.d) (with respect to total amount of matter)
and in Table S3 (in percentage of oxygen content).
Figure 2.a) shows the K content as a function of ash content. Without surprise, the
unwashed materials had very high ash contents, 40 wt. %, from where their names of “hybrid carbon materials”. This is in agreement with the very high amount of K detected by
XPS, 5.9 at. % and attributed to K2CO3, formed during KOH activation.
Figure 2: a) Potassium content from XPS versus ash content, b) oxygen content from EA
(corrected values) or XPS versus ash content.
14
The washed materials (180_KOH_W_O3 and 240_KOH_W_O3) have similar ash content
to the CO2-activated one (CO2_2h). The origin of the ashes in sample CO2_2h resides in the
precursor itself. Indeed, it is well known that lignocellulosic biomass contains metal salts,
oxides and hydroxides. In the case of olive stones, the metals are mostly K+ and Ca2+ [74, 75]. As no signal in the K2p region was detected for these three materials (180_KOH_W_O3,
240_KOH_W_O3 and CO2_2h), K must be absent from the outer surface. The presence of K
(1.9 at. %) in 180_KOH_W might be due to the intercalation of potassium in the graphite-like
domains of the AC [76].
Figure S2 shows the differential thermogravimetric curves of all carbonaceous materials
investigated in this study. Unwashed materials show a large peak located close to 540 K
attributed to the desorption of water chemisorbed on carbonates [77] and to the partial
desorption of carboxylic groups [70, 78]. A good correlation between the oxygen contents
obtained by integrating the OIII - Oads* peaks and from the mass loss related to the peak at
540-575 K was found and shown in Figure S3.a) and b). Such correlation between the results
of XPS, differential thermogravimetry and references of literature [70, 78] clearly highlights
and validates the presence of carboxyl groups on the surface of the materials. The peak of
Oads* was slightly shifted, 536.6-537.5 eV instead of 535.2-534.4 eV, due to the presence of
carbonates and occluded CO or CO2, which can be detected in the 537.0-537.2 eV range [65,
66]. Thus, the peaks of Oads* should be considered as merged from the peaks of chemisorbed
O and H2O but also of occluded CO and CO2 [66].
Figure 2.b) shows clear trends between the oxygen contents determined by XPS (O-XPS)
and EA (O-EA, corrected values) and the ash content; the best (linear) correlation was found
between O-EA and ash content. Therefore, O-EA should be more representative than O-XPS,
15
following, O-EA results will be considered as representative of the total oxygen content,
while O-XPS results will be considered only for discussing phenomena taking place on the
surface. For the sake of comparison with previous studies [13], the O-EA that will be used in
the following figures is the uncorrected one (i.e., taken from Table S1).
3.2 Porous texture and affinity for water
Figure S4.a) and b) shows N2 and CO2 adsorption isotherms, respectively. All N2
adsorption isotherms were type Ia or Ib, thus evidencing the microporous nature of the
materials. The treatment of N2 and CO2 isotherms using the SAIEUS® software allowed
obtaining the specific surface areas, SNLDFT, which varied from 536 to 1478 m2 g-1 for
240_KOH_UW and 180_KOH_W_O3, respectively. All the materials had very similar pore
sizes (0.76 nm ± 0.02 nm) while CO2_2h had an average pore width of 0.65 nm and a much
lower micropore volume (Figure S5). The washed materials (180_KOH_W,
180_KOH_W_O3 and 240_KOH_W_O3) exhibited much higher surface areas, from 1217 to
1478 m2 g-1, than the unwashed ones (180_KOH_UW, 240_KOH_UW), from 536 to 655 m2 g-1, likely due to the opening of pores formerly blocked by potassium salts. The surface areas of the washed materials are in agreement with those reported in the literature for OS-derived
ACs [3, 79, 80].
Figure 3.a) shows the PSDs of the OS-derived materials. All showed two peaks in the
ranges 0.4-0.55 nm and 1.2-1.6 nm. The first peak is the most intense and evidences their
ultramicroporous nature. Figure 3.b) shows their main textural properties. Figure S6 shows
the exceptionally high fractions of pores narrower than 0.5 nm for the OS-derived materials,
compared to those of sucrose-derived ACs [13]. This is due to the high lignin content in OS.
Indeed, differently from hemicellulose and cellulose that are also present in biomass, lignin
16 Figure 3: a) Pore size distributions obtained from the NLDFT method for all OS-derived
materials and b) Total (Vtot), microporous (Vmic) and mesoporous (Vmeso) pore volumes, and
micropore and mesopore fractions.
Figures 4 and S7 show water adsorption isotherms at 295.13 K. Those of 180_KOH_UW
and 180_KOH_W materials were type II according to the IUPAC classification [87]; they had
an S-shape and presented a strong increase of adsorbed amount at high relative pressure,
indicating the very hydrophilic nature of the materials surface. The water isotherm of
180_KOH_W presented a smooth step at moderate relative pressure that might be associated
to a combination of type VI isotherm with an unusual stepwise water adsorption [87]. Those
of 180_KOH_W_O3 and 240_KOH_W_O3 were type IV according to the IUPAC
classification [87]; the pronounced knee at low relative pressure is indicative of their
hydrophilic nature and the multiplicity of adsorption sites for water. The water adsorption
isotherm on the CO2_2h material was type V, suggesting the lower hydrophilic character of
this material compared to the others [87]. The insert in Figure 4.a) shows the linear fit of the
water isotherms in the low-pressure range (P/P0 < 0.15) in order to obtain the apparent
Henry’s constant, corresponding to the slope.
17
Figure 4: a) H2O adsorption isotherms (303.15 K) and corresponding linear regressions in the
low-pressure range (insert), b) Apparent Henry’s constants versus O content obtained from EA (empty symbols) or XPS (full symbols) and c) apparent Henry’s constants versus O content for different types of surface groups (OI, OII, OIII and Oads*).
Figures 4.b) and S8 show the as-obtained apparent Henry’s constants as a function of the
O content obtained by EA and XPS measurements. The best linear fit was obtained when
using the O content from EA, giving relevant information on the bulk. There are indeed
important differences between the surface chemistry of the outer surface of carbon particles
and that of their inner pores [69, 70]. Water adsorption was measured at equilibrium, giving
time to water molecules to diffuse towards the narrowest pores and, therefore, experiments
lasted more than 10 days. For this reason, EA is more representative than XPS for describing
the impact of surface chemistry on adsorption phenomena. Figure S8 shows the very poor correlation between the aforementioned Henry’s constant and the textural parameters (i.e.,
average micropore size and microporous volume). Thus, within the low pressure range (P/P0
18
between H2O molecules and oxygenated adsorption sites and, possibly, carbonates. The
surface groups influencing most the adsorption of H2O within the low-pressure range are the
carboxyls (OIII from Figure 4.c.)). Indeed, acidic groups are well known H-bond donors that
make them very attractive for water adsorption and that can explain this trend [88, 89]. The
poor quality of the linear regression is due to the low amount of such surface groups (OIII <
5.6 at. % on the total atomic content).
3.3 Hydrogen adsorption
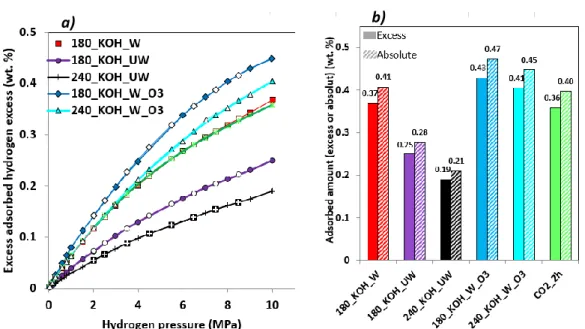
Figure 5.a) shows the hydrogen adsorption isotherms at 298.15 K on all the materials
investigated here. The isotherms exhibited no hysteresis between adsorption and desorption,
proving that neither leaks nor irreversible adsorption phenomena occurred during the
experiments. Indeed, no chemisorption took place, which is supported by the absence of
abrupt initial increase of adsorbed amount at extremely low pressure [18]. The curvature of
the isotherms is due to the progressive saturation of the most attractive pores. The maximal
excess hydrogen adsorbed amounts are in the range 0.19-0.45 wt. %. Such values below 1 wt.
% at room or near room temperatures agree with the literature for materials of similar surface
area [10-13]. Switching from excess to absolute adsorbed amounts [13] does not change the
curvature, the order of magnitude of the hydrogen storage capacity, or the relative position of
19 Figure 5: a) Excess hydrogen adsorption (full symbols) – desorption (empty symbols)
isotherms (298.15 K), and b) comparison between adsorbed excess and absolute adsorbed amounts at 298.15 K and 10 MPa.
Figure 6.a) shows the changes of the excess H2 adsorbed amount with the micropore
volume. The slope of the curve was higher at low microporous volume, for which most
micropores are in the 0.5-0.7 nm range (see Figure 6.b)) in agreement with previous results
[13, 90]. Cabria et al. indeed suggested that the optimal pore size for hydrogen adsorption on
activated carbon at room temperature is around 0.6 nm [90]. Above 0.4-0.5 cm3 g-1, the pore volume in the 0.5-0.7 nm range was almost constant, and thus the increase of pore volume
and hydrogen adsorption capacity was due to pores within the 0.7-2 nm range. This increase
was less pronounced than the one induced by the increase of pore volume in the 0.5-0.7 nm
range. We had already shown [91] that, although the optimal pore diameter for hydrogen
storage ranges from 0.5 to 0.7 nm [92, 93],pores wider than 0.7 nm are essential to reach high
hydrogen storage capacities at 77 K. This is due to the necessity of high surface area, which
cannot be developed without broadening the PSD. The same conclusion applies to hydrogen
storage at room temperature.
20 Figure 6: a) Excess adsorbed hydrogen amount at 298.15 K and at two different pressures (2
MPa and 10 MPa) as a function of micropore volume, and b) dependence between the volume of different ranges of pore sizes (i.e., 0-0.5, 0.5-0.7 and 0.7-2 nm) and the micropore volume.
Some authors suggested to take into account both the average micropore size and the
specific surface area to better understand the influence of surface properties on hydrogen
adsorption [94]. According to those authors, dividing the absolute hydrogen adsorbed by the
surface area and representing this amount (H2, abs/SNLDFT) versus the average micropore size,
L0, should reveal the influence of surface chemistry on hydrogen adsorption under specific
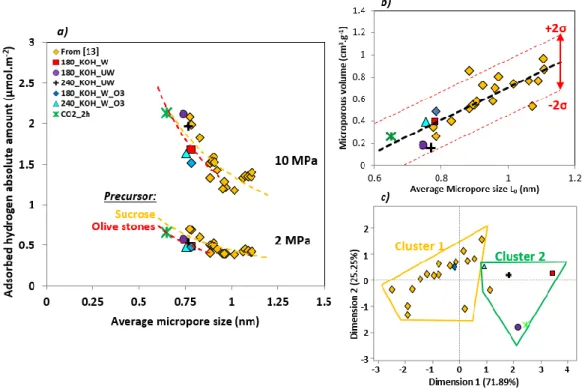
pressure and temperature conditions. Figure 7.a) shows the evolution of H2, abs/SNLDFT with
L0, at 2 and 10 MPa: the increase of L0 produced a decrease of H2, abs/SNLDFT, whatever the
pressure. Indeed, the increase of the average micropore size induced a decrease of adsorption
potential, which can be modelled by the Steele’s potential [95, 96].
The differences between carbons derived from OS (OS-ACs) and from sucrose (S-ACs)
can be attributed either to the surface chemistry or to the PSD. If the average pore size is a
good indicator of textural properties, it does not account for the shape of the PSDs. Figure
7.b) shows that OS-ACs and S-ACs follow the same trends when it comes to compare the
21
PSDs. Thus, the use of the principal component analysis with the R software (FactoMineR®
package) allowed performing hierarchical clustering for all the materials. Herein, we
considered the pore volumes in the different ranges of pore sizes (i.e., <0.5, 0.5-0.7, 0.7-2 nm
and >2nm) as principal components. Figure 7.c) shows the results of this clustering and it can
be noticed that, regarding the PSDs, OS-ACs and S-ACs belong to two different families.
Here, it is possible to estimate that the PSDs of OS-ACs is less adapted than those of S-ACs
for hydrogen adsorption, due to the importance of the narrowest pores (i.e., <0.5 nm) (see
again Figures S5 and S6). Indeed, too narrow pores (i.e., below 0.5 nm) are less desirable for
hydrogen adsorption in activated carbons than wider ones (i.e., between 0.5 and 0.7 nm). This
finding is in agreement with the conclusions of Cabria et al. [90], and Xia et al. [12],
according to which the optimum pore size for hydrogen adsorption is around 0.6 nm.
Figure 7: a) Absolute adsorbed amount of hydrogen (298.15 K) per unit of surface area as a
function of average micropore size at two different pressures (2 MPa and 10 MPa), b) Microporous volumes as a function of average micropore size, and c) Clustering realised by principal component analysis on the pore volumes corresponding to different ranges of pore sizes (<0.5, 0.5-0.7 and 0.7-2 nm) for all the materials.
22
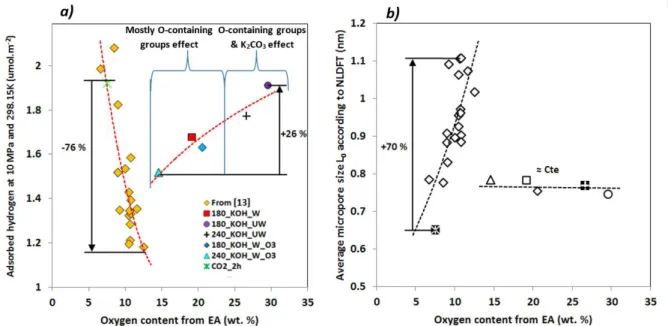
Figure 8.a) shows the quantity H2, ads/SNLDFT at 10 MPa for S-ACs and OS-derived
materials as a function of the O content. A clear positive trend is clearly observed for the
OS-ACs. However, any effect of the oxygen content is hindered by the related changes of L0 for
S-ACs. Figure 8.b) shows the dependence between L0 and the oxygen content from EA. For
the S-ACs, L0 increased significantly (+70%) for a moderate (+6%) increase of the O content,
indicating that activation created porosity but also widened existing pores through a mild
oxidation of the material. This leads to the impossibility of evaluating the effect of oxygen
content for S-ACs.
In contrast, the changes of L0 with the O content were not significant for OS-ACs, and
therefore the effect of both parameters can be separated. The increase of O content (around 15
wt. %) for this set of samples led to an increase of 26 % of the hydrogen storage capacity.
Although it has been evidenced that intercalated K can improve the hydrogen adsorption
properties of the materials through polarised physisorption or chemisorption mechanism [22,
23, 76], the correlation between H2, abs/SNLDFT and O content was better than that based on K
content (Figure S10), indicating that oxygen must play a major role in the improvement of
the surface adsorption properties. In addition, the materials 180_KOH_W, 180_KOH_W_O3
and 240_KOH_W_O3 have been previously washed. Thus, as evidenced above, they do not
contain a large amount of potassium, so the observed effect is mostly due to the oxygenated
surface groups. Concerning the samples 180_KOH_UW, and 240_KOH_UW, the additional
positive effect can be attributed to both the oxygen groups and to the remaining K2CO3. Since
K2CO3 also contains oxygen, the oxygen content is one of the main factors explaining the
increase in adsorbed hydrogen amount per unit of surface area. Thus, in the case of these
hybrid materials, even if the potassium (either intercalated or present in K2CO3) might play a
role in such adsorption enhancement, the oxygen content is a better descriptor than the
23
Figure 8: a) Absolute adsorbed hydrogen amount per unit of surface area (H2, abs/SNLDFT) at
10 MPa and 298.15 K versus oxygen content from elemental analysis, and b) Dependence between average micropore size and oxygen content from elemental analysis (uncorrected data).
This positive effect of oxygen on hydrogen adsorption was also confirmed by Figure 9.
Here, the three parameters H2, abs/SNLDFT, L0, and the oxygen content, are taken into account in
the form of a 3D-plot (Figure 9.a)). The correlation circle from the Principal Component
Analysis (Figure 9.b)) shows a positive effect of O content on H2, abs/SNLDFT, while the
increase of the average micropore size has a negative effect.
Figure 9: a) 3D plot of the absolute adsorbed amount of hydrogen per unit of surface area at
298.15 K and 10 MPa versus the average micropore size and the oxygen content (obtained from EA), and b) Correlation circle obtained from a Principal Component Analysis between the two aforementioned quantities.
a)
24
More specifically, Figure 10 confirms the importance of acidic groups (OIII from XPS)
and their strong electron-acceptor character. When fitting a linear equation to the hydrogen
capacities plotted as a function of the amounts of different types of oxygen, we observed that
the determination coefficients and the slopes were both maximum when using OIII and Oads*.
As the carboxylic acids are very hydrophilic, we can estimate that there is a strong correlation
between the oxygen content due to the OIII type functions and the oxygen content related to
Oads*. Thus, the strong electron-acceptor character of acidic functions, and especially
carboxylic acids, together with the difference of electronegativity between carbon and oxygen
inducing the formation of partial charges and polarised physisorption thus [22, 23], should
play a major role on hydrogen adsorption. In addition, it has been evidenced that carboxylic
functions can induce surface charge-induced dipoles and surface charge-quadrupole
interactions [39]. Moreover, some authors suggest that oxygen contained in the carbon
structure promotes the accessibility of hydrogen to the surface [97]. Thus, if ACs having high
oxygen content exhibited lower hydrogen adsorption capacities it was due to o the lack of
25 Figure 10: Correlation between the amounts of the different types of oxygen from XPS and
the adsorbed hydrogen amounts per unit of surface area (10 MPa, 298 K)
The isosteric heats of adsorption Qst were calculated using the isosteric method and a set of
three isotherms for each material (283.15, 298.15 and 313.15 K). The Qst of two of the
OS-derived materials are presented in Figure 11.a). The uncertainty in the calculation of Qst
calculated by the isosteric method is generally estimated to be about 30 % of the value
obtained. For the sake of clarity, the uncertainties have not been presented in the graphs.Qst
exhibits a decrease in the very low coverage range, 0-0.2 mmol g-1, which is due to the saturation of the most attractive adsorption sites when adsorption proceeds. The oscillations
of Qst with the surface coverage are due to measurement uncertainties. Although the error may
seem quite large, it has been proved that the isosteric method gives similar Qst as those given
by the application of the modified Dubinin-Astakhov equation [98]. Adsorption calorimetry is
also a relevant technique for the determination of Qst. Kloutse et al. [99] compared the Qst
values for H2 adsorption on MOFs and found a good correlation between the values obtained
by the isosteric and the calorimetric-volumetric methods. Figure 11.b) shows, for the sake of
comparison, the average Qst of all other materials in the 0-1 mmol g-1 range, as a function of
L0. The uncertainty is, in most cases, between 0.1 and 2.5 kJ.mol-1. Most Qst values are higher
than the theoretical ones and, at given pore sizes, higher than those of S-ACs. Indeed, in the
0.6-1.0 nm pore size range, the theoretical isosteric heats of adsorption are in the 6-7 kJ mol-1 range [100] whereas those of S-ACs and OS-ACs are in the 7-9 kJ mol-1 and 6-11 kJ mol-1 ranges, respectively. These high values are due to polarised physisorption phenomena. Indeed,
the presence of oxygen or alkali induces the formation of partial charges enhancing the
26
Finally, the surface groups were modelled using the Avogadro® software (Figure 12). The
calculation of the partial charges and the mapping of the electrostatic potential was carried out
after a geometric optimization of the local environment of the surface groups, using the
Gasteiger-Marsili methodology and a Van-der-Waals surface model [101].
Figure 11: a) Isosteric heats of adsorption of samples 180_KOH_W and 240_KOH_W_O3
(obtained using the 288.15, 298.15 and 308.15 K adsorption isotherms), and b) average isosteric heats of adsorption versus average micropore size compared to the theoretical ones for carbon slit-shaped pores [13] (with red dashed line from Schindler and LeVan [100]).
27
Figure 12:Mapping of electrostatic potential (MEP) and local charges on oxygen-containing
model structures of activated carbons.
It can be noticed that the maximum partial charges are obtained for the ester bridge
(+0.706 e), anhydride (+0.706 e) and carboxyl (+0.634 e) structures. Thus, if the ester bridges
and anhydride structures are excluded, the mapping of electrostatic potential (MEP) and local
partial charges explains the good correlation between the hydrogen adsorption properties and
the amount of oxygen of type OIII, corresponding to carboxyls that indeed have the strongest
partial charges. It also indicates that, for this set of OS-derived samples, the type OII might be
mainly composed of hydroxyl and carbonyl groups. As explained above (Figure 10) and
according to some authors, the electron-acceptor (H-donor) character of the carboxyl groups
could explain such behaviour [22, 23]. Carboxyl groups might promote surface
charge-quadrupole and surface charge-induced dipole interactions and, therefore, increase the
hydrogen adsorption performances [39]. In addition, structures containing carboxyls can form
surface alkali metal complexes (e.g. with lithium and sodium) [102]. This suggests that such
alkali metal complexes could possibly promote specific interactions between hydrogen and
the substrate (i.e., multiple Coulomb and Kubas interactions) [102, 103].
Conclusion
Activated and hybrid carbon materials with high oxygen contents, up to 26.6 wt. %
according to elemental analysis, and high surface areas, up to 1478 m2 g-1, were prepared from olive stones (OS). XPS analysis of oxygen content allowed concluding that, despite the
basic nature of the activating agent (KOH), the resultant ACs had an amphoteric nature. We
established that acidic functions at the surface of the carbons had a strong influence on water
28
We have found that hydrogen adsorption is controlled by the following parameters, listed
by decreasing order of importance: specific surface area, average micropore size, surface
chemistry and shape of the pore size distribution. We have evidenced the influence of the
average micropore size, surface chemistry and shape of the pore size distribution by dividing
the adsorbed amount by the specific surface area. Comparing OS-ACs with sucrose-based
ones (S-ACs), it was observed that OS-derived materials have similar average micropore sizes
to S-ACs, but have generally lower hydrogen capacities. This finding was explained by the
shape of the pore size distribution that is less adapted than that of S-ACs because of its high
fraction of very narrow pores (below 0.5 nm). This trend was evidenced by a statistical
(Principal Component) analysis that was run on the different pore volumes (<0.5 nm, 0.5-0.7
nm and 0.7-2 nm).
Even though the alkali metal can play a role in improving the hydrogen adsorption
properties, surface chemistry - particularly through the oxygen content - has a strong
influence on hydrogen adsorption near room temperature. At 10 MPa, the variation in oxygen
content explains most of the 26% increase of adsorbed hydrogen amount per unit of surface
area. The acidic functions seem to play an important role in such improvement.
Acknowledgement
This study was partly supported by the French PIA project “Lorraine Université
d’Excellence,” reference ANR-15-IDEX-04-LUE. We gratefully acknowledge the financial
29
References
[1] A.H. El-Sheikh, A.P. Newman, H.K. Al-Daffaee, S. Phull, N. Cresswell, Characterization of activated carbon prepared from a single cultivar of Jordanian Olive stones by chemical and physicochemical techniques, Journal of Analytical and Applied Pyrolysis 71(1) (2004) 151-164.
[2] N.T. Abdel-Ghani, G.A. El-Chaghaby, M.H. ElGammal, E.S.A. Rawash, Optimizing the preparation conditions of activated carbons from olive cake using KOH activation, New Carbon Materials 31(5) (2016) 492-500.
[3] A. Bacaoui, A. Yaacoubi, A. Dahbi, C. Bennouna, R.P.T. Luu, F.J. Maldonado-Hodar, J. Rivera-Utrilla, C. Moreno-Castilla, Optimization of conditions for the preparation of activated carbons from olive-waste cakes, Carbon 39(3) (2001) 425-432.
[4] T.M. Alslaibi, I. Abustan, M.A. Ahmad, A. Abu Foul, Comparative studies on the olive stone activated carbon adsorption of Zn2+, Ni2+, and Cd2+ from synthetic wastewater, Desalination and Water Treatment 54(1) (2015) 166-177.
[5] L.B. Khalil, B.S. Girgis, T.A.M. Tawfik, Decomposition of H2O2 on activated carbon obtained from olive stones, Journal of Chemical Technology and Biotechnology 76(11) (2001) 1132-1140.
[6] A.R. Yeddou, B. Nadjemi, F. Halet, A. Ould-Dris, R. Capart, Removal of cyanide in aqueous solution by oxidation with hydrogen peroxide in presence of activated carbon prepared from olive stones, Minerals Engineering 23(1) (2010) 32-39.
[7] O.K. Farha, A.O. Yazaydin, I. Eryazici, C.D. Malliakas, B.G. Hauser, M.G. Kanatzidis, S.T. Nguyen, R.Q. Snurr, J.T. Hupp, De novo synthesis of a metal-organic framework material featuring ultrahigh surface area and gas storage capacities, Nature Chemistry 2(11) (2010) 944-948.
[8] L.E. Klebanoff, J.O. Keller, 5 years of hydrogen storage research in the U.S. DOE Metal Hydride Center of Excellence (MHCoE) (vol 38, pg 4533, 2013), International Journal of Hydrogen Energy 38(19) (2013) 8022-8022.
[9] H.L. Huang, J.R. Li, K.K. Wang, T.T. Han, M.M. Tong, L.S. Li, Y.B. Xie, Q.Y. Yang, D.H. Liu, C.L. Zhong, An in situ self-assembly template strategy for the preparation of hierarchical-pore metal-organic frameworks, Nature Communications 6 (2015).
[10] V. Fierro, A. Szczurek, C. Zlotea, J.F. Mareche, M.T. Izquierdo, A. Albiniak, M. Latroche, G. Furdin, A. Celzard, Experimental evidence of an upper limit for hydrogen storage at 77 K on activated carbons, Carbon 48(7) (2010) 1902-1911.
[11] S. Sircar, C.-Y. Wang, A.D. Lueking, Design of high pressure differential volumetric adsorption measurements with increased accuracy, Adsorption-Journal of the International Adsorption Society 19(6) (2013) 1211-1234.
[12] K. Xia, J. Hu, J. Jiang, Enhanced room-temperature hydrogen storage in super-activated carbons: The role of porosity development by activation, Applied Surface Science 315 (2014) 261-267.
[13] S. Schaefer, V. Fierro, M.T. Izquierdo, A. Celzard, Assessment of hydrogen storage in activated carbons produced from hydrothermally treated organic materials, International Journal of Hydrogen Energy 41(28) (2016) 12146-12156.
[14] G. Sdanghi, G. Maranzana, A. Celzard, V. Fierro, Hydrogen Adsorption on Nanotextured Carbon Materials, Hydrogen Storage Technologies (2018) 263-320.
[15] N.R. Stuckert, L. Wang, R.T. Yang, Characteristics of Hydrogen Storage by Spillover on Pt-Doped Carbon and Catalyst-Bridged Metal Organic Framework, Langmuir 26(14) (2010) 11963-11971. [16] G.M. Psofogiannakis, G.E. Froudakis, Fundamental studies and perceptions on the spillover mechanism for hydrogen storage, Chemical Communications 47(28) (2011) 7933-7943.
[17] W. Zhao, V. Fierro, C. Zlotea, M.T. Izquierdo, C. Chevalier-Cesar, M. Latroche, A. Celzard, Activated carbons doped with Pd nanoparticles for hydrogen storage, International Journal of Hydrogen Energy 37(6) (2012) 5072-5080.
[18] S. Schaefer, V. Fierro, A. Szczurek, M.T. Izquierdo, A. Celzard, Physisorption, chemisorption and spill-over contributions to hydrogen storage, International Journal of Hydrogen Energy 41(39) (2016) 17442-17452.
30 [19] D.S. Pyle, E.M. Gray, C.J. Webb, Hydrogen storage in carbon nanostructures via spillover, International Journal of Hydrogen Energy 41(42) (2016) 19098-19113.
[20] L. Wei, Y.B. Mao, Enhanced hydrogen storage performance of reduced graphene oxide hybrids with nickel or its metallic mixtures based on spillover mechanism, International Journal of Hydrogen Energy 41(27) (2016) 11692-11699.
[21] J.H. Guo, D.D. Liu, X.D. Li, H.Y. Liu, G. Chen, Pt-4, Pd-4, Ni-4, and Ti-4 catalyzed hydrogen spillover on penta-graphene for hydrogen storage: The first-principles and kinetic Monte Carlo study, International Journal of Hydrogen Energy 43(4) (2018) 2247-2255.
[22] L. Duclaux, S. Los, P. Azais, R. Pellenq, Y. Breton, O. Isnard, Deuterium adsorption in carbon single walled carbon nanotubes doped by lithium and potassium: Adsorption isotherms and in situ neutron diffraction, Journal of Physics and Chemistry of Solids 67(5-6) (2006) 1122-1126.
[23] R.J.M. Pellenq, F. Marinelli, J.D. Fuhr, F. Fernandez-Alonso, K. Refson, Strong physisorption site for H-2 in K- and Li-doped porous carbons, Journal of Chemical Physics 129(22) (2008).
[24] Y.W. Wen, F. Xie, X.L. Liu, X. Liu, R. Chen, K. Cho, B. Shan, Tunable H-2 binding on alkaline and alkaline earth metals decorated graphene substrates from first-principles calculations, International Journal of Hydrogen Energy 42(15) (2017) 10064-10071.
[25] S. Schaefer, G. Muniz, M.T. Izquierdo, S. Mathieu, M.L. Ballinas-Casarrubias, G. Gonzalez-Sanchez, A. Celzard, V. Fierro, Rice straw-based activated carbons doped with SiC for enhanced hydrogen adsorption, International Journal of Hydrogen Energy 42(16) (2017) 11534-11540.
[26] J.H. Cho, S.J. Yang, K. Lee, C.R. Park, Si-doping effect on the enhanced hydrogen storage of single walled carbon nanotubes and graphene, International Journal of Hydrogen Energy 36(19) (2011) 12286-12295.
[27] A. Ariharan, B. Viswanathan, V. Nandhakumar, Hydrogen storage on boron substituted carbon materials, International Journal of Hydrogen Energy 41(5) (2016) 3527-3536.
[28] M. Sankaran, B. Viswanathan, S.S. Murthy, Boron substituted carbon nanotubes - How appropriate are they for hydrogen storage?, International Journal of Hydrogen Energy 33(1) (2008) 393-403.
[29] T. Umegaki, J.M. Yan, X.B. Zhang, H. Shioyama, N. Kuriyama, Q. Xu, Boron- and nitrogen-based chemical hydrogen storage materials, International Journal of Hydrogen Energy 34(5) (2009) 2303-2311.
[30] A. Ariharan, B. Viswanathan, V. Nandhakumar, Nitrogen-incorporated carbon nanotube derived from polystyrene and polypyrrole as hydrogen storage material, International Journal of Hydrogen Energy 43(10) (2018) 5077-5088.
[31] Z.Q. Wang, L.X. Sun, F. Xu, H.Y. Zhou, X.J. Peng, D.L. Sun, J.C. Wang, Y. Du, Nitrogen-doped porous carbons with high performance for hydrogen storage, International Journal of Hydrogen Energy 41(20) (2016) 8489-8497.
[32] Y. Xia, G.S. Walker, D.M. Grant, R. Mokaya, Hydrogen Storage in High Surface Area Carbons: Experimental Demonstration of the Effects of Nitrogen Doping, Journal of the American Chemical Society 131(45) (2009) 16493-16499.
[33] X.B. Zhao, B. Xiao, A.J. Fletcher, K.M. Thomas, Hydrogen adsorption on functionalized nanoporous activated carbons, Journal of Physical Chemistry B 109(18) (2005) 8880-8888.
[34] W. Zhao, V. Fierro, N. Fernandez-Huerta, M.T. Izquierdo, A. Celzard, Hydrogen uptake of high surface area-activated carbons doped with nitrogen, International Journal of Hydrogen Energy 38(25) (2013) 10453-10460.
[35] A.M. de Yuso, M. De Fina, C. Nita, P. Fioux, J. Parmentier, C.M. Ghimbeu, Synthesis of sulfur-doped porous carbons by soft and hard templating processes for CO2 and H-2 adsorption, Microporous and Mesoporous Materials 243 (2017) 135-146.
[36] E. Rangel, E. Sansores, Theoretical study of hydrogen adsorption on nitrogen doped graphene decorated with palladium clusters, International Journal of Hydrogen Energy 39(12) (2014) 6558-6566.
31 [37] I.K. Petrushenko, K.B. Petrushenko, Hydrogen physisorption on nitrogen-doped graphene and graphene-like boron nitride-carbon heterostructures: a DFT study, Surfaces and Interfaces 17 (2019). [38] W. Zhao, L. Luo, T. Chen, Z. Li, Z. Zhang, H. Wang, J. Rao, L. Feo, M. Fan, Synthesis and characterization of Pt-N-doped activated biocarbon composites for hydrogen storage, Composites Part B-Engineering 161 (2019) 464-472.
[39] M.B. Lalonde, R.B. Getman, J.Y. Lee, J.M. Roberts, A.A. Sarjeant, K.A. Scheidt, P.A. Georgiev, J.P. Embs, J. Eckert, O.K. Farha, R.Q. Snurr, J.T. Hupp, A zwitterionic metal-organic framework with free carboxylic acid sites that exhibits enhanced hydrogen adsorption energies, Crystengcomm 15(45) (2013) 9408-9414.
[40] K.Y. Kang, B.I. Lee, J.S. Lee, Hydrogen adsorption on nitrogen-doped carbon xerogels, Carbon 47(4) (2009) 1171-1180.
[41] L. Wang, F.H. Yang, R.T. Yang, Hydrogen Storage Properties of B- and N-Doped Microporous Carbon, Aiche Journal 55(7) (2009) 1823-1833.
[42] G. Yushin, R. Dash, J. Jagiello, J.E. Fischer, Y. Gogotsi, Carbide-derived carbons: Effect of pore size on hydrogen uptake and heat of adsorption, Advanced Functional Materials 16(17) (2006) 2288-2293.
[43] M. Georgakis, G. Stavropoulos, G.P. Sakellaropoulos, Molecular dynamics study of hydrogen adsorption in carbonaceous microporous materials and the effect of oxygen functional groups, International Journal of Hydrogen Energy 32(12) (2007) 1999-2004.
[44] A. Gotzias, E. Tylianakis, G. Froudakis, T. Steriotis, Effect of surface functionalities on gas adsorption in microporous carbons: a grand canonical Monte Carlo study, Adsorption-Journal of the International Adsorption Society 19(2-4) (2013) 745-756.
[45] A. Gotzias, E. Tylianakis, G. Froudakis, T. Steriotis, Theoretical study of hydrogen adsorption in oxygen functionalized carbon slit pores, Microporous and Mesoporous Materials 154 (2012) 38-44. [46] C. Moreno-Castilla, M.V. Lopez-Ramon, F. Carrasco-Marin, Changes in surface chemistry of activated carbons by wet oxidation, Carbon 38(14) (2000) 1995-2001.
[47] C.C. Huang, H.M. Chen, C.H. Chen, J.C. Huang, Effect of surface oxides on hydrogen storage of activated carbon, Separation and Purification Technology 70(3) (2010) 291-295.
[48] C.C. Huang, H.M. Chen, C.H. Chen, Hydrogen adsorption on modified activated carbon, International Journal of Hydrogen Energy 35(7) (2010) 2777-2780.
[49] S.Y. Lee, S.J. Park, Effect of chemical treatments on hydrogen storage behaviors of multi-walled carbon nanotubes, Materials Chemistry and Physics 124(2-3) (2010) 1011-1014.
[50] R.K. Agarwal, J.S. Noh, J.A. Schwarz, P. Davini, EFFECT OF SURFACE-ACIDITY OF ACTIVATED CARBON ON HYDROGEN STORAGE, Carbon 25(2) (1987) 219-226.
[51] M.C. Tellez-Juarez, V. Fierro, W. Zhao, N. Fernandez-Huerta, M.T. Izquierdo, E. Reguera, A. Celzard, Hydrogen storage in activated carbons produced from coals of different ranks: Effect of oxygen content, International Journal of Hydrogen Energy 39(10) (2014) 4996-5002.
[52] M.K. Misra, K.W. Ragland, A.J. Baker, WOOD ASH COMPOSITION AS A FUNCTION OF FURNACE TEMPERATURE, Biomass & Bioenergy 4(2) (1993) 103-116.
[53] J.H. Scofield, HARTREE-SLATER SUBSHELL PHOTOIONIZATION CROSS-SECTIONS AT 1254 AND 1487EV, Journal of Electron Spectroscopy and Related Phenomena 8(2) (1976) 129-137.
[54] R.J.J. Jansen, H. Vanbekkum, XPS OF NITROGEN-CONTAINING FUNCTIONAL-GROUPS ON ACTIVATED CARBON, Carbon 33(8) (1995) 1021-1027.
[55] J. Jagiello, J.P. Olivier, 2D-NLDFT adsorption models for carbon slit-shaped pores with surface energetical heterogeneity and geometrical corrugation, Carbon 55 (2013) 70-80.
[56] T.A. Centeno, F. Stoeckli, The assessment of surface areas in porous carbons by two model-independent techniques, the DR equation and DFT, Carbon 48(9) (2010) 2478-2486.
[57] T.J. Bandosz, J. Jagiello, J.A. Schwarz, A. Krzyzanowski, Effect of surface chemistry on sorption of water and methanol on activated carbons, Langmuir 12(26) (1996) 6480-6486.
32 [58] C.L. McCallum, T.J. Bandosz, S.C. McGrother, E.A. Muller, K.E. Gubbins, A molecular model for adsorption of water on activated carbon: Comparison of simulation and experiment, Langmuir 15(2) (1999) 533-544.
[59] Salame, II, T.J. Bandosz, Study of water adsorption on activated carbons with different degrees of surface oxidation, Journal of Colloid and Interface Science 210(2) (1999) 367-374.
[60] D.D. Do, H.D. Do, A model for water adsorption in activated carbon, Carbon 38(5) (2000) 767-773.
[61] P. Lodewyckx, E. Raymundo-Pinero, M. Vaclavikova, I. Berezovska, M. Thommes, F. Beguin, G. Dobos, Suggested improvements in the parameters used for describing the low relative pressure region of the water vapour isotherms of activated carbons, Carbon 60 (2013) 556-558.
[62] P.V. Lakshminarayanan, H. Toghiani, C.U. Pittman, Nitric acid oxidation of vapor grown carbon nanofibers, Carbon 42(12-13) (2004) 2433-2442.
[63] U. Zielke, K.J. Huttinger, W.P. Hoffman, Surface-oxidized carbon fibers .1. Surface structure and chemistry, Carbon 34(8) (1996) 983-998.
[64] J.H. Zhou, Z.J. Sui, J. Zhu, P. Li, C. De, Y.C. Dai, W.K. Yuan, Characterization of surface oxygen complexes on carbon nanofibers by TPD, XPS and FT-IR, Carbon 45(4) (2007) 785-796.
[65] A.P. Terzyk, The influence of activated carbon surface chemical composition on the adsorption of acetaminophen (paracetamol) in vitro Part II. TG, FTIR, and XPS analysis of carbons and the temperature dependence of adsorption kinetics at the neutral pH, Colloids and Surfaces a-Physicochemical and Engineering Aspects 177(1) (2001) 23-45.
[66] S.J. Park, W.Y. Jung, Effect of KOH activation on the formation of oxygen structure in activated carbons synthesized from polymeric precursor, Journal of Colloid and Interface Science 250(1) (2002) 93-98.
[67] H. Tounsadi, A. Khalidi, M. Farnane, M. Abdennouri, N. Barka, Experimental design for the optimization of preparation conditions of highly efficient activated carbon from Glebionis coronaria L. and heavy metals removal ability, Process Safety and Environmental Protection 102 (2016) 710-723.
[68] A. Ramirez, S. Ould-Chikh, L. Gevers, A.D. Chowdhury, E. Abou-Hamad, A. Aguilar-Tapia, J.L. Hazemann, N. Wehbe, A.J. Al Abdulghani, S.M. Kozlov, L. Cavallo, J. Gascon, Tandem Conversion of CO2 to Valuable Hydrocarbons in Highly Concentrated Potassium Iron Catalysts, Chemcatchem 11(12) (2019) 2879-2886.
[69] H.P. Boehm, Surface oxides on carbon and their analysis: a critical assessment, Carbon 40(2) (2002) 145-149.
[70] J.L. Figueiredo, M.F.R. Pereira, M.M.A. Freitas, J.J.M. Orfao, Modification of the surface chemistry of activated carbons, Carbon 37(9) (1999) 1379-1389.
[71] S.S. Barton, M.J.B. Evans, E. Halliop, J.A.F. MacDonald, Acidic and basic sites on the surface of porous carbon, Carbon 35(9) (1997) 1361-1366.
[72] K. Laszlo, A. Szucs, Surface characterization of polyethyleneterephthalate (PET) based activated carbon and the effect of pH on its adsorption capacity from aqueous phenol and 2,3,4-trichlorophenol solutions, Carbon 39(13) (2001) 1945-1953.
[73] H.P. Boehm, Some aspects of the surface-chemistry of carbon-blacks and other carbons, Carbon 32(5) (1994) 759-769.
[74] D. Eliche-Quesada, M.A. Felipe-Sese, A. Infantes-Molina, Olive Stone Ash as Secondary Raw Material for Fired Clay Bricks, Advances in Materials Science and Engineering (2016).
[75] T. Miranda, A. Esteban, S. Rojas, I. Montero, A. Ruiz, Combustion analysis of different olive residues, International Journal of Molecular Sciences 9(4) (2008) 512-525.
[76] T. Enoki, S. Miyajima, M. Sano, H. Inokuchi, Hydrogen alkali-metal graphite ternary intercalation compound, Journal of Materials Research 5(2) (1990) 435-466.
[77] T. Wigmans, J. Vandoorn, J.A. Moulijn, Temperature programmed desorption study of NA2CO3-containing activated carbon, Fuel 62(2) (1983) 190-195.
33 [78] J.L. Figueiredo, M.F.R. Pereira, The role of surface chemistry in catalysis with carbons, Catalysis Today 150(1-2) (2010) 2-7.
[79] S. Roman, J.F. Gonzalez, C.M. Gonzalez-Garcia, F. Zamora, Control of pore development during CO(2) and steam activation of olive stones, Fuel Processing Technology 89(8) (2008) 715-720.
[80] R. Ubago-Perez, F. Carrasco-Marin, D. Fairen-Jimenez, C. Moreno-Castilla, Granular and monolithic activated carbons from KOH-activation of olive stones, Microporous and Mesoporous Materials 92(1-3) (2006) 64-70.
[81] D. Montane, V. Torne-Fernandez, V. Fierro, Activated carbons from lignin: kinetic modeling of the pyrolysis of Kraft lignin activated with phosphoric acid, Chemical Engineering Journal 106(1) (2005) 1-12.
[82] V. Fierro, V. Torne-Fernandez, A. Celzard, D. Montane, Influence of the demineralisation on the chemical activation of Kraft lignin with orthophosphoric acid, Journal of Hazardous Materials 149(1) (2007) 126-133.
[83] V. Fierro, V. Torne-Fernandez, A. Celzard, Kraft lignin as a precursor for microporous activated carbons prepared by impregnation with ortho-phosphoric acid: Synthesis and textural characterisation, Microporous and Mesoporous Materials 92(1-3) (2006) 243-250.
[84] A.M. Borrero-Lopez, V. Fierro, A. Jeder, A. Ouederni, E. Masson, A. Celzard, High added-value products from the hydrothermal carbonisation of olive stones, Environmental Science and Pollution Research 24(11) (2017) 9859-9869.
[85] A. Jeder, A. Sanchez-Sanchez, P. Gadonneix, E. Masson, A. Ouederni, A. Celzard, V. Fierro, The severity factor as a useful tool for producing hydrochars and derived carbon materials, Environmental Science and Pollution Research 25(2) (2018) 1497-1507.
[86] J.L. Rowlandson, K.J. Edler, M. Tian, V.P. Ting, Toward Process-Resilient Lignin-Derived Activated Carbons for Hydrogen Storage Applications, Acs Sustainable Chemistry & Engineering 8(5) (2020) 2186-2195.
[87] E.P. Ng, S. Mintova, Nanoporous materials with enhanced hydrophilicity and high water sorption capacity, Microporous and Mesoporous Materials 114(1-3) (2008) 1-26.
[88] A.J. Fletcher, Y. Uygur, K.M. Thomas, Role of surface functional groups in the adsorption kinetics of water vapor on microporous activated carbons, Journal of Physical Chemistry C 111(23) (2007) 8349-8359.
[89] S. Hamad, J.A. Mejias, S. Lago, S. Picaud, P.N.M. Hoang, Theoretical study of the adsorption of water on a model soot surface: I. Quantum chemical calculations, Journal of Physical Chemistry B 108(17) (2004) 5405-5409.
[90] I. Cabria, M.J. Lopez, J.A. Alonso, The optimum average nanopore size for hydrogen storage in carbon nanoporous materials, Carbon 45(13) (2007) 2649-2658.
[91] W. Zhao, V. Fierro, C. Zlotea, E. Aylon, M.T. Izquierdo, M. Latroche, A. Celzard, Optimization of activated carbons for hydrogen storage, International Journal of Hydrogen Energy 36(18) (2011) 11746-11751.
[92] M. Rzepka, P. Lamp, M.A. de la Casa-Lillo, Physisorption of hydrogen on microporous carbon and carbon nanotubes, Journal of Physical Chemistry B 102(52) (1998) 10894-10898.
[93] Y. Gogotsi, C. Portet, S. Osswald, J.M. Simmons, T. Yidirim, G. Laudisio, J.E. Fischer, Importance of pore size in high-pressure hydrogen storage by porous carbons, International Journal of Hydrogen Energy 34(15) (2009) 6314-6319.
[94] M. Sevilla, R. Mokaya, Energy storage applications of activated carbons: supercapacitors and hydrogen storage, Energy & Environmental Science 7(4) (2014) 1250-1280.
[95] W.A. Steele, Physical interaction of gases with crystalline solids. 1-Gas-solid interactions and properties of isolated adsorbed atoms, Surface Science 36(1) (1973) 317-352.
[96] W.A. Steele, Physical interaction of gases with crystalline solids. 2-Dimensional second and third virial coefficients, Surface Science 39(1) (1973) 149-175.
[97] S.Y. Lee, S.J. Park, Influence of oxygen-functional groups on carbon replicas for hydrogen adsorption, Physica Status Solidi a-Applications and Materials Science 209(4) (2012) 694-697.