Proposal of a Methodology to Integrate the Human
Factor in the Service Blueprint
Silvio Barbieri
HEG – Geneva School of Business, Campus de Battelle, Bâtiment F, 7 route de Drize 1227 Carouge - Suisse Email: [email protected]
Emmanuel Fragniere
HEG – Geneva School of Business and the University of Bath, Campus de Battelle, Bâtiment F, 7 route de Drize 1227 Carouge – Suisse
Email: [email protected] Marshall S. Sitten
Flashing12, 630 Union Street, Brooklyn, NY 11215 Email: [email protected]
Gabriel Zambrano
Service Lab, the design of service consulting firm, Rue des Noirettes 15 B, 1227 Carouge – Suisse Email: [email protected]
Abstract—In the field of service design, modeling is often used to visually represent the structures, flow, and operations of a service. This modeling, usually referred to as a “workflow” or “service blueprint”, is usually conceptualized in a linear or matrix form. These models, while useful for visualizing the structures and processes involved in service production, fail to consider the contribution of human factors – motivation, emotion, satisfaction, etc. – that are also essential elements of service interactions. It is therefore necessary to focus on the satisfaction and behavior of customers and employees. The ultimate goal is to try to eliminate the obstacles and conflicts of human order to generate an improvement of the whole service. We propose the development of an “enhanced” service blueprint which includes human factors dimensions, and attempt to compare its use to that of a traditional blueprint.
Index Terms—customer journey map, human factors, service blueprint, service design
I. INTRODUCTION
Over the past few decades, the field of services has become the primary source of economic dynamism at a global level. It covers a wide field of activity in the economy of many countries and contributes to the largest share of many countries’ gross domestic product. In response to this new focus on service, we have seen the emergence of the fields of ―service science‖ and ―service design‖; these fields, which take a multidisciplinary approach to the creation and improvement of services,
Manuscript received January1, 2013; revised March 18, 2013.
have been introduced progressively into academic research and professional practice.
Service science combines technology and social science with an understanding of business processes and organizations in order to increase the perceived value of the service to both the producer and the consumer. Service design focuses on design activity using different tools such as modeling a service experience. With the growing importance of the service domain, further concepts of ―customer experience‖ [1] – the study of all the emotions and behaviors a customer has when interacting with a service -- and ―service innovation‖ [2] also begin to appear.
As the service sector continues to grow, new challenges begin to appear. The impulse of larger service organizations is which concentrate their efforts mostly on the optimization of the means and the processes of production (service industrialization), as well as the invention of new products and the investment in the research for markets is no longer sufficient. Services cannot be described in a fashion similar to products, as the characteristics of their production and consumption are significantly different. While many services include the use of a tangible service ―avatar‖ (possibly in the form of a product, as in the case of the Apple iphone), most services are intangible, not produced in a linear way, and require the direct involvement with the client in order to produce value at a time of simultaneous production and consumption. As a result, operational optimization must make way for customer satisfaction, human emotion and behavior, and more complex interpersonal factors in the design and improvement of services.
With an economy increasingly based on expertise and tacit knowledge, the human factor should be thus taken
into account as a key resource. The creativity also plays a certain role and the companies which wish to survive and to prosper over time have to reflect it constantly. The organization must create a real connection between the human capital and the economic prosperity. However, the human is an intangible and complex good that it is difficult to manage, and it is sometimes difficult to assess its contribution.
In service science, but more specifically in the area of service design, modeling allows practitioners to visually represent how an operation of service functions. It is presented under various names, such as workflow, value chain, process design or the blueprint. Industrial processes are already using the logistical scheme, which has been a useful tool for drawing up and analyzing the production and logistics process of a commercial good.
Within the growing service sector, it has also been useful to apply the blueprint as a simple and effective visual tool to visually represent the operation of a service. The blueprint allows us identify tasks, processes, roles, structures, and events involved in service production. It can be conceptualized in either a linear or a matrix form, and various IT tools are regularly developed and used in practice (e.g.: Mega applications or Visio). These tools are so widely used that entire departments are set up within companies in order to design, monitor and analyze processes using this method.
However, as service environments become increasingly complex, these models become increasingly distanced from the human factors involved in service production. At a certain level of abstraction, organizations have difficulty visualizing the role of the service as a whole, the role of individual people involved in production, and the effect of individual emotions and behaviors on service production. This loss of point of reference on the value chain can create an ambiguous situation. The psychological impact on the individual can be significant and may affect their work performance [3]. Furthermore, an organizational change can contain various obstacles and can cause disruptions of human and emotional order. The fear of the unknown, the feeling of insecurity, the lack of clarity and visibility of the ultimate goal, and the incomprehension of individual roles can impede a project. Even if the change can be beneficial for the company, it is necessary to take into account the human factor while piloting the change. The ultimate goal is to take into account more of the employees’ desires, morals and personal aspirations and add this to the process.
II. LITERATURE REVIEW
The blueprint comes from a printing process (the cyanotype) and is used in various fields for the spatial representation of objects in a three-dimensional shape, drawn as a reference to respect a certain scale. A blueprint can also be a detailed description of a business process, representing schematically the operation of a concept, a business or a service. In addition, this design can also describe the different stages of the life cycle of a process, and afford to have a simplified overview, clear and legible at a first glance.
The notion of "blueprinting" was developed in several phases, where within the first stage a blueprint was used to control the technical process of a service. It was used to analyze the defects (―service failures‖) and thus perform a re-design process. Various methods and tools were used as well as the "process flow diagram" or ―process chart‖. The objective was to identify the tasks to be optimized by taking into account the actors and equipment available. Following this, it was necessary to evaluate the tasks and the flow to determine whether it would be necessary to simplify or to improve the process. From this, the process flow diagram was used to visualize the sequences (step by step) with the cost of equipment, actors, and the flow of information.
Process charts illustrated the relationships and determined the position of the customer and the supplier [4]. With the increase on the importance of the services sector, the notion of ―service blueprinting‖ appeared. We began to distinguish the activities of ―back office‖ and ―front office‖ (with the ―line of visibility‖), while criticizing the service and orienting itself more towards the customer. A method with several stages was proposed, namely 1) the identification of the process and the presentation in the form of a diagram, 2) the identification of ―points of defects‖, 3) the establishment of the temporal value, and 4) the analysis of the profitability of the delivered service [5], [6], [7].
The technique of ―perceptual blueprinting‖ is also born, and the idea is to provide a standardized method that can promote quality and efficiency. The goal is to identify the organization of the delivered service and the elements of defects [8], [9]. The quality of service’s main objective is to satisfy the final customer, and the challenge is to capture the customer’s experience. For this, an additional method can be used where the goal is to go through nine stages, namely: 1) the customer experience research, 2) the use of the information collected to build an approach of flowchart streams (step by step), 3) the analysis of each step as well as the identification of critical points and defects, 4) the insurance that positive measures are made during the service offer, 5) the analysis of the points of failure in relation to the vision, the mission and the capacities of the company, 6) the development of a planning scenario allowing to minimize the negative effects, 7) the creation of corrective actions for failed points considered unjustified, 8) the finalization of a blueprint presenting the service in general, and 9) the implementation of a plan of effective implementation [10]. In all this, there is also the ―service mapping‖ which consists of schematically representing the service with the actions on the horizontal axis and the relational structure on the vertical axis. Thus, we see various actors (customer, supplier) appearing, the support functions and the management of these functions [11]. There is also the ―service blueprinting‖ where we integrate the concept of the normal and internal interaction lines, the line of visibility, and finally the line of implementation. The normal interaction line separates the actions of the supplier and the customer, while the internal interaction line splits the back office and the support (resources, technology, and
information). The line of visibility shows the visible actions (front office) and the invisible actions for the customer (back office). Finally, the implementation line separates the area of management (planning, managing and controlling) and the support area [6], [12].
In addition, matrix diagrams represent a new kind of blueprint, one with two axes: Service life stages are represented on the horizontal axis, and the actors are displayed on the vertical axis. The horizontal axis is divided into three parts: namely the ―pre-transaction‖ which is the phase that precedes contact with the client, then the ―transaction‖ phase which includes the service itself (basic service and additional services), and finally the phase of ―post-transaction‖ for after-service. On the vertical axis, are the various stakeholders of the service experience, such as the ―customer‖, the ―front office‖, the ―back office‖ and finally the ―support‖.
The customer is the beneficiary of the service, while the front office is the service provider who is in direct contact with the customer. The back office concerns the staff that is behind the service, which administers the service behind the scenes while being in contact with the front office. In the center of the matrix are the events of the real-life experience of the service which describe the actions associated according to the stage and with the stakeholder in question. Actions and events are represented by geometric forms (of any kind), and are connected by arrows. The ―line of visibility‖ which represents the border between what the customer really perceives of the service, and what is ―hidden‖ [13]is also mentioned.
―Service blueprinting‖ was originally planned to visualize and analyze the effectiveness of the process of service, so it began to be used to identify interactions between the customer and the employees. Following this, the concept of ―internal marketing‖ was added; which focuses on the informatics flow generated at all levels of the organization. The goal is to take the employees’ desires, aspirations and morals more into account before realizing the service offer. For this to happen, various concepts have been identified, such as the internal, social, economic, developmental and finally the application values. The ―internal value‖ concerns the moment when we verify if the working environment is sufficiently encouraging and rewarding, while the ―social value‖ allows us to see the state of relations between different people in a team (e.g.: team spirit). The ―economic value‖ provides the opportunity to identify the scale of pay, job security or opportunities for promotions. The ―development value‖ is the point where we try to estimate the level of recognition and the career possibilities within the organization, and finally the ―application value‖ which aims to visualize the opportunities that the employees have to apply or exchange their knowledge [14]. Blueprint is also described as a veritable tool for innovation where we focus more on the human value and its relationship with technology.
The goal is to create a connection between human potential and performance, or economic prosperity [15], [16]. This tool is constantly developing and some researchers are trying to develop blueprint by inserting
other types of information. For example, a study concerning the efficiency of management processes using blueprinting, proposed to add a line of "penetration of order" within the blueprint. This new track should permit the separation between an ―induced customer‖ and an ―independent customer‖. The induced customer concerned a particular type of client, while the independent customer focused on activities with all types of clients. So, the purpose of this separation was to see whether there was another potential for valuable creation [17].
Other concepts were also studied, such as the notion of image, schemes and matrix. They allow us to understand the power that a single image can convey, and also indicate the fact that they can open up debates with ideas. These concepts are important because it is increasingly important to have a simple and effective overview. In addition, the creation or improvement of a business model oriented service must also take into account the human notion, which is essential in the process of reflection. The goal is that each actor can be located and understand the process compared to other actors (customer, management, colleagues, and partners) [18]. In general, it appears that research has shaped the design of the blueprint itself, as well as its usefulness.
A method was developed (EDCI) with the aim of improving the process of innovation of services on the Internet (e-services). The idea was to propose an approach centered on the human being while using the service blueprinting to define the roles and identify the interactions. The method is divided into five stages, which is 1) the exploration, 2) the discovery, 3) the concept and the design and 4) the implementation and the evaluation. In addition, it is mentioned that a service is intangible and that it is then necessary to experiment it. It will be better understood by all [19]. The blueprint can also be used to conceptualize a future project and it can also serve as a framework and / or as a general guide in his implementation. It can help to generate new ideas and serve as a common language in order to accompany at best the change [20]. Another work concerning the quality management and the medical domain demonstrated that the human being is the key point of the organization. It is necessary to focus on the satisfaction and the behavior of the customers as well as the employees. Furthermore, it is also necessary to try to eliminate the obstacles and the conflicts of human order to generate an improvement of the whole service [21]. Motivation is the key to behavior change and adherence to new practices. Finally, the fact of establishing clear objectives and of adding game elements can also have an impact on the behavior [22]. Finally, when a company wishes to develop a new service and when it tries to transform its offer, it has to change or adapt her business model. The use of the ―Business Model Canvas‖ tool can then allow the professionals to understand the behavior of the complex service systems [23].
III. METHODOLOGY
The purpose of this work is to propose a new methodology for problem solving using a form of service
blueprinting which accounts for the human factor. For this purpose, we have adopted a general syntax similar to that of a medical examination, where the human blueprint will serve as a diagnostic tool. Using our modified blueprint, we will assess the ―health status‖ of different actors at different points in the process, as well as that of the company itself. The blueprint will be used to ―diagnose‖ possible diseases, to measure the progress or the cure of one or several diseases, or to confirm the absence of any diseases.
The method occurs in three stages: 1) ―Anamnesis‖, in which the doctor receives the patient’s medical history and current symptoms through a careful interview process, 2) ―Diagnosis‖, in which the doctor uses evidence to identify a disease or condition, and 3) ―Prescription‖ by which the doctor guides the patient to specific path to treatment [24]. We conducted several experiments with students from the Haute Ecole de Gestion de Genève (HEG) in Geneva, Switzerland, as well as with professionals from the studied branch. Two methods were used, ethno methodology and social experimentation. Ethno methodology was used to study empirically the formation of social codes among human groups, while social experimentation was conducted to test various hypotheses.
Indeed, twelve experiments were conducted with bachelor’s students, master’s students and other training courses in HEG. The objective was to analyze the different service experiences in areas as varied as banking, watch making, traveling agency, or headhunting. The goal was to solve a particular problem, or to create or improve a service. Several phases were necessary to carry out these experiments, such as the preparation of case studies, the experience itself, analysis reports and the presentation of the final results.
The project lasted nearly two years and the average duration of each case study was about 2 months. The experiences mobilized nearly 277 students and more than 100 reports (10-20 pages each) were written. The majority of work was done in the HEG classrooms, and one project was undertaken outside directly for the University of Fribourg. Students were supervised by a professor, various different instructors, a professional Swiss stage director, and an assistant.
The experiments were carried out in several stages: 1) The presentation of the work and group formation, 2) the literature search on the problems of the sector or business, 3) the creation of questionnaires and the interview phases with professionals in the domain, 4) the creation of the first blueprint representing the functioning and / or the concept of a particular service, 5) the identification on blueprint of diverse critical points, weak points, problems or risks, 6) the creation of a synopsis and a script, 7) the reenactment of a first stage of service experience in a theatrical zed form, that allows the revelation of the points, problems and / or risks, 8) the work and the production of a second improved blueprint with solutions and recommendations, 9) the presentation of a second stage of service experience in a theatrical zed form with the proposed solutions, 10) the work on reports of the practical
case in general, and 11) the oral presentation of the final conclusion, the recommendations, and the action plan.
In parallel with these experiments, research was undertaken on how to model each service’s experiences. Several types of blueprints were developed and proposed to the students, presenting the theoretical concept while simultaneously presenting an intuitive and visual tool.
A first blueprint macro was proposed as a tool for defining the risk profile of a particular customer. The students inserted different types of information in three steps of reflections. The first one consisted in inserting questions to understand the customer (1. Identification). The second suggested inserting the customer in a defined category of risks profiles (2. Diagnostic). The last step was the identification of the possible consequences and / or impacts related to the risk profile chosen (3. Caution).
In the context of a problem-solving experience in the industrial field, a second macro blueprint was proposed. Students were asked to pursue a problem resolution by asking questions designed to 1)identify the problem, 2) elaborate solutions, and then to establish an action plan through 3)choice and implementation of the solution.
Next, we presented a more detailed blueprint using the matrix format in order to propose a formalized modeling tool of a service experience. The purpose was both to visualize the process of a service, by showing the different actors, structures, and chronological stages, and to think about the way of improving a service.
The final experiments revealed a need to take into account the human factor in the analysis of the process. Upon completion of the last round of experiments and as shown in Fig. 1, it was suggested to the students to work in different dimensions of reflections. They were asked to think about the human, economic, and environmental aspects of the business process of a service offer.
Figure 1. The GSPEE method
To materialize this goal, we once again used a process that employed the analogy of a medical examination. The first step, the ―The anamnesis‖ involved listening to the actors in that phase of the service process, paying attention to the symptoms which are felt, the seniority of the problem and its evolution, the treatments which are being followed up already, and the expectations of the other
actors. The second stage, the ―diagnosis,‖ focused on analysis of the blueprint and the search for evidence that will support the diagnosis. Finally, the last stage is the ―prescription‖ when advice is finalized, direction is given, and other analysis can be looked at in more depth.
Based on the results of this process, the method was re-approached using the following steps: 1) the realization of a first basic blueprint, 2) the identification of the ―salient attributes‖ of the service, those characteristics which define the notion of value to the client, 3) the social, protective, economic and environmental analysis, 4) the problem analysis (―Warnings‖) and the work on proposals for improvement and / or solutions (―Optimize‖), 5) the creation of a second improved blueprint, 6) the achievement of an action plan for the proposed solutions, and 7) the preparation of a final report.
In order to produce this new, second blueprint, it will be necessary to make a first ―generic blueprint‖ which adheres to the basic structural and procedural dimensions. The idea will be to identify for each action and event a time, location, and communication channel for realization, as well as the necessary resources.
Once this blueprint and its supporting steps are completed, we can add the social dimensions in which the human factor will be studied in more depth. As we can see in Fig. 2, this ―social blueprint‖ records and displays the levels of happiness and motivation of the actor at the time of achieving, the level of satisfaction of the actor after the realization, the level of stress felt, and the level of social interaction occurring.
An accumulation will be realized, where for every actor, we shall calculate the level of happiness and motivation, the level of satisfaction, as well as the level of stress and social interaction in its entirety.
Figure 2. The Social blueprint
Finally, in addition to the twelve experiments, a final laboratory was conducted with twenty students enrolled in the HEG master in Service Science program. The objective was to redesign a service in the field of relocation and to propose innovative ideas through an animated simulation. The work lasted about four months and the recommendations were tested by means of a specific tool (e.g.: On Map). In addition, the final defense was made with one or more animated blueprints in 2 and 3 dimensions. This experience revealed the importance of incorporating the stage of integration and acceptance problem resolution into the method. The final goal is to
communicate organizational change as simple as possible, to understand and to ensure adherence of the various take holders, and to succeed in changing behavior.
IV. CONCLUSION
Service design and service science are rapidly growing fields, and various tools have therefore emerged from other disciplines to support the practice of problem resolution in complex service environments. The modeling of the experience of service using visual diagrams is used in both academia and practice.
Generally speaking, service environments consist of interactions between people, a service process, and a defining environment changing over time. This experience generates specific feelings and motivations for those involved which also have the potential to greatly affect the process of service production and satisfaction. Thus, this fragile and interconnected system has to appeal to the tools which allow the opening up of creativity and solutions to answering complexity issues [25].
To this end, ―service blueprinting‖ is a tool which allows us to visualize the process of a service, identify the interactions and the actors in presence, and helps us to understand the key functions of the service.
In addition to its usefulness in diagnosing problems within service production and suggesting improvements, this method can be used as a tool for innovation; as it is designed to map the sentiment and motivations of all members of service environment – including the final customer -- and be useful on either the operational or strategic level.
The results of our initial ground research suggested that when we insert another level of reflection directly onto the blueprint, the resolution of the problem is strengthened. Indeed, as it was tested together with the works concerning the domain of risk management, the fact we visually inserted additional fields on a basic process allowed improvement of the analysis itself.
In addition, it was discovered that the human notion was not well integrated into the existing tools for modeling and analysis, and that actor’s profile, feelings or motivations were not taken sufficiently into account.
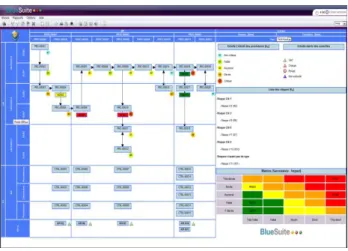
Figure 3. A human factor blueprint for risk management
We propose to continue to develop an improved visual tool where management would become a greater part of the process of value creation. Our primary objective going
forward is to work at several levels to sharpen the use of service blueprinting while remaining focused on the human aspects that are essential to understanding service production. The proposed method allows observation of the ―health‖ status of different actors and of the business simultaneously.
Finally, as shown in Fig. 3, the blueprint concept presented in this paper has been recently integrated in the Blue Suite Risk Management Solution developed by Oxial.
REFERENCES
[1] C. Meyer and A. Schwager, ―Understanding customer experience,‖
Harvard Business Review, vol. 85, no. 2, pp. 117-126, February
2007.
[2] J. Hauser, G. J. Tellis, and A. Griffin, ―Research on innovation: A review and agenda for marketing science,‖ Marketing Science, vol. 25, no. 6, pp. 687-717, November / December 2006.
[3] R. K. Teas, ―Supervisory behavior, role stress, and the job satisfaction of industrial salespeople,‖ Journal of marketing
research, vol. 20, no. 1, pp. 84-91, February 1983.
[4] A. Shahin, ―Service blueprinting: An effective approach for targeting critical service processes – with a case study in a four international hotel,‖ Journal of Management Research, vol. 2, no. 2, pp. 1-16, 2010.
[5] G. L. Shostack, ―How to design a service?‖ European Journal of
Marketing, vol. 16, no. 1, pp. 49–63, 1982.
[6] G. L. Shostack, ―Design services that deliver,‖ Harvard Business
Review, vol. 62, pp. 133 – 139, January 1984.
[7] G. L. Shostack, ―Service positioning through structural change,‖
Journal of Marketing, vol. 51, no. 1, pp. 34-43, January 1987.
[8] J. S. Martinich, Production and Operations Management: An
Applied Modern Approach, New York: John Wiley & Sons, 1997.
[9] M. Senior and G. Akehurst, ―The perceptual service blueprinting paradigm,‖ in proc. QUIS II: A symposium on quality in services, Norwalk Connecticut, July 8-11, 1990.
[10] G. Pires, P. Stanton, and J. Stanton, ―The role of customer experiences in the development of service blueprints,‖ Australia
and New Zealand Marketing Academy Proceedings, Wellington,
N.Z., November 29 – December 1, 2004.
[11] L. Randall, A Method for Assessing and Providing Customer Hotel
Service Satisfaction in NHS Hospitals, Managing Service Quality,
MCB University Press, Bradford, pp. 7 – 12, May 1993.
[12] C. Haksever, B. Render, R. S. Russell, and R.G. Murdick, Service
Management and Operations, Second Edition, Prentice-Hall, Inc.,
Upper Saddle River, New Jersey, 2000.
[13] C. H. Lovelock, J. Wirtz, D. Lapert, and A. Munos, Marketing des
services, 6ème edition, Pearson Education, 2008, ch.8, pp. 259-290. [14] M. T. Spence and S. H. Kale, ―Optimising the internal value chain:
principles and practices,‖ Journal of Management & Organization, vol. 14, no. 2, pp. 193-206, 2008.
[15] D. M. Amidon, ―Blueprint for 21st century innovation management,‖
Journal of Knowledge Management, vol. 2, pp. 23–31, September
1998.
[16] M. J. Bitner, A. L. Ostrom, and F. N. Morgan, ―Service Blueprinting: A practical Technique for Service Innovation,‖
California Management Review, vol. 50, no. 3, pp. 66 – 94, Spring
2008.
[17] S. Fliess and M. Kleinaltenkamp, ―Blueprinting the service company: Managing service processes efficiently,‖ Journal of
Business Research, vol. 57, no. 4, pp. 392–404, April 2004.
[18] Z. Ahamed, A. Kamoshida, and T. Inohara, ―A strategic journey of firm transformation towards a new framework for implementing servitization strategy,‖ Journal of Service Science, pp. 1-24, October 2012.
[19] N. P. Melville and M. Hopps, ―Systematic Service Innovation in Organizations: EDCI – A Template for Human-Centered Design of E-Services,‖ presented at the 45th Hawaii International Conference on System Sciences, Maui, Hawaii USA, January 04-07, 2012. [20] T. Hooley, A. G. Watts, R. G. Sultana, and S. Neary, ―The blueprint
framework for career management skills: A critical exploration,‖
British Journal of Guidance & Counselling, pp. 1-15, September
2012.
[21] H. R. Chen and B. W. Cheng, ―Applying the ISO 9001 process approach and service blueprint to hospital management systems,‖
The TQM Journal, vol. 24, no. 5, pp. 418-432, 2012.
[22] R. J. Lin, H. Chang and K. Zheng, ―Technologies and innovation matrix for behavior-motivation-embedded web 2.0 services,‖ presented at the 8th Seoul International Conference on Computing
Technology and Information Management (ICCM), Korea (Republic of), Seoul, April 24-26, 2012.
[23] C. Ehrenhofer and E. Kreuzer, ―The role of business model design in the service engineering process: A comparative case study in the field of cloud computing to join service engineering with business model design‖, presented at the Service Research and Innovation Institute 2012 SRII Global Conference (SRII 2012), San Jose, California USA, July 24-27, 2012.
[24] J. C. Sournia, Histoire de la Médecine, Editions La Découverte, Poche, 2004.
[25] F. I. Stuart and S. Tax, ―Toward an integrative approach to designing service experiences: Lessons learned from the theatre‖,
Journal of Operations Management, vol. 22, no. 6, pp. 609–627,
December 2004.
[26] T. J. D’Zurilla and M. R. Goldfried, ―Problem solving and behavior modification,‖ Journal of Abnormal Psychology, vol. 78, no. 1, pp. 107–126, 1971.
[27] P. Horn, ―The new discipline of services science,‖ Bloomberg
Businessweek, January 21, 2005.
[28] A. Wilson, V. A. Zeithaml, M. J. Bitner, and D. D. Gremler, ―Services Marketing: integrating customer focus across the firm,‖ 6th ed., New York, NY: McGraw-Hill Education, 2008.
[29] L. G. Coleman, ―Blueprint sets foundation for better service and customer satisfaction,‖ Marketing News (ProQuest), pp. 14, December 18, 1989.
[30] Birkhäuser, ―Service design,‖ Design Dictionary, pp. 354–357, 2008.
Silvio Barbieri is a research assistant at HEG in
service logistics and operation management. He has obtained a Master in Business Administration in Service Management and Engineering. He is currently doing a PhD in Service Design Experiments based on Ethnomethodology and Theatre-Based Reenactment. Before joining the HEG, he worked for nearly nine years in the private banking sector as a managerial accountant and as an operations manager
Emmanuel Fragnière, CIA (Certified Internal
Auditor), is a professor of service scienceat the Haute École de Gestion de Genève, Switzerland. He is also a lecturerin enterprise risk management at the Management School of the University of Bath. His research is focused on the development of risk management modelsfor decision makers in the service sector. He has published several papers in academicjournals such as Environmental Modelling andAssessment, Interfaces, Management Science and Service Science. He is the coauthor (with GeorgeSullivan) of the book Risk Management: Safeguarding Company Assets (Fifty-MinuteCrisp Series, November 2006).
Marshall Sitten is a communications strategy
consultant at Flashing12 Communications, and an Adjunct Professor of Services Innovation at the Polytechnic Institute of New York University. He collaborates on service design research with Professor Fragnière at the Haute École de Gestion in Geneva, Switzerland, and is co-founder of the New York chapter of the Service Design Network.
Gabriel Zambrano is an entrepreneur in the
field of Service Design and innovation. He has a background in Information Technology and a Master in Business Administration (in Management and service engineering). He teaches "Digital innovation" at the Geneva Business School (HEG). He specializes in User Experience (UX) for systems information. He started working as a web and mobile developer.