Spatial-numerical associations in 1st-graders: Evidence from a manual-pointing task
Wenke Möhringa*, Masami Ishiharab, Jacqueline Curigera, & Andrea Fricka University of Fribourg
a University of Fribourg, Department of Psychology, Fribourg, Switzerland; b Tokyo Metropolitan University, Department of Human Sciences, Tokyo, Japan.
NOTICE: This is the author's version of a work that was accepted for publication in Psychological Research. Changes resulting from the publishing process, such as peer review, editing, corrections, structural formatting, and other quality control mechanisms may not be reflected in this document.
Changes may have been made to this work since it was submitted for publication. A definitive version is published as:
Möhring, W., Ishihara, M., Curiger, J., & Frick, A. (2019). Spatial-numerical associations in first-graders: Evidence from a manual-pointing task. Psychological Research, 83, 885-893.
DOI: 10.1007/s00426-017-0904-4
Author Note
This research was supported by a Research Grant from the Swiss National Science Foundation # PP00P1_150486. We are grateful to Lisa Heid and Sarah Dubach for their support with data collection.
Correspondence concerning this article should be addressed to Wenke Möhring, who is now working at the Department of Psychology, University of Basel, Missionsstrasse 62, 4055 Basel, Switzerland. Email: [email protected]
Abstract
The current study investigated whether children’s mental representations of numbers are organized spatially at the onset of formal schooling using a manual-pointing task. First-graders (N = 77) saw four numbers (1, 3, 7, 9) presented randomly in four spatial positions (extreme left, left, right, extreme right) on a touch screen. In a Go/No-Go task, children were asked to press the appearing numbers as fast and accurately as possible, but only when the numbers were “smaller” (or “larger” in a different block) than 5. Results indicated that response times were significantly affected by the spatial position in which the different numbers were presented. Response times for small numbers (1 and 3) increased and response times for large numbers (7 and 9) decreased, the more they were presented towards the right side of the screen. These findings suggested that 1st-graders spontaneously employed a spatial number representation that was oriented from left to right. Furthermore, this left-to-right organization could not be easily changed by priming a different direction. Our findings indicate that even young children map numbers continuously onto space.
Word count: 177
Keywords: numerical representation, spatial representation, spatial-numerical
Spatial-numerical associations in 1st-graders: Evidence from a manual-pointing task
Previous studies have indicated that adults’ mental representations of numbers are associated with space (Calabria & Rossetti, 2005; Fias, 2001; Fischer, 2001; Fischer, Castel, Dodd, & Pratt, 2003; for reviews, see Fischer & Shaki, 2014; Hubbard, Piazza, Pinel, & Dehaene, 2005). These associations may be based on a general system for processing numerical and spatial magnitudes, as proposed in Walsh’s (2003) “A Theory Of Magnitudes”. One typical way of testing this spatial-numerical interdependence has been developed by Dehaene, Bossini, and Giraux (1993). In their seminal study, they employed a paradigm that made use of stimulus-response compatibility effects. They presented numbers in the middle of a computer screen, and asked participants to judge number parity by pressing one of two response buttons. Adults responded faster to smaller numbers with their left hand (left button), and faster to larger numbers with their right hand (right button). These findings indicated that participants automatically processed magnitude information even though the task itself did not require magnitude judgments. Importantly, results suggested that numbers are mentally represented in a spatial arrangement, with small numbers on the left and large numbers on the right side of space. Presumably, responding to smaller numbers with the left hand and to larger numbers with the right hand was more compatible with participants’ internal representation. This effect has been termed the “Spatial-Numerical Association of Response Codes” (SNARC) effect, and was shown repeatedly in adults (Bächthold, Baumüller, & Brugger, 1998; Shaki & Fischer, 2008; for a meta-analysis, see Wood, Willmes, Nuerk, & Fischer, 2008). However, the exact nature of these spatial-numerical associations remained unclear.
One possibility is that numbers are mentally represented in a continuous manner, akin to the concept of a “mental number line”. However, it is also possible that numbers are represented in dichotomous categories with small numbers being located on the left and large
numbers on the right. To shed light on the nature of these associations, Ishihara and
colleagues (2006) used a slightly different paradigm. They presented numbers on 5 different equidistant positions on a touch screen. In a Go/No-Go task, participants were told to point to the numbers on the screen if they were odd, and to keep their index finger on the starting position if the numbers were even. Adults’ response times (RTs) showed decreasing regression lines for the larger numbers (7 and 9), indicating faster responses for larger numbers the further they were presented toward the right. Conversely, they showed
increasing regression lines for the smaller numbers (1 and 3), indicating slower responses for smaller numbers the further they were presented toward the right. These findings suggested that RTs increased as a function of the spatial incompatibility between the position of the presented numbers and a continuous left-to-right representation, speaking against a dichotomous categorization.
Yet, even though such left-to-right spatial-numerical associations have been found repeatedly and consistently in adults, they do not seem to be pre-wired or immutable. There is evidence for cultural influences on the spatial orientation of adults’ numerical representation (for a review, see Göbel, Shaki, & Fischer, 2011). For example, Dehaene and colleagues (1993) showed that adults who were socialized in a country with a right-to-left writing system (such as Iran) showed attenuated or even reversed SNARC effects. These findings were replicated in several studies (e.g., Shaki & Fischer, 2008; Shaki et al., 2009; Zebian, 2005), leading to the notion that the directionality of the SNARC effect may be due to reading habits and exposure to writing systems (common reading account).
Indeed, developmental research initially confirmed this, by showing that the SNARC effect emerged only after 2 years of schooling (Berch, Foley, Hill, & Ryan, 1999). However, later studies found that shortly after or even before entering school, the majority of children have already formed spatial-numerical associations (e.g., Ebersbach, 2015; Patro & Haman,
2012; Mills, Rousseau, & Gonzalez, 2014; Van Galen & Reitsma, 2008). Even when magnitude was not task-relevant and children had to decide whether presented numbers switched to red or green, SNARC effects have been observed in children as young as 5 years old (Hoffmann, Hornung, Martin, & Schiltz, 2013). Moreover, preschoolers have been found to count a row of objects predominantly from left to right, suggesting that a preference for a left-to-right direction is present long before reading instruction, casting doubt on the common
reading account (Briars & Siegler, 1984; Kamawar et al., 2010; Knudsen, Fischer, &
Aschersleben, 2015; Opfer, Thompson, & Furlong, 2010).
Recent research has even indicated that a link between space and number seems to be readily available in the first year of life. For example, when infants saw non-symbolic
numerical sequences, they preferred increasing sequences in a left-to-right orientation as opposed to the reversed direction (de Hevia, Girelli, Addabbo, & Macchi Cassia, 2014). In addition, Bulf, de Hevia, and Macchi Cassia (2016) showed that infants oriented towards a target more quickly on the left side of a screen after being presented with a small number (i.e., two dots in the center of the screen) as opposed to a large number (i.e., nine dots), and vice versa. Evidence for similar left-to-right mappings has been found with newborn chicks and chimpanzees (e.g., Adachi, 2014; Drucker & Brannon, 2014; Rugani, Vallortigara, Priftis, & Regolin, 2015). However, even though there is some evidence that
spatial-numerical associations may develop early and are not restricted to humans, their origins are still under debate (for an overview of mechanisms, see Nuerk et al., 2015).
Another open question pertains to whether children’s spatial-numerical mappings are dichotomous or continuous in nature. The majority of previous developmental research (for a review, see McCrink & Opfer, 2014) has used paradigms that required a binary choice. Typically, two types of instructions have been used: In one of them, children and adults are asked to judge whether a number is odd or even (e.g., Berch et al., 1999; Dehaene et al.,
1993). However, this type of instruction is not suitable for young children, as number parity is a rather abstract distinction that many children struggle with (cf. Van Galen & Reitsma, 2008). In another type of instruction, children and adults are asked to compare a presented number to a standard (e.g., Van Galen & Reitsma, 2008). However, when using this kind of instruction in combination with a binary response paradigm, the SNARC effect is confounded with a numerical distance effect, making it difficult to identify truly continuous versus
categorical mappings (see also Gevers, Verguts, Reynvoet, Caessens, & Fias, 2006). This numerical distance effect describes the phenomenon that numerical size discriminations become harder and RTs longer, the smaller the numerical distance is between the numbers and the standard (e.g., 4 is harder than 2, if numbers have to be compared to a standard of 5). Given these problems, it seems that binary choice paradigms in combination with number-based decisions are less suitable to specify whether children’s number-space mappings are dichotomous or continuous.
Therefore, the main goal of the present study was to investigate whether children’s mental representations of numbers are already organized continuously at the onset of formal schooling, using a similar manual-pointing task as Ishihara and colleagues (2006). This paradigm has the advantage that the same number is presented at different locations on the screen. Thus, children’s proficiency at distinguishing the numbers from the standard is not confounded with effects of spatial association. We tested whether children map digits continuously from left to right at the beginning of 1st grade.
As a secondary question, we investigated how immutable or malleable children’s number-space mappings are. Bächtold, Baumüller, and Brugger (1998) found that adults’ spatial-numerical associations are quite flexible, in that the prevailing left-to-right orientation of numbers in Western European participants could be reversed by prompting them to use a different spatial representation (i.e., imagining numbers as hours on an analog clock face, see
also Galfano, Rusconi, & Umiltà, 2006; Ranzini, Dehaene, Piazza, & Hubbard, 2009; Ristic, Wright, & Kingstone, 2006). In adults, the left-to-right orientation of number-space mappings can even be modified by as little as reading a single word from right to left (Fischer, Shaki, & Cruise, 2009). In a parity judgment task, bilingual Russian-Hebrew readers were asked to judge Arabic digits and number words, presented in either Russian or Hebrew in random order. A left-to-right orientated SNARC effect was found for the digits that followed a Russian number word; however, this effect was suppressed when the digits followed a Hebrew number word that induced right-to-left reading.
In children, research investigating the malleability of spatial-numerical associations is sparse. In one initial study, Patro, Fischer, Nuerk, and Cress (2016) trained 3- and 4-year-old children on a non-numerical spatial movement task, in which a frog had to be moved across a pond on a touch screen for approximately 5-10 min (from either left to right or right to left). Then, children performed a (non-symbolic) numerosity comparison task, in which they saw two pictures and were asked to touch the one that contained the larger (or smaller) number of sweets (displayed as colored rectangles). Results showed that after this short right-to-left training, children exhibited a reversed SNARC effect, implying malleable number-space mappings for non-symbolic numbers.
However, it is still an open question whether spatial representations of symbolic numbers can be changed in young children. Symbolic numbers are a product of culture, and therefore an even stronger and more resistant left-to-right SNARC effect may be expected as compared to results of Patro et al. (2016), if the direction of the SNARC effect is also
culturally transmitted. If, however, reading practice or formal instruction using spatial tools (such as number lines, graphs etc.) were responsible for the direction of the SNARC effect, the association could be expected to still be rather flexible at the onset of formal schooling. In the present study, we thus tested whether the direction of children’s number-space mappings
could be reversed by priming them with number lines that were oriented from right to left, as compared to the usual left-to-right orientation. Given that children needed to be familiar with symbolic numbers up to 10, we focused on testing 1st-graders. To ensure children’s
familiarity with the presented numbers, we tested their number knowledge using an adapted version of a give-a-number test (Wynn, 1990).
Method Participants
Seventy-seven 1st-graders (mean age = 86 months; SD = 4.76 months; range = 74 – 101 months; 41 girls, 36 boys; 8 left-handed) participated in the present study. Three additional children were tested but excluded from the final sample because they failed to comply with the task instructions. Children were recruited in schools in or near a large city in Switzerland. Children’s verbal assents and signed parental consent forms were obtained prior to the study. The study followed ethical guidelines and was approved by the Ethics Committee of the University of Fribourg. Children received a small gift for their participation.
Number-line task (priming)
Children were tested individually in a quiet room in their schools. First, the
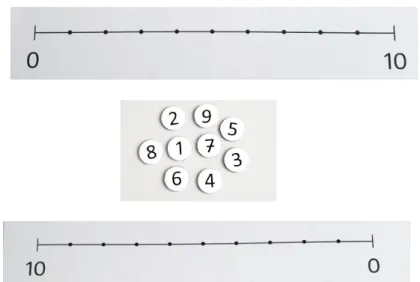
experimenter presented a number line (34 cm) and placed it on a table in front of the child. In the 0-to-10 condition (n = 39), the number line was labeled “0” at the left and “10” at the right end; in the 10-to-0 condition (n = 38), the line was labeled “10” at the left and “0“ at the right end. There were small hash marks for missing numbers (1-9) in the correct spatial positions on the number line (see Figure 1a). Above the number line, children saw a set of small cards with numbers ranging from 1 to 9 (1.7 cm in height) enclosed by a black circle (2.7 cm in diameter). The numbers were presented upright in a random arrangement. Children were asked to search for a particular number and to place this number on the number line “in the correct place, where it belongs”. Numbers were cued one after another in one of 9
different quasi-random orders according to a Latin-square design. If children picked the wrong number or position, they were corrected and granted another attempt. Children’s performance was coded as successful (1 point), successful on the second attempt (0.5 points), or not successful within two attempts (0 points).
Manual-pointing task
Immediately after this priming, children proceeded to the manual-pointing task. This task was presented on a 17-inch touch-screen monitor (Elo TouchSystems 1739L) by the use of Cedrus Superlab 4.5 software. The screen was placed horizontally in front of the children. Children started each trial by touching a blue fingerprint at the bottom center of the screen. Upon touching this fingerprint, one of four one-digit numbers (1, 3, 7, 9) was presented randomly in four different positions (extreme left [EL], left [L], right [R], or extreme right [ER]). These positions were distributed in the horizontal dimension reflecting the distances between the presented numbers. The vertical position was kept constant in the middle of the screen. The numbers were 1.8 cm in height, presented in black color on white background, and enclosed by a black circle (2.8 cm in diameter; see Figure 1b).
Using a Go/No-Go task, children were asked to press the appearing numbers as fast and accurately as possible with the index finger of their dominant hand. In the first half of the experiment (first 48 trials), children were instructed to press only the numbers that were smaller than 5 (Go-trials) and to keep their finger on the fingerprint if the numbers were larger than 5 (No-Go-trials). In the second half (second 48 trials), children were asked to press only the numbers that were larger than 5 (with order of smaller and larger targets being counterbalanced between children). To facilitate this switch in targets, there was a break between experiment halves, during which children were distracted with some short physical activities and games.
Each experiment half started with 8 practice trials, four of which were Go-trials, with different numbers (2, 4, 6, 8) presented in different positions than later test trials. On practice trials, children received corrective feedback: if they responded correctly, a smiley face appeared; if they responded incorrectly, a frowning face appeared. Children did not receive feedback throughout the test phase. The 48 test trials consisted of 32 Go-trials (2 target numbers x 4 positions x 4 measurement repetitions) and 16 No-Go-trials (2 target numbers x 4 positions x 2 measurement repetitions). Inter-stimulus-intervals varied between 1000 and 2000 ms (in steps of 200 ms). Children’s RTs were measured from stimulus appearance to pressing the number.
Give-a-number task
After the manual-pointing task, children were examined with an adapted version of the give-a-number task (Wynn, 1990). Children were presented with small cards (5 x 5 cm) showing 3, 5, 7, or 9 dots (1 cm in diameter) in a random arrangement. Next to these cards, children saw a set of circular cards (2.7 cm in diameter) showing the equivalent upright-presented Arabic numbers (1.7 cm in height, see Figure 1c). First, the experimenter asked the child to “give the card showing three dots”. If the child picked the correct card, the
experimenter pointed toward the Arabic numbers and asked: “which of these cards is also a three”? The experimenter continued with the other numbers in increasing order. If the children picked the wrong number, they were corrected and granted another attempt to pick the correct card. Children’s performance was coded as successful (1 point), successful on the second attempt (0.5 points), or not successful within two attempts (0 points). The entire testing session took approximately 30-40 minutes per child.
Results Number-line Task
In the number-line task, children recognized all of the presented numbers and put 98.6% of them in the correct place. In the give-a-number task, children were 99.4% and 99.8% correct, for dots and symbols, respectively.
Manual-pointing Task
In the manual-pointing task, children’s accuracy (i.e., percentage of correctly answered trials according to the instruction) for Go- and No-Go trials and RTs (in ms) for Go-trials were analyzed. Outliers in children’s RTs that were more than three standard deviations above the group mean or below 120 ms (cf. Ishihara et al., 2006) were excluded (amounting to 3.37% of all trials). We computed the median RTs of the correct responses for each number and location across measurement repetitions (cf. Fias, Brysbaert, Geypens, & d’Ydewalle, 1996). Greenhouse-Geisser corrections for repeated measures analyses were used to account for violations of the sphericity assumption whenever necessary.
Accuracy. To test whether children’s accuracy differed between Go- and No-Go trials,
an analysis of variance (ANOVA) was carried out with trial type (Go- vs. No-Go) and instruction (smaller vs. larger than 5) as within-participant variables and number-line condition (0-to-10 vs. 10-to-0), instruction order (smaller than 5 first vs. larger than 5 first), and sex as between-participants variables. Children’s accuracy served as the dependent variable. This ANOVA revealed a significant effect of trial type, F(1, 69) = 51.72, p < .001, η2 = .43, with children responding more accurately on Go-trials (M = 99.6%, SE = 0.3) as compared to No-Go trials (M = 94.8%, SE = 0.8). In other words, false-alarms were more frequent than missed targets. There were no further significant effects (all Fs < 3.13, all ps > .08) and specifically, no interactions or main effects involving number-line condition (all Fs < 1).
Response Times. An overall ANOVA with number (1, 3, 7, 9) and position (EL, L, R,
instruction order (smaller than 5 first vs. larger than 5 first), and sex as between-participants variables revealed a significant interaction of instruction order and position, F(2.57, 184.74) = 3.17, p < .05, η2 = .04. Follow-up pairwise comparisons (Sidak corrected here and
throughout) indicated that children tested with the “smaller than 5” instruction first showed faster responses to the position L (M = 1052, SE = 37) than children tested with the “larger than 5” instruction first (M = 1170, SE = 37; p < .05). However, given that these two groups did not differ in their responding with respect to any other position (all ps > .075) and there were no further significant effects involving the between-participants variables sex and instruction order (all Fs > 2.35, all ps > .13), data were collapsed across these between-participants variables in subsequent analyses.
To investigate whether number-line condition, number, and position affected
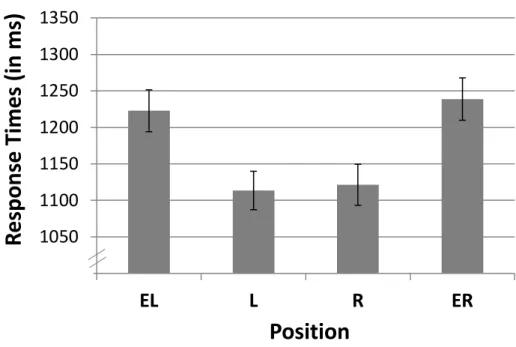
children’s RTs, a similar ANOVA with these variables was computed. The ANOVA yielded a significant main effect of position, F(2.52, 180.80) = 32.51, p < .001, η2 = .30. As can be seen in Figure 2, children needed longer to respond to extreme positions (MEL = 1223, MER =
1239) as compared to the more central positions (ML = 1114, MR = 1121). This was
confirmed by pairwise comparisons indicating no significant differences between the extreme positions EL and ER (p = .94) as well as the central positions L and R (p = .997) whereas all the other comparisons were significant (all ps < .001). Furthermore, there was a significant main effect of number-line condition, F(1, 75) = 4.70, p < .05, η2 = .06, due to children’s longer RTs in the 10-to-0 condition (M = 1231, SE = 37) as compared to the 0-to-10 condition (M = 1117, SE = 37, p < .05). Notably, there was a significant interaction of number and position, F(6.59, 493.90) = 2.26, p < .05, η2 = .03. However, number-line condition did not interact with any of the variables tested (all Fs < 1.77, all ps > .10), with particularly the three-way interaction of number, position, and number-line condition being non-significant,
priming did not affect the spatial representation of numbers in the subsequent Go/No-Go task. There were no further significant effects (all Fs < 1.78, all ps > .15).
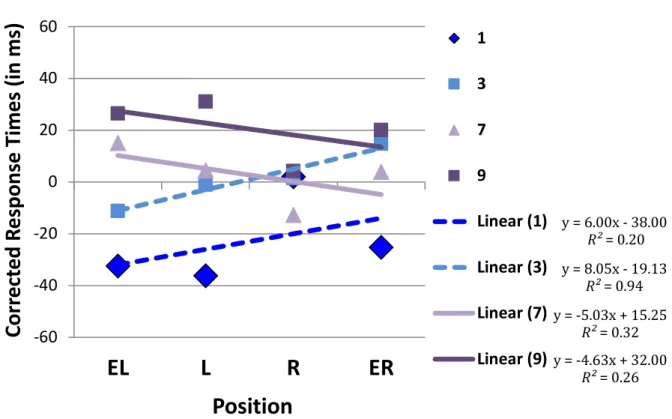
Corrected Response Times. Because there was a biomechanical distance effect which
resulted in larger RTs for longer distances from the starting position (see Figure 2), we ran another analysis based on RTs that were corrected for this biomechanical distance effect. To do so, we computed the median RTs for each position (EL, L, R, ER) for each individual child, and subtracted them from the child’s responses to this respective position. We then computed an ANOVA with these corrected RTs as dependent variable and number and position as within-participant variables. The interaction of number and position was again significant, F(6.58, 500.12) = 2.23, p < .05, η2 = .03, suggesting that the position, in which the numbers were presented, significantly affected children’s RTs.
In order to further investigate the nature of this interaction, we performed regression analyses. In analogy to analyses conducted in Ishihara et al. (2006), we performed regression analyses on the corrected RTs and fitted regression lines for each separate number (for regression equations and R2s, see Figure 3). As can be seen in Figure 3, RTs increased for
small numbers the further they were presented towards the right, as indicated by positive slopes, and decreased for large numbers the further they were presented towards the right, as indicated by negative slopes.
Normalized Response Times. In order to compare the position effects across the
different numbers, we additionally normalized RTs. To do so, we computed the median of the corrected RTs for each number (1, 3, 7, 9) for each individual child and subtracted these values from each child’s responses to this respective number. Figure 4 shows the modulation of children’s normalized RTs by number and position. As can be seen, there was a rise in children’s RTs for incongruent spatial-numerical combinations (i.e., large/left, small/right) and a drop in RTs for congruent combinations (i.e., small/left, large/right). This impression
was further supported by a Wilcoxon rank sum test, for which the 16 possible combinations of normalized RTs were categorized as either congruent number-space mappings (i.e., 1 and EL, 3 and R, 7 and R, 9 and ER) or incongruent mappings (i.e., all other combinations). This Wilcoxon test revealed significantly lower ranks for the congruent mappings (M = 4.50) as compared to incongruent mappings (M = 9.83), z = -1.94, p < .05 (one-tailed), indicating significantly shorter RTs for congruent number-space combinations as opposed to incongruent ones.
Discussion
The current study investigated the nature of 7-year-olds’ spatial-numerical
associations using a manual-pointing task. Results from the number-line and give-a-number tasks demonstrated that children were highly familiar with the presented numbers from 1 to 9. Results from the manual-pointing task indicated that children generally adhered to the
instructions. They were highly accurate when responding to Go-trials (99.5%) and significantly less but still highly accurate when responding to No-Go-trials (94.8%). This difference in responding to Go- and No-Go trials is not surprising given that participants had plenty of time to respond (and thus to revise their response on Go-trials if necessary).
Crucially, the present results showed that children’s RTs (corrected for effects of position due to the distance from the starting position) increased the further small numbers were presented toward the right, and the further large numbers were presented toward the left on the touch screen. These results replicate and add to previous findings of spatial-numerical associations in adults (e.g., Calabria & Rossetti, 2005; Dehaene et al., 1993; Fias, 2001; Fischer, 2001; Fischer et al., 2003; Ishihara et al., 2006) and suggest that even young children represent numbers spatially. The present findings are also in line with theoretical accounts (e.g., Walsh, 2003) suggesting that spatial and numerical magnitudes are processed by a common system. Furthermore, our results extend previous developmental findings of early
spatial-numerical associations (e.g., Ebersbach, 2015; Hoffmann et al., 2013; Mills et al., 2014; Patro & Haman, 2012), by showing that in children as young as 7 years of age,
number-space mappings are continuous in nature, and likely reflect a systematic left-to-right organization of children’s number representations. In contrast to previous findings (e.g., Van Galen & Reitsma, 2008), the results obtained with the present paradigm are not confounded with a numerical distance effect, as spatial compatibility effects on RTs were analyzed within every single number. Therefore, the present results suggest continuous spatial-numerical associations in children similar to the ones found in adults (cf., Ishihara et al., 2006).
Interestingly, there were no interactions of number-line condition, indicating that 1st-graders spontaneously employed a spatial number representation that is oriented from left to right, and that this left-to-right organization could not easily be changed by priming a differently oriented representation. This suggests that in contrast to adults (Bächthold et al., 1998; Galfano et al., 2006; Ranzini et al., 2009; Ristic et al., 2006), 7-year-olds cannot flexibly adapt these associations yet, in line with developmental theories proposing more flexible and abstract representations with increasing age (Bruner, Olver, & Greenfield, 1966; Kosslyn, 1978; Piaget & Inhelder, 1948/1956). This result also contrasts findings in 3- to 4-year-olds (Patro et al., 2016), who showed a reversed SNARC effect for non-symbolic numbers after non-numerical training of moving an object from the right to the left side on a touch screen. A possible explanation for this discrepancy is that Patro and colleagues used non-symbolic numbers, whereas in the present study children were presented with symbolic numbers. Symbolic numbers are a cultural product, and as such may be more tightly
associated with the prevalent way in which this symbol system is culturally transmitted. The processing of non-symbolic numbers seems to be less closely tied to cultural conventions (cf. Göbel et al., 2011), and thus may be more flexibly adapted in different contexts. Future studies could clarify whether a longer number-line training or more experience with
alternative spatial representations of numbers that do not imply a left-to-right orientation (e.g., a clock face), would have a stronger impact on the direction of number-space mappings in children.
The results that spatial-numerical associations were already present and also rather stable at the onset of formal schooling are in line with previous findings that
spatial-numerical associations develop early (e.g., Bulf et al., 2016; de Hevia et al., 2014; Ebersbach, 2015; Hoffmann et al., 2013; Mills et al., 2014; Patro & Haman, 2012; Van Galen & Reitsma, 2008), and have even been shown in non-human animals (e.g., Adachi, 2014; de Hevia et al., 2014; Bulf et al., 2016; Rugani et al., 2015). However, design constraints in infant and animal research make it difficult to shed light onto the nature of these spatial-numerical associations. For instance, in these studies, researchers typically measure participants’ responses to a single small as opposed to a large non-symbolic number, making it difficult to clarify whether infants or non-human animals map numbers continuously or categorically onto space. Our study extends this previous research by showing that at least at 7 years of age, children show continuous spatial-numerical associations for symbolic numbers. Future research may shed light on the continuous nature of spatial-numerical associations in younger children and non-human species.
Our results that spatial-numerical associations could already be found at the onset of formal schooling further suggest that formal reading instruction and the introduction to spatial tools used in educational settings are not the primary source of these associations. However, children are exposed to culturally transmitted left-right biases early in their
development, which - according to the implicit instruction account (Patro et al., 2016) - may influence the spatial properties of their mental representations (e.g., looking at picture books from left to right, observing how parents write or count objects from left to right; see also McCrink, Caldera, & Shaki, 2017). This influence may be more entrenched the more abstract
and culturally shaped the contents are. Future research comparing spatial-numerical associations for symbolic and non-symbolic numbers may investigate this possibility.
Ethical approval: All procedures performed in the current study involving human
participants were in accordance with the ethical standards of the institutional and/or national research committee and with the 1964 Helsinki declaration and its later amendments or comparable ethical standards.
References
Adachi, I. (2014). Spontaneous spatial mapping of learned sequence in chimpanzees: Evidence for a SNARC-like Effect. PLoS One, 9, e90373.
Bächtold, D., Baumüller, M., & Brugger, P. (1998). Stimulus-response compatibility in representational space. Neuropsychologia, 36, 731-735.
Berch, D. B., Foley, E. J., Hill, R. J., & Ryan, P. M. (1999). Extracting parity and magnitude from Arabic numerals: Developmental changes in number processing and mental representation. Journal of Experimental Child Psychology, 74, 286-308.
Briars, D., & Siegler, R. S. (1984). A featural analysis of preschoolers' counting knowledge.
Developmental Psychology, 20, 607–618.
Bruner, J. S., Olver, R. O., & Greenfield, P. M. (1966). Studies in cognitive growth. New York: Wiley.
Bulf, H., de Hevia, M. D., & Macchi-Cassia, V. (2016). Small on the left, large on the right: Numbers orient preverbal infants’ visual attention onto space. Developmental Science,
19, 394-401.
Calabria, M., & Rossetti, Y. (2005). Interference between number processing and line bisection: A methodology. Neuropsychologia, 43, 779–783.
Dehaene, S., Bossini, S., & Giraux, P. (1993). The mental representation of parity and number magnitude. Journal of Experimental Psychology: General, 122, 371. de Hevia, M. D., Girelli, L., Addabbo, M., & Macchi Cassia, V. (2014). Human infants’
preference for left-to-right oriented increasing numerical sequences. PLoS One, 9, e96412.
Drucker, C. B., & Brannon, E. M. (2014). Rhesus monkeys (Macaca mulatta) map number onto space. Cognition, 132, 57-67.
number line task. Journal of Cognition and Development, 16, 118-128.
Fias, W. (2001). Two routes for the processing of verbal numbers: Evidence from the SNARC effect. Psychological Research, 65, 250–259.
Fias, W., Brysbaert, M., Geypens, F., & d’Ydewalle, G. (1996). The importance of magnitude information in numerical processing: Evidence from the SNARC effect.
Mathematical Cognition, 2, 95-110.
Fischer, M. H. (2001). Number processing induces spatial performance biases. Neurology,
57, 822–826.
Fischer, M. H., Castel, A. D., Dodd, M. D., & Pratt, J. (2003). Perceiving numbers causes spatial shifts of attention. Nature Neuroscience, 6, 555–556.
Fischer, M. H., & Shaki, S. (2014). Spatial associations in numerical cognition: From single digits to arithmetic. Quarterly Journal of Experimental Psychology, 67, 1461-1483. Fischer, M. H., Shaki, S., & Cruise, A. (2009). It takes just one word to quash a SNARC.
Experimental Psychology, 56, 361-366.
Gevers, W., Verguts, T., Reynvoet, B., Caessens, B., & Fias, W. (2006). Numbers and space: A computational model of the SNARC effect. Journal of Experimental Psychology:
Human Perception and Performance, 32, 32-44.
Galfano, G., Rusconi, E., & Umiltà, C. (2006). Number magnitude orients attention, but not against one’s will. Psychonomic Bulletin & Review, 13, 869-874.
Göbel, S. M., Shaki, S., & Fischer, M. H. (2011). The cultural number line: a review of cultural and linguistic influences on the development of number processing. Journal of
Cross-Cultural Psychology, 42, 543-565.
Hoffmann, D., Hornung, C., Martin, R., & Schiltz, C. (2013). Developing number–space associations: SNARC effects using a color discrimination task in 5-year-olds. Journal
Hubbard, E. M., Piazza, M., Pinel, P., & Dehaene, S. (2005). Interactions between number and space in parietal cortex. Nature Reviews Neuroscience, 6, 435-448.
Ishihara, M., Jacquin-Courtois, S., Flory, V., Salemme, R., Imanaka, K., & Rossetti, Y. (2006). Interaction between space and number representations during motor preparation in manual aiming. Neuropsychologia, 44, 1009-1016.
Kamawar, D., LeFevre, J., Bisanz, J., Fast, L., Skwarchuk, S. L., Smith-Chant, B. L., & Penner-Wilger, M. (2010). Knowledge of counting principles: How relevant is order irrelevance? Journal of Experimental Child Psychology, 105, 138-145.
Knudsen, B., Fischer, M. H., & Aschersleben, G. (2015). Development of spatial preferences for counting and picture naming. Psychological Research, 79, 939-49.
Kosslyn, S. M. (1978). The representational-development hypothesis. In P. A. Ornstein (Ed.),
Memory development in children (pp. 157-189). Hillsdale, NJ: Erlbaum.
McCrink, K., Caldera, C, & Shaki, S. (2017). The early construction of spatial attention: Culture, space, and gesture in parent-child interactions. Child Development. Advanced online publication: doi:10.1111/cdev.12781.
McCrink, K., & Opfer, J. E. (2014). Development of spatial-numerical associations. Current
Directions in Psychological Science, 23, 439-445.
Mills, K. J., Rousseau, B. R., & Gonzalez, C. L. (2014). A cross-sectional developmental examination of the SNARC effect in a visually-guided grasping task.
Neuropsychologia, 58, 99-106.
Nuerk, H.-C. , Patro, K., Cress, U., Schild, U., Friedrich, C. K., & Goebel, S. M. (2015). How space-number associations may be created in preliterate children: six distinct
mechanisms. Frontiers in Psychology, 6, 215.
Opfer, J. E., Thompson, C. A., & Furlong, E. E. (2010). Early development of spatial numeric associations: Evidence from spatial and quantitative performance of
preschoolers. Developmental Science, 13, 761–771.
Patro, K., Fischer, U., Nuerk, H.-C., & Cress, U. (2016). How to rapidly construct a spatial-numerical representation in preliterate children (at least temporarily). Developmental
Science, 19, 126-144.
Patro, K., & Haman, M. (2012). The spatial-numerical congruity effect in preschoolers.
Journal of Experimental Child Psychology, 111, 534–542.
Piaget, J., & Inhelder, B. (1956). The child’s conception of space (F. J. Langdon & J. L. Lunzer, Trans.). New York: Norton. (Original work published 1948).
Ranzini, M., Dehaene, S., Piazza, M., & Hubbard, E. (2009). Neural mechanisms of attentional shifts due to irrelevant spatial and numerical cues. Neuropsychologia, 47, 2615-2624.
Ristic, J., Wright, A., & Kingstone, A. (2006). The number line reflects top-down control.
Psychonomic Bulletin & Review, 13, 862–868.
Rugani, R., Vallortigara, G., Priftis, K., & Regolin, L. (2015). Number-space mapping in the newborn chick resembles humans’ mental number line. Science, 347(6221), 534-536. Shaki, S., & Fischer, M. H. (2008). Reading space into numbers - A cross-linguistic
comparison of the SNARC effect. Cognition, 108, 590-599.
Shaki, S., Fischer, M. H., & Petrusic, W. M. (2009). Reading habits for both words and numbers contribute to the SNARC effect. Psychonomic Bulletin & Review, 16, 328-331.
van Galen, M. S., & Reitsma, P. (2008). Developing access to number magnitude: A study of the SNARC effect in 7-to 9-year-olds. Journal of Experimental Child Psychology, 101, 99-113.
Walsh, V. (2003). A theory of magnitude: Common cortical metrics of time, space, and quantity. Trends in Cognitive Sciences, 7, 483–488.
Wood, G., Nuerk, H.-C., Willmes, K., & Fischer, M. H. (2008). On the link between space and number: A meta-analysis of the SNARC effect. Psychology Science, 50, 489-525. Wynn, K. (1990). Children’s understanding of counting. Cognition, 36, 155–193.
Zebian, S. (2005). Linkages between number concepts, spatial thinking, and directionality of writing: The SNARC effect and the reverse SNARC effect in English and Arabic monoliterates, biliterates, and illiterate Arabic speakers. Journal of Cognition and
Table 1. Median corrected response times (in ms) for the different numbers and positions in
the manual-pointing task (EL: extreme left, L: left, R: right, ER: extreme right). Standard errors are presented in parentheses.
Number 1 3 7 9 Position EL -32.50 (19.49) -11.25 (16.49) 15.00 (21.59) 26.50 (19.56) L -36.25 (20.37) -1.00 (20.74) 4.50 (14.42) 31.00 (14.02) R 2.00 (29.59) 1.50 (26.25) -12.75 (17.96) 4.25 (16.55) ER -25.25 (20.90) 14.75 (24.33) 4.00 (24.58) 20.00 (17.41)
Figure Captions
Figure 1. Stimulus material for the number-line task (A), the give-a-number task (C) and a
schematic sequence of a Go-trial of the manual-pointing task (B). Numbers in (B) are slightly enlarged for visibility.
Figure 2. Median response times (in ms) for the different positions in the manual-pointing
task (EL: extreme left, L: left, R: right, ER: extreme right).
Figure 3. Median corrected response times (in ms) for the different numbers and positions in
the manual-pointing task (EL: extreme left, L: left, R: right, ER: extreme right). Symbols indicate medians; lines indicate fitted regression lines.
Figure 4. Median normalized response times (in ms) for the different numbers and positions
in the manual-pointing task (EL: extreme left, L: left, R: right, ER: extreme right). The curved surface was fitted to the normalized response times. The surface was interpolated for data of the number 5 and the central position (which we did not collect).
Figure 1. A) Number-line task B) Manual-pointing task C) Give-a-number task
Figure 2. 1000 1050 1100 1150 1200 1250 1300 1350
EL
L
R
ER
Re
sp
on
se
T
im
es
(i
n
m
s)
Position
Figure 3. y = 6.00x - 38.00 R² = 0.20 y = 8.05x - 19.13 R² = 0.94 y = -5.03x + 15.25 R² = 0.32 y = -4.63x + 32.00 R² = 0.26 -60 -40 -20 0 20 40 60