HAL Id: cea-00881343
https://hal-cea.archives-ouvertes.fr/cea-00881343
Submitted on 28 Sep 2020
HAL is a multi-disciplinary open access
archive for the deposit and dissemination of
sci-entific research documents, whether they are
pub-lished or not. The documents may come from
teaching and research institutions in France or
abroad, or from public or private research centers.
L’archive ouverte pluridisciplinaire HAL, est
destinée au dépôt et à la diffusion de documents
scientifiques de niveau recherche, publiés ou non,
émanant des établissements d’enseignement et de
recherche français ou étrangers, des laboratoires
publics ou privés.
Large-scale vortex lattice emerging from collectively
moving microtubules
Yutaka Sumino, Ken H. Nagai, Yuji Shitaka, Dan Tanaka, Kenichi
Yoshikawa, Hugues Chaté, Kazuhiro Oiwa
To cite this version:
Yutaka Sumino, Ken H. Nagai, Yuji Shitaka, Dan Tanaka, Kenichi Yoshikawa, et al.. Large-scale
vortex lattice emerging from collectively moving microtubules. Nature, Nature Publishing Group,
2012, 483 (7390), pp.448-452. �10.1038/nature10874�. �cea-00881343�
LETTER
doi:10.1038/nature10874Large-scale vortex lattice emerging from collectively
moving microtubules
Yutaka Sumino1*, Ken H. Nagai2*, Yuji Shitaka3, Dan Tanaka4{, Kenichi Yoshikawa5, Hugues Chate´6& Kazuhiro Oiwa3,7
Spontaneous collective motion, as in some flocks of bird and schools of fish, is an example of an emergent phenomenon. Such phenomena are at present of great interest1–5and physicists have put forward a number of theoretical results that so far lack experi-mental verification6–8. In animal behaviour studies, large-scale data collection is now technologically possible, but data are still scarce and arise from observations rather than controlled experi-ments. Multicellular biological systems, such as bacterial colonies or tissues9,10, allow more control, but may have many hidden variables and interactions, hindering proper tests of theoretical ideas. However, in systems on the subcellular scale such tests may be possible, particularly in in vitro experiments with only few purified components11–13. Motility assays, in which protein filaments are driven by molecular motors grafted to a substrate in the presence of ATP, can show collective motion for high densities of motors and attached filaments. This was demonstrated recently for the actomyosin system14,15, but a complete understanding of the mechanisms at work is still lacking. Here we report experiments in which microtubules are propelled by surface-bound dyneins. In this system it is possible to study the local interaction: we find that colliding microtubules align with each other with high probability. At high densities, this alignment results in self-organization of the microtubules, which are on average 15 mm long, into vortices with diameters of around 400 mm. Inside the vortices, the microtubules circulate both clockwise and anticlockwise. On longer timescales, the vortices form a lattice structure. The emergence of these struc-tures, as verified by a mathematical model, is the result of the smooth, reptation-like motion of single microtubules in combina-tion with local interaccombina-tions (the nematic alignment due to colli-sions)—there is no need for long-range interactions. Apart from its potential relevance to cortical arrays in plant cells16,17
and other biological situations, our study provides evidence for the existence of previously unsuspected universality classes of collective motion phenomena.
Our experimental in vitro motility assay consisted of dynein motor proteins grafted to a glass surface at a density of 750–2,500 molecules per square micrometre and to fluorescently labelled, stabilized microtubules (details can be found in Supplementary Methods). We used inner-arm dynein subspecies c (dynein c) purified from Chlamydomonas flagella. This drove the microtubules, with their plus ends leading, at a mean velocity of ,12 mm s21in vitro at 23uC in the presence of 1 mM ATP, while rotating them around their longitudinal axis in a clockwise direction as viewed from their minus ends18,19. (‘Plus’ and ‘minus’ here refer to microtubule polarity.) When introduced in a flow cell, the microtubules did not move and bound to the dynein-c-coated glass surface in the absence of ATP18,19. On addition of 1 mM Mg–ATP, they started moving smoothly on the surface at a fairly constant speed. No preferred direction of isolated microtubule motion was observed. The
smoothness and isotropy of motion reflect the fact that relatively many, randomly oriented, dyneins were attached at any time to a given microtubule.
Using microtubules at a concentration of 40 mg ml21, which is a few times greater than in conventional assays18, we found the density of attached microtubules to be 0.05 mm22(there were five microtubules, 15.6 6 7.3 mm in length (mean 6 s.d., n 5 257), per 100 mm2). On addition of ATP (at 0 min), we observed many aligning collisions (discussed further below) that gradually led to streams along which dozens of microtubules moved in both directions. The size of a stream increased in time (by more than 10 mm in width and more than 100 mm in length) (12 min; Fig. 1a). The streams started to meander over the surface typically after 10 min. At 10–20 min, some vortices appeared (17 min; Fig. 1a and Supplementary Movie 1) and eventually covered the flow cell almost entirely, except for the area less than 500 mm away from the boundaries (Fig. 1b). The shape of the vortices gradually changed over time but their diameters were almost constant, at 400 mm (major axis, 443 6 64 mm (s.d., n 5 40); minor axis, 390 6 59 mm (s.d., n 5 40)). At this late stage, the vortices showed a tendency to arrange their positions into a hexagonal lattice, although not perfectly. A given vortex consists of a sparse core and a dense peripheral annulus inside which microtubules move both clockwise and anticlockwise in small streams and slide past each other (Fig. 2 and Supplementary Movie 2). That is, the streams show nematic rather than polar order. Microtubules were never trapped in a vortex: they would circulate inside one vortex for some time before moving to a neighbouring one or travelling farther and starting to revolve around a more distant core.
As the first step in understanding vortex formation, we examined the interactions between microtubules. We decreased their density to 0.5– 1 mg ml21to focus on pair interactions between isolated microtubules.
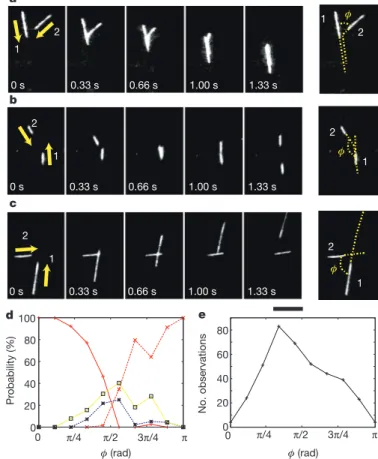
We examined 393 pair collision events. No significant interaction was detected until the pair collided, indicating that long-range, ‘hydro-dynamic’ effects are negligible. On collision, strong interactions due to volume exclusion occurred overwhelmingly (80% of events), leading either to alignment or anti-alignment (70%; Fig. 3a, b) or to the stoppage of one microtubule to prevent it from hitting the other (10%; Fig. 3c). In the remaining fraction of events (20%), the micro-tubules crossed each other with little effect on their trajectories (Fig. 3d, e; see also Supplementary Movie 3). In aligning and anti-aligning collisions, the trajectory of one microtubule undergoes a sharp turn (Fig. 3a, b) and alignment was observed to be near perfect. We believe that this is due to the leading end of the microtubule being relatively free from attached dyneins by comparison with rest of it: on meeting an obstacle, the tip of the microtubule can then bend more easily. Thus, the outgoing angle is near 0 or p in aligning events, irrespective of the value of the incoming angle, w. In stoppage and crossing events, the orientations of both microtubules remain roughly unchanged. (During stoppage events, one microtubule simply ‘waits’
{Deceased.
1Faculty of Education, Aichi University of Education, Aichi 448-8542, Japan.2Department of Physics, Graduate School of Science, The University of Tokyo, Tokyo 113-0033, Japan.3Advanced ICT Research
Institute, National Institute of Information and Communications Technology, Kobe 651-2492, Japan.4Department of Complex Systems Science, Graduate School of Information Science, Nagoya University,
Nagoya 464-8601, Japan.5Department of Physics, Graduate School of Science, Kyoto University and ICORP, JST, Kyoto 606-8502, Japan.6Service de Physique de l’Etat Condense´, CEA-Saclay, 91191
Gif-sur-Yvette, France.7Graduate School of Life Science, University of Hyogo, Harima Science Park City, Hyogo 678-1297, Japan.
until the other has passed (Fig. 3c).) Given that the outcome of each type of collision is well defined, we represented the complete collision statistics in terms of the probability of each collision type as a function of w only (Fig. 3d). We observe an overall symmetry around w 5 p/2, with alignment and anti-alignment occurring mainly for small (w < 0) and large (w < p) angles, respectively, whereas stoppage and crossing dominate for w < p/2. Thus, we conclude that near-perfect nematic alignment is induced by direct collision.
Constant-speed particles aligning nematically in the presence of noise have been studied recently in mathematical models of self-propelled rods, which were shown to give rise to unexpected collective dynamics but not to vortical structures20. Our motility assay has properties not present in simple models of colliding rods. One such feature is the nature of the motion of isolated microtubules: as already mentioned, their reptation-like movement yields smooth but con-stantly turning trajectories, unlike both straight ballistic motion and the ragged behaviour of random walkers submitted to rotational dif-fusion, the individual dynamics adopted in rods models20–22. We analysed the trajectories of isolated microtubules for durations of up to 350 s (Fig. 4a, left). Here we further decreased their concentration, to 4.8 ng ml21. The speed (tangential velocity) of the microtubules fluctuated in time, with a mean of v058.75 mm s21. We also measured
the direction of motion, h (where h 5 0 and p/2 correspond to the direction of the x and y axes, respectively), and the instantaneous angular velocity, and found them to have no significant correlation with the instantaneous speed. This allowed us to neglect the speed fluctuations and focus on h.
A closer look at a representative trajectory (Fig. 4a, right) reveals small-amplitude transverse oscillations, which might be caused by the rotation of the microtubule around its axis18. After an appropriate filter-ing, based on the Savitzky–Golay method, to eliminate these oscillations (Supplementary Methods), we obtained the variation of curvature, k 5 dh/ds, as a function of distance, s, along the trajectory and calculated its autocorrelation (Fig. 4b). (With this definition, k can be positive
t (s) 0 41 0 16.25 x (μm) a b x
Figure 2|Nematic order inside a vortex stream. In this experiment, the microtubules were all stained fluorescent but approximately 0.1% of microtubules were stained to be more fluorescent than the rest. a, Close-up of vortex. Scale bar, 20 mm. b, Spatiotemporal diagram of a magnified region of the vortex shown in a. Yellow lines indicate microtubules travelling from top to bottom, and blue lines indicate microtubules travelling from bottom to top.
a φ φ 0 s 0.33 s 0.66 s 1.00 s 1.33 s 1 2 1 2 0 s 0.33 s 0.66 s 1.00 s 1.33 s 1 2 1 2 b φ 0 s 0.33 s 0.66 s 1.00 s 1.33 s 1 2 1 2 c d 0 20 40 60 80 100 0 π/2 π φ (rad) Pr obability (%) π/4 3π/4 0 20 40 60 80 No. observations 0 π/2 π φ (rad) π/4 3π/4 e
Figure 3|Collision between microtubules. a–c, Three different types of collision between two microtubules. In a and b, microtubule 2 collides with the side of microtubule 1 and changes its direction of motion abruptly, leading to almost perfect alignment (a) or anti-alignment (b). In c, microtubule 2 stops until microtubule 1 has passed. Scale bar, 10 mm. d, Probability of each interaction type as a function of w (see right-most images in a–c). We analysed 393 events. Red lines represent alignment (solid) and anti-alignment (dotted) events; blue dotted lines represent stopping events; yellow solid lines represent crossing-over events. e, Total number of observations in each angular bin.
b a
12.0 min 14.5 min 17.0 min
19.5 min 22.0 min 24.5 min
Figure 1|Emergence of vortices of microtubules. False-colour images. a, Formation process of vortex pattern: 0 min corresponds to the time of injection of ATP. Streams appeared around 5 min after this injection. At 12 min, streams started to meander. Vortices started to appear around 17 min, when meandering streams contacted one another. Once vortices had formed, they grew steadily (22 min). Scale bar, 500 mm. b, Large-scale lattice of vortices. Vortices can be observed everywhere on the surface of the flow cell. Three air bubbles in the flow cell can be seen distinctively owing to their greater size and thicker edges. Scale bar, 2 mm.
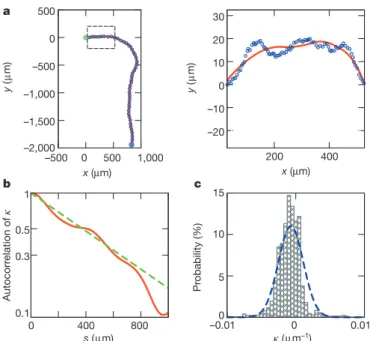
(anticlockwise motion) or negative (clockwise motion).) Fitting the result with the exponential function exp(2s/s0), we found the
persist-ent length, s0, of curvature to be of the order of 500 mm. The
distri-bution of k values observed is roughly Gaussian with mean k05 27.1 3 1024mm21and standard deviation sk51.8 3 1023mm21
(Fig. 4c). We note that these numbers correspond to length scales that are rather large and of the same order as the vortex diameter, and that the small negative value of k0 indicates a preference for clockwise
turning in single-microtubule trajectories, which is probably a con-sequence of the clockwise rotation around of the microtubules around their axes while in motion23. A detailed molecular-level study should confirm this.
We constructed a mathematical model for the collective motion of microtubules in our experimental motility assay by incorporating the few ingredients uncovered in our analysis of the trajectories of single microtubules and of pair collisions. A deliberate choice of minimality was made, to stress that with only these very few features all observed collective phenomena are reproduced, and to allow for numerical simu-lations of millions of objects: for instance, the dynein motors driving the microtubules are not modelled explicitly; the hydrodynamic inter-actions induced by the fluid are neglected, in agreement with our observation that only direct contact modifies the microtubules’ motion. The microtubules themselves are not represented as flexible polymers: here, in the spirit of ref. 6, they are identical point particles moving at constant speed, v0(the speed fluctuations are also neglected). In direct
agreement with the observations reported in Fig. 4, the free motion of particle i, with position xiand orientation hi, is a biased Ornstein–
Uhlenbeck process, vi(t), with correlation time t 5 s0/v0, acting on
the particle’s instantaneous angular velocity, dhi/dt:
dxi dt ~v0(excos hizeysin hi) dhi dt ~vi ð1Þ dvi dt ~{ 1 t(vi{v0)zj(t) ð2Þ
where exand eyare respectively unit vectors in the x and y directions,
j(t) is a Gaussian white noise with zero mean and variance s2~2v02s 2 k=t~2v 3 0s 2
k=s0, and v05v0k0 is the preferred non-zero
angular velocity induced by the mean curvature, k0. This ensures that
all correlation properties of the curvature measured in the experiment are reproduced (Supplementary Methods).
These equations must be complemented with an interaction term. Only the nematic alignment collisions are modelled (because stoppage and crossings do not substantially modify the microtubule orienta-tions). As they were observed to induce much sharper turns in the trajectories (Fig. 3a, b) than the spontaneous curvature changes of free microtubules (Fig. 4a), these collisions are modelled as a nematic alignment term acting directly on the particle orientation hi, that is,
in equation (1), and not on the angular velocity, vi. Following previous
studies6,20, we replaced explicit pair collisions by an effective alignment within an interaction range, l, which is naturally chosen to be the typical microtubule length. Equation (1) is thus replaced by
dxi dt ~v0(excos hizeysin hi) dhi dt ~viz a ni(t) X j*i sin (2(hj{hi)) ð3Þ
where a is a parameter and the sum is over the ni(t) particles j within
distance l of particle i at time t.
Numerical simulations of equations (2) and (3) using experimentally obtained parameters (Supplementary Methods) show the emergence, from disordered initial conditions, of large-scale vortices with a diameter of the same order as those observed in experiments (Fig. 5a and Sup-plementary Movie 4).
Inside vortices, the simulated particles revolved both clockwise and anticlockwise, with the majority moving clockwise, as expected from the non-zero value of v0used. The number of vortices increased
over time and saturated, leading eventually to a regular hexagonal lattice structure. As in our experimental observations, vortices did not form at low densities. To see this more clearly, we calculated u2(n), the variance of the local density in small boxes containing na
particles on average, as a function of the rescaled average density, ra
(the actual density multiplied by l2; Supplementary Methods), the other parameters being kept fixed (Fig. 5b). For rav0:4, the system
remains disordered and u2(n)/nais almost constant, indicating the
absence of density structures (Fig. 5b, right, images (i) and (ii)). However, u2(n)/na increased with ra for raw0:4, indicating the
appearance of a density pattern, which we checked visually to be a vortex lattice (Fig. 5b, right, images (iii) and (iv)). This result is con-sistent with our experimental observation that the vortex pattern dis-appears when the density of microtubules is halved (compare with Supplementary Fig. 1). We also performed numerical simulations in which we varied the rescaled correlation time, l 5 v0t/l
(Supplemen-tary Methods), but kept all the other parameters fixed. Global nematic order without a density pattern was observed for l , 60, but the system showed vortex formation for l . 60 (Fig. 5c). Thus, the large persist-ence length and time of single-microtubule motion is necessary for the emergence of the vortices. Further information on the phase diagram of our mathematical model can be found in Supplementary Methods and Supplementary Fig. 2.
The study of our mathematical model thus shows that smooth trajectories of single microtubules and their direct collisions inducing sharp bends and nematic alignment—both experimentally observed— are sufficient, when associated with self-propulsion, to account for all observed collective properties. In particular, there is no theoretical reason to invoke, nor is experimental evidence of, long-range ‘hydro-dynamic’ interactions or other ‘collective effects’ in our system. By
–2,000 –1,500 –1,000 –500 0 500 –500 0 500 1,000 a –20 –10 0 10 20 30 200 400 0.1 0.3 0.5 1 0 400 800 Autocorr elation of κ b 0 5 10 15 –0.01 0 0.01 Pr obability (%) c x (μm) y ( μ m) x (μm) y (μ m) s (μm) κ (μm–1)
Figure 4|Motion of isolated microtubules. a, Left: trace of an isolated microtubule. Right: enlarged image of boxed area on left. The green and blue filled circles correspond to the start and end points of the observation. The open blue dots represent the position of the microtubule, and the red solid line corresponds to the smoothed curve. b, Autocorrelation of the trajectory curvature, k, with respect to the distance along a trajectory, s (red solid line). The green dotted line is an exponential fit with the correlation length s05542 6 4 mm. c, Distribution of k values observed (bars) and Gaussian fit
contrast, such interactions were relied on to explain some of the collective phenomena observed in the actomyosin system14. We believe that our observations are a consequence of using dynein c motors; in fact, when kinesin was used instead of dynein, microtubules mostly crossed each other and vortex formation could not be observed (Supplementary Fig. 3). With dynein, collisions are frequent enough to induce large-scale order. We suppose that this is due to the mechanical properties of dynein molecules and the asymmetry of their molecular structure. The formation of vortices arises from the smoothness and the curvature persistence of trajectories of single microtubules, both of which properties are, we believe, the consequence of having a relatively large number of motors attached at any time (we estimate it to be of the order of 100).
The vortices observed in our motility assay possess unique features: their large scale (relative to the length of microtubules), the irrelevance of hydrodynamic interactions and the dominantly nematic order
inside them distinguish them from the polar, small-scale vortices formed by swimming sperm cells confined in quasi-two-dimensional conditions24. Their stability in time, and their well-defined diameters also distinguish them from the unstable ‘swirling patterns’ reported in the actomyosin assay14. From a theoretical viewpoint, we are not aware of other models showing a large-scale vortex pattern of the type found here. In our model, the crucial feature introduced is the combination of smooth, reptation-like motion and sharp nematic alignment. This combination can be seen as the signature of a new class in the emerging landscape of universality classes of collective motion phenomena.
Returning to the biological relevance of our findings, we believe that they stress further the message, in various in vivo situations and in particular in plant cell cortical arrays16,17,25,26, that simple physical collisions can induce the reorientation of microtubules, creating large-scale structures even in the absence, here, of crosslinkers27,28. Furthermore, there is a striking analogy between our analysis of micro-tubule collisions and that performed in plant cell cortex17,26,29, although there is only treadmilling and no actual displacement of microtubules in the cortex. As shown in Fig. 3d, in our system the probability of aligning collisions is high at small incoming angles (w 5 0 mod p) and decreases monotonically from 0 to p/2, as for ‘zippering’ (positive-end entrainment) of cortical microtubules.
Well-controlled in vitro experiments of the type reported here present crucial advantages due to the simplicity of the objects involved and the relative ease of collecting large amounts of data: not only can theoretical ideas be tested, but such experiments can reveal the import-ance of mechanisms previously ignored, and allow for quantitative analysis of features also present in vivo. They are and will remain invaluable tools for our understanding of active matter and biological organization processes.
METHODS SUMMARY
We prepared inner-arm dynein and tubulin using standardized protocols19.
Cy3-labelled microtubules were polymerized from a mixture of Cy3–tubulin and non-fluorescent tubulin and were stabilized using Taxol. Fractionated dynein c was diluted at various concentrations (27–90 mg ml21) in buffer solution containing 30 mM HEPES/KOH (pH 7.4), 5 mM MgSO4, 1 mM DTT, 1 mM EGTA and 1 mg
ml21bovine serum albumin. The flow cell was flushed with the diluted dynein
solution, incubated for 5 min and then washed using the buffer solution. Solution containing microtubules as well as 1 mM ATP and 1 mM DTT was introduced into the flow cell. Microtubules were visualized on an epifluorescence microscope. The vortex pattern, binary collisions and individual trajectories were observed with solutions of microtubules with respective concentrations of 40 mg ml21,
0.5–1 mg ml21and 4.8 ng ml21. For single-trajectory analysis, the position of a
microtubule was measured every Dt 5 0.68 s.
Received 14 October 2011; accepted 17 January 2012.
1. Ballerini, M. et al. Interaction ruling animal collective behavior depends on topological rather than metric distance: evidence from a field study. Proc. Natl Acad. Sci. USA105, 1232–1237 (2008).
2. Buhl, J. et al. From disorder to order in marching locusts. Science312, 1402–1406 (2006).
3. Katz, Y., Tunstrøm, K., Ioannou, C. C., Huepe, C. & Couzin, I. D. Inferring the structure and dynamics of interactions in schooling fish. Proc. Natl Acad. Sci. USA108, 18720–18725 (2011).
4. Lukeman, R., Li, Y.-X. & Edelstein-Keshet, L. Inferring individual rules from collective behavior. Proc. Natl Acad. Sci. USA107, 12576–12580 (2010). 5. Sumpter, D. J. T. Collective Animal Behavior (Princeton Univ. Press, 2010). 6. Vicsek, T., Cziro´k, A., Ben-Jacob, E., Cohen, I. & Shochet, O. Novel type of phase
transition in a system of self-driven particles. Phys. Rev. Lett.75, 1226–1229 (1995).
7. Toner, J., Tu, Y. & Ramaswamy, S. Hydrodynamics and phases of flocks. Ann. Phys. 318, 170–244 (2005).
8. Ramaswamy, S. The mechanics and statistics of active matter. Annu. Rev. Condens. Mat. Phys.1, 323–345 (2010).
9. Zhang, H. P., Be’er, A., Florin, E.-L. & Swinney, H. L. Collective motion and density fluctuations in bacterial colonies. Proc. Natl Acad. Sci. USA107, 13626–13630 (2010).
10. Poujade, M. et al. Collective migration of an epithelial monolayer in response to a model wound. Proc. Natl Acad. Sci. USA104, 15988–15993 (2007).
11. Ne´de´lec, F. J., Surrey, T., Maggs, A. C. & Leibler, S. Self-organization of microtubules and motors. Nature389, 305–308 (1997).
a b 000 0 15 3.0 0.0 ρ/ρa 400 800 19,900 1,200 1,600 c
(i) (ii) (iii) (iv)
(i) (ii) (iii) (iv)
3.0 0.0 ρ/ρa 100 101 102 103 (i) (ii) (iii) (iv) 101 102 103 u2(n)/n a 0 0.2 0.4 0.6 0.8 1 S 101 102 103 10–1 100 101 ρa u2(n)/n a
(i)(ii) (iii) (iv) 0 0.2 0.4 0.6 0.8 1 S λ 0 60
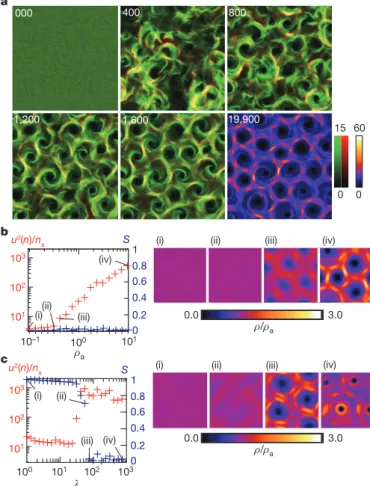
Figure 5|Collective dynamics of mathematical model of interacting, self-propelled particles. See equations (2) and (3). a, Spontaneous formation of a vortex reproduced by our model. Each image is averaged for DT 5 10, where T is simulation time rescaled by l/v0. The brightest area corresponds to a density
of 15 particles per unit area. Green and red respectively correspond to the densities of particles moving clockwise (v , 0) and anticlockwise (v . 0). Yellow regions indicate areas with clockwise and anticlockwise motion in approximately equal proportions. The area of the figure is 512 3 512 simulation cells. The last snapshot, at T 5 19,900, shows the particle densities without differentiating between clockwise and anticlockwise motion, to make comparison with experimental results easy. b, Global nematic order parameter, S, and variance of the local density, u2(n) (calculated over boxes 4 simulation cells in linear size and DT 5 10), divided by the average density for the box, na,
plotted against ra. Corresponding density distributions are shown in images
(i)–(iv) (each corresponds to a different value of ra, as shown, and is a sum over
5,000 snapshots taken at intervals of DT 5 1 in a 256 3 256 system). Here we set the rescaled correlation time, l 5 v0t/l, to l 5 100. c, Same as b, but plotted
against l with ra510. The density distributions correspond to different values
of l, as shown.
12. Surrey, T., Ne´de´lec, F., Leibler, S. & Karsenti, E. Physical properties determining self-organization of motors and microtubules. Science292, 1167–1171 (2001). 13. Loose, M., Fischer-Friedrich, E., Ries, J., Kruse, K. & Schwille, P. Spatial regulators for
bacterial cell division self-organize into surface waves in vitro. Science320, 789–792 (2008).
14. Schaller, V., Weber, C., Semmrich, C., Frey, E. & Bausch, A. R. Polar patterns of driven filaments. Nature467, 73–77 (2010).
15. Butt, T. et al. Myosin motors drive long range alignment of actin filaments. J. Biol. Chem.285, 4964–4974 (2010).
16. Yuan, M., Shaw, P. J., Warn, R. M. & Lloyd, C. W. Dynamic reorientation of cortical microtubules, from transverse to longitudinal, in living plant cells. Proc. Natl Acad. Sci. USA91, 6050–6053 (1994).
17. Wasteneys, G. O. & Ambrose, J. C. Spatial organization of plant cortical microtubules: close encounters of the 2D kind. Trends Cell Biol.19, 62–71 (2009). 18. Kagami, O. & Kamiya, R. Translocation and rotation of microtubules caused by
multiple species of Chlamydomonas inner-arm dynein. J. Cell Sci.103, 653–664 (1992).
19. Sakakibara, H., Kojima, H., Sakai, Y., Katayama, E. & Oiwa, K. Inner-arm dynein c of Chlamydomonas flagella is a single-headed processive motor. Nature400, 586–590 (1999).
20. Ginelli, F., Peruani, F., Ba¨r, M. & Chate´, H. Large-scale collective properties of self-propelled rods. Phys. Rev. Lett.104, 184502 (2010).
21. Kudrolli, A., Lumay, G., Volfson, D. & Tsimring, L. S. Swarming and swirling in self-propelled polar granular rods. Phys. Rev. Lett.100, 058001 (2008).
22. Peruani, F., Deutsch, A. & Ba¨r, M. Nonequilibrium clustering of self-propelled rods. Phys. Rev. E74, 030904(R) (2006).
23. Kikushima, K. & Kamiya, R. Clockwise translocation of microtubules by flagellar inner-arm dyneins. Biophys. J.94, 4014–4019 (2008).
24. Riedel, I. H., Kruse, K. & Howard, J. A self-organized vortex array of hydrodynamically entrained sperm cells. Science309, 300–303 (2005). 25. Tindemans, S. H., Hawkins, R. J. & Mulder, B. M. Survival of the aligned: ordering of
the plant cortical microtubule array. Phys. Rev. Lett.104, 058103 (2010).
26. Allard, J. F., Ambrose, J. C., Wasteneys, G. O. & Cytrynbaum, E. N. A
mechanochemical model explains interactions between cortical microtubules in plants. Biophys. J.99, 1082–1090 (2010).
27. Hess, H. et al. Molecular self-assembly of ‘‘nanowires’’ and ‘‘nanospools’’ using active transport. Nano Lett.5, 629–633 (2005).
28. Schaller, V., Weber, C., Hammerich, B., Frey, E. & Bausch, A. R. Frozen steady states in active systems. Proc. Natl. Acad. Sci. USA108, 19183–19188 (2011). 29. Dixit, R. & Cyr, R. Encounters between dynamic cortical microtubules promote
ordering of the cortical array through angle-dependent modifications of microtubule behavior. Plant Cell16, 3274–3284 (2004).
Supplementary Information is linked to the online version of the paper at www.nature.com/nature.
Acknowledgements We thank H. Sakakibara, Y. Uchida and R. Nakamori for the preparation of the material and observations. They as well as H. Kitahata are also thanked for discussions. Y. Sumino is supported by a Grant-in-Aid for Research Activity Start-up (no. 23840019), Grant-in-Aid for Scientific Research (B) (no. 21340023) and Grant-in-Aid for Scientific Research (A) (no. 20244067). K.H.N. would like to acknowledge the support of a fellowship from the JSPS (no. 23-1819).
Author Contributions K.O. discovered the phenomenon of vortex lattice formation described here and conceived and performed the experiments with Y. Shitaka. Y. Sumino, K.H.N., D.T. and H.C. conceived and designed the simulations. Y. Sumino, K.H.N. and H.C. performed and analysed the simulations. In vitro motility assays were carried out under the directions of K.O. Y. Sumino, K.H.N., Y. Shitaka, H.C., K.Y. and K.O. interpreted the data. Y. Sumino, K.H.N., H.C. and K.O. wrote the paper.
Author Information Reprints and permissions information is available at www.nature.com/reprints. The authors declare no competing financial interests. Readers are welcome to comment on the online version of this article at www.nature.com/nature. Correspondence and requests for materials should be addressed to K.O. ([email protected]).