HAL Id: hal-00297579
https://hal.archives-ouvertes.fr/hal-00297579
Submitted on 3 Nov 2006
HAL is a multi-disciplinary open access
archive for the deposit and dissemination of
sci-entific research documents, whether they are
pub-lished or not. The documents may come from
teaching and research institutions in France or
abroad, or from public or private research centers.
L’archive ouverte pluridisciplinaire HAL, est
destinée au dépôt et à la diffusion de documents
scientifiques de niveau recherche, publiés ou non,
émanant des établissements d’enseignement et de
recherche français ou étrangers, des laboratoires
publics ou privés.
Effects of free atmospheric CO2 enrichment (FACE), N
fertilization and poplar genotype on the physical
protection of carbon in the mineral soil of a polar
plantation after five years
M. R. Hoosbeek, J. M. Vos, E. J. Bakker, G. E. Scarascia-Mugnozza
To cite this version:
M. R. Hoosbeek, J. M. Vos, E. J. Bakker, G. E. Scarascia-Mugnozza. Effects of free atmospheric CO2
enrichment (FACE), N fertilization and poplar genotype on the physical protection of carbon in the
mineral soil of a polar plantation after five years. Biogeosciences, European Geosciences Union, 2006,
3 (4), pp.479-487. �hal-00297579�
www.biogeosciences.net/3/479/2006/ © Author(s) 2006. This work is licensed under a Creative Commons License.
Biogeosciences
Effects of free atmospheric CO
2
enrichment (FACE), N fertilization
and poplar genotype on the physical protection of carbon in the
mineral soil of a polar plantation after five years
M. R. Hoosbeek1, J. M. Vos1, E. J. Bakker2, and G. E. Scarascia-Mugnozza3
1Wageningen University, Department of Environmental Sciences, Earth System Science Group, P.O. Box 37,
6700AA Wageningen, The Netherlands
2Wageningen University, Department of Plant Sciences, Mathematical and Statistical Methods Group, P.O. Box 100,
6700AC Wageningen, The Netherlands
3University of Tuscia, Department of Forest Environment and Resources, Via S.Camillo De Lellis, 01100 Viterbo, Italy
Received: 24 May 2006 – Published in Biogeosciences Discuss.: 5 July 2006
Revised: 23 October 2006 – Accepted: 2 November 2006 – Published: 3 November 2006
Abstract. Free air CO2enrichment (FACE) experiments in
aggrading forests and plantations have demonstrated signifi-cant increases in net primary production (NPP) and C storage in forest vegetation. The extra C uptake may also be stored in forest floor litter and in forest soil. After five years of FACE treatment at the EuroFACE short rotation poplar plantation, the increase of total soil C% was larger under elevated than under ambient CO2. However, the fate of this additional C
allocated belowground remains unclear. The stability of soil organic matter is controlled by the chemical structure of the organic matter and the formation of micro-aggregates (within macro-aggregates) in which organic matter is stabilized and protected. FACE and N-fertilization treatment did not affect the micro- and macro-aggregate weight, C or N fractions ob-tained by wet sieving. However, Populus euramericana in-creased the small macro-aggregate and free micro-aggregate weight and C fractions. The obtained macro-aggregates were broken up in order to isolate recently formed micro-aggregates within macro-micro-aggregates (iM-micro-micro-aggregates). FACE increased the iM-micro-aggregate weight and C frac-tions, although not significantly. This study reveals that FACE did not affect the formation of aggregates. We did, however, observe a trend of increased stabilization and pro-tection of soil C in micro-aggregates formed within macro-aggregates under FACE. Moreover, the largest effect on ag-gregate formation was due to differences in species, i.e. poplar genotype. P. euramericana increased the formation of free micro-aggregates which means that more newly
in-Correspondence to: M. R. Hoosbeek
corporated soil C was stabilized and protected. The choice of species in a plantation, or the effect of global change on species diversity, may therefore affect the stabilization and protection of C in soils.
1 Introduction
Afforestation of agricultural land and regrowth of temperate forests constitute a large carbon (C) sink (Houghton, 2003; Houghton et al., 1998; Janssens et al., 2003). Enhanced growth due to increasing atmospheric CO2concentration is
hypothesized to further increase this terrestrial C sink (Pren-tice et al., 2001). Free air CO2enrichment experiments in
aggrading forests and plantations have demonstrated signifi-cant increases in net primary production (NPP) and C storage in forest vegetation (Calfapietra et al., 2003; DeLucia et al., 1999; Gielen et al., 2005; Hamilton et al., 2002; Liberloo et al., 2006; Norby et al., 2005; Norby et al., 2002). The ex-tra C uptake may, next to forest vegetation, also be stored in forest floor litter and in forest soil. The fate of this addi-tional C allocated belowground remains unclear (Jastrow et al., 2005; Lichter et al., 2005; Norby et al., 2002; Schlesinger and Lichter, 2001). Enhanced carbon transfer to the root sys-tem may result mainly in enhanced root respiration or, other-wise, in an increase of root dry matter, mycorrhizal activity and subsequent transfer of carbon to soil C pools.
The stability of soil organic matter is controlled by the chemical structure of the organic matter and the existence of protection offered by the soil matrix and minerals (Bal-dock and Skjemstad, 2000; Davidson and Janssens, 2006;
480 M. R. Hoosbeek et al.: Effects of elevated CO2and species on soil C protection
Elliott, 1986; Jastrow, 1996; Krull et al., 2003; Six et al., 2002; Van Veen and Kuikman, 1990). The additional C in-put into the soil may affect population size and activity of soil fauna and flora, and may therefore also affect the forma-tion of soil aggregates (Oades, 1993). It has been established that the inclusion of organic matter within aggregates reduces its decomposition rate (Krull et al., 2003; Oades, 1984; Six et al., 2002, 2000; Tisdall and Oades, 1982). Oades (1984, 1993) suggested a model of aggregate formation in which micro-aggregates (∼100 µm in diameter) are formed within macro-aggregates (>250 µm in diameter). This model of the
cycle of aggregate formation has been extended and applied
by Jastrow (1996), Puget (1995) and Six et al. (2002, 2001, 1999, 1998). Fresh plant remains entering the soil become sites for microbial activity and nucleation centers for aggre-gation. The enhanced microbial activity induces the binding of organic matter and soil particles into macro-aggregates. As the enclosed organic matter is decomposed, microbial and decomposition products become associated with min-eral particles (Chenu and Stotzky, 2002). This association results in the formation of micro-aggregates. Eventually, the binding agents in macro-aggregates degrade, resulting in a breakdown of macro-aggregates and the release micro-bially processed organic matter and micro-aggregates. Six et al. (1999) hypothesized that these released micro-aggregates are a mixture of old micro-aggregates, which had been previ-ously formed and incorporated during macro-aggregate for-mation, and newly formed micro-aggregates.
At two sites in Ohio and Ontario Six et al. (2002) found that afforestation of cultivated land resulted in increased ag-gregation and a greater C stock in the A horizons. The micro-aggregates and their capacity to protect C in the longer term were found to be crucial for C sequestration in both forested systems. Twenty years after afforestation of former arable land in northeastern Italy, Del Galdo et al. (2003) observed an increase of soil C of respectively 23 and 6% at 0–10 and 10–30 cm soil depth. Moreover, afforestation resulted in sta-bilization of soil C in micro-aggregates.
After six years of CO2 enrichment at the Duke Forest
FACE experiment, Lichter et al. (2005) did not detect a sig-nificant FACE effect on soil C content. However, the C content of the mineral top soil (0–15 cm) averaged over the FACE and control rings significantly increased during the ex-periment. Physical fractionation suggested that this increase occurred entirely within the free light fraction in which or-ganic C is not protected against decomposition. Fractions in which soil C is protected to some degree, i.e. coarse and fine intra-aggregate particulate organic matter (iPOM) and mineral associated organic matter (micro-aggregates) were not affected by FACE. At the Oak Ridge deciduous forest FACE experiment, organic C in the surface 5 cm of the soil increased linearly during 5 years of CO2enrichment, while
C in the ambient plots remained relatively constant (Jastrow et al., 2005).
After 3 years of FACE treatment at the POPFACE poplar plantation, significantly more new C was incorporated into the mineral soil (Hoosbeek et al., 2004). We also observed a significantly larger increase in total soil C after 5 years of CO2enrichment (Hoosbeek et al., 2006). Chemical
fraction-ation revealed a FACE induced increase of the labile soil C fraction. We hypothesize that this extra labile soil C will in-crease the formation of macro-aggregates and subsequently will increase the formation of micro-aggregates. This FACE enhanced physical protection of soil organic matter may in-crease long-term C sequestration in forest soils.
2 Methods
The POPFACE experiment was established early 1999 on former agricultural fields near Viterbo (42◦3700400N, 11◦8008700E, alt 150 m), Italy. The plantation and adjacent fields had been under forest until about 1950. Since then a variety of agricultural crops has been grown on these former forest soils until the inception of the POPFACE plantation. The annual precipitation is on average 700 mm with dry sum-mers (Xeric moisture regime). During November of 1998 an initial soil survey took place. The loamy soils classified as Pachic Xerumbrepts and were described in detail by Hoos-beek et al. (2004).
Nine ha were planted with Populus x euramericana hard-wood cuttings at a density of 0.5 trees per m2. Within this plantation three FACE and three control plots (30×30 m) were randomly assigned under the condition of a mini-mum distance between plots of 120 m to avoid CO2
cross-contamination. These six plots were planted at a density of 1 tree per m2using three different genotypes. The plots were divided into two parts by a physical resin-glass barrier (1 m deep in the soil) for differential nitrogen treatments in the two halves of each plot. However, because of the high inorganic N content of the soil, no fertilization treatment was applied during the first 3-year rotation of the experiment. Each half plot was divided into three sectors, where each sector was planted at a density of 1 tree per m2 using three different genotypes: P. x euramericana Dode (Guinier) (=P. deltoides Bart. ex Marsh. x P. nigra L.) genotype I-214, a genotype of P. nigra L. (Jean Pourtet) and a local selection of P. alba L. (genotype 2AS11). Carbon enrichment was achieved by injection of pure CO2 through laser-drilled holes in tubing
mounted on six masts (Miglietta et al., 2001). The FACE rings (octagons) within the FACE plots had a diameter of about 22 m. The elevated CO2concentrations, measured at
1-min intervals, were within 20% deviation from the pre-set target concentration (560 µmol mol−1)for 91% of the time to 72.2% of the time, respectively, at the beginning and at the end of each rotation cycle of the plantation. The plantation was drip irrigated at a rate of 6 to 10 mm per day during the growing seasons.
The trees were coppiced after the first three growing sea-sons (1999–2001). The experiment continued with a second rotation under the name EuroFACE (2002–2004). A fertil-ization treatment was added to one half of each experimental plot because soil analyses showed the occurrence of limit-ing conditions of nitrogen availability in the soil (Scarascia-Mugnozza et al., 2006). The total amount of nitrogen sup-plied was 212 kg ha−1y−1in 2002 and 290 kg ha−1y−1 dur-ing 2003 and 2004.
Soil samples were collected from each sector within 2 con-trol (rings 2 and 3) and 2 FACE plots (rings 1 and 4) in Oc-tober of 2003. Bulk density samples, one per sector, were taken at 0–10 cm below the surface of the mineral soil with the help of a bulk density sampler that holds 300 cm3metal rings. The samples were dried at 105◦C for 3 days. Bulk den-sities were calculated based on dry weight and ring volume. Next, the soil samples were crushed by hand and live roots were removed. No carbonates were present in the soil. Car-bon and nitrogen were determined by flash combustion in an elemental analyzer (EA 1108) (Van Lagen, 1996). Total soil organic C and N content are expressed as weight percentage (g C or N per gram soil×100%).
2.1 Whole sample fractionation
For fractionation, one bulk sample per sector was collected with a small spade from the upper 10 cm of the mineral soil and air dried at room temperature. Before drying, large ag-gregates (>1 cm) were broken up along natural planes of weakness. The wet sieving procedure was described by Kemper and Roseau (1986) and Pulleman et al. (2003). Ma-terials used included a wet sieving apparatus, 20 l buckets (used as wet sieving basins) and four 20 cm diameter sieves (2000, 1000, 250 and 53 µm mesh). The buckets were filled with demineralized water; the sieves were stacked, submerg-ing one sieve at a time to prevent air bubbles from gettsubmerg-ing trapped under a sieve. The top sieve (2000 µm) was placed on top of the stack without touching the water at first. Dried soil material was placed on the top sieve, after which the stack of sieves was lowered until the material on the top sieve was just covered by water. The samples were left to slake for 5 min, followed by 2 min of wet sieving. The wet sieving ap-paratus gently lowers and lifts the sieves at a speed of about 30 repetitions per minute, over a distance of 3 cm. After siev-ing, the sieves were lifted out of the water and the material that remained on the sieves was washed into beakers assigned to the specific fractions. The isolated fractions were dried at 40◦C. Four fractions based on the following size classes were
distinguished: 53–250 (micro-aggregates), 250–1000 (small macro-aggregates), 1000–2000 (medium macro-aggregates), and >2000 µm (large macro-aggregates).
Six et al. (1998) used three sieves: 2000, 250 and 53 µm, while we used an additional 1000 µm sieve. The reason for this was the relatively large 250–2000 µm fraction of the samples we used, which tended to block the 250 µm sieve.
We also used 75 g of sample per stack of sieves instead of 100 g in order to prevent blockage.
In general, differences in texture between field plots and aggregate fractions, and the fact that there is hardly any bind-ing between sand particles and organic matter, makes sand fraction correction a necessity when comparing aggregate fractions and their C and N contents (Elliott et al., 1991; Six et al., 1998). Per obtained fraction, 2 g of soil mate-rial was used. The aggregates were destroyed by removing organic matter with peroxide and dispersing clay with a dis-persing solution of sodium carbonate and sodium polyphos-phate. Dispersion was completed by ultrasonic treatment (Van Doesburg, 1996). Next, the destroyed size fraction was washed over the original sieve. The material left on the sieve was taken as the sand fraction. Aggregate weight fractions were calculated as:
Aggregate weight fraction(1..4)=
total weight fraction(1..4)−weight sand fraction(1..4)
total sample weight
C and N contents could only be determined for uncorrected fractions (because the sand correction includes the loss of or-ganic material). However, we assumed that the sand fractions of the aggregate fractions and total sample did not contain C or N (just inert minerals). The aggregate C fractions were calculated as:
Aggregate C fraction(1..4)=
g C fraction(1..4)
g C total sample
The aggregate N fractions were calculated in a similar fash-ion.
2.2 Intra-macro-aggregate (iM) fractions
Next, the small and medium sized macro-aggregate fractions were combined into one 250–2000 µm macro-aggregate fraction. Breaking up this macro-aggregate fraction will, according to the aggregate formation model, result in the release of clay and silt (<53 µm), micro-aggregates (53– 250 µm), and course POM plus sand (>250 µm). These intra-macro-aggregate fractions will be indicated by “iM”. A “micro-aggregate isolator”, as described by Six et al. (2002), was used to break up the macro-aggregates while minimiz-ing the break down of the released iM-micro-aggregates. Ten grams of macro-aggregates were immersed in deionized wa-ter on top of a 250 µ mesh screen and shaken with 50 glass beads (4 mm diameter). A continuous water flow through the device flushed all released iM-micro-aggregates immediately onto a 53 µm sieve, thus avoiding further disruption. After complete breakup of the macro-aggregates, coarse iM-POM and sand remained on the 250 µm mesh screen. The iM-micro-aggregates and the iM-clay and silt fraction were sep-arated by the 53 µm sieve. The iM-micro-aggregate weight fractions were calculated as:
482 M. R. Hoosbeek et al.: Effects of elevated CO2and species on soil C protection
Table 1. Carbon and nitrogen weight percentages of the mineral top soil in the sampled rings (1–4), October 2003.
Treatment C % N % Bulk density
(g soil cm−3)
n mean s.e. mean s.e. mean s.e.
CO2 Ambient 2 1.18 0.04 0.11 0.00 1.26 0.02 FACE 2 1.20 0.03 0.13 0.01 1.17 0.04 N Ambient 4 1.20 0.04 0.12 0.01 1.21 0.03 Fertilized 4 1.18 0.03 0.12 0.00 1.23 0.04 Species alba 8 1.17 0.04 0.12 0.01 1.20 0.05 nigra 8 1.17 0.04 0.12 0.01 1.22 0.05 euramericana 8 1.23 0.05 0.13 0.01 1.23 0.04
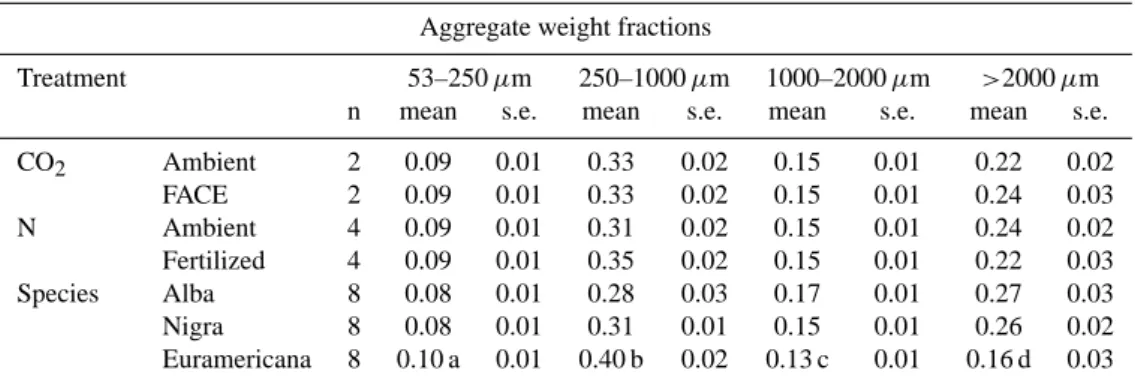
Table 2. Effect of FACE, N-fertilization and species on sand free aggregate weight fractions.
Aggregate weight fractions
Treatment 53–250 µm 250–1000 µm 1000–2000 µm >2000 µm
n mean s.e. mean s.e. mean s.e. mean s.e.
CO2 Ambient 2 0.09 0.01 0.33 0.02 0.15 0.01 0.22 0.02 FACE 2 0.09 0.01 0.33 0.02 0.15 0.01 0.24 0.03 N Ambient 4 0.09 0.01 0.31 0.02 0.15 0.01 0.24 0.02 Fertilized 4 0.09 0.01 0.35 0.02 0.15 0.01 0.22 0.03 Species Alba 8 0.08 0.01 0.28 0.03 0.17 0.01 0.27 0.03 Nigra 8 0.08 0.01 0.31 0.01 0.15 0.01 0.26 0.02 Euramericana 8 0.10 a 0.01 0.40 b 0.02 0.13 c 0.01 0.16 d 0.03
a. Significant species effect (P=0.002) on 53–250 µm aggregate weight fraction. b. Significant species effect (P=0.007) on 250–1000 µm aggregate weight fraction. c. Significant species effect (P=0.005) on 1000–2000 µm aggregate weight fraction. d. Significant species effect (P=0.018) on >2000 µm aggregate weight fraction.
iM micro aggregate weight fraction =
g iM aggregate fraction53−250 µm−g iM sand fraction53−250 µm
g macro aggregate fraction250−2000 µm
The iM-micro-aggregate C fractions were calculated as: iM micro aggregate C fraction =
g C iM aggregate fraction53−250 µm
g C macro aggregate fraction250−2000 µm
The iM-micro-aggregate N fractions were calculated simi-larly.
2.3 Statistical analysis
The EuroFACE field experiment was set up as a split-split-plot design, i.e. the CO2treatments are the whole-plots
(am-bient and FACE rings), which have been split into two N-fertilization treatments, and these sub-plots were then further split into three sub-sub-plots with different poplar genotypes.
At the inception of the experiment, the whole-plots were as-signed randomly within the poplar plantation. In order to account for this we included a random “location” factor in our statistical model. Location was defined as the whole-plot (ring) number (RingNr) within the CO2treatment. We
used the general linear model (SPSS 12.0.1) with the follow-ing design: CO2trmt (fixed); Ntrmt (fixed); Species (fixed); RingNr(CO2trmt) (random); CO2trmt × Ntrmt; Ntrmt × RingNr(CO2trmt); CO2trmt × Species; Ntrmt × Species; CO2trmt × Ntrmt × Species, where RingNr(CO2trmt) indi-cates the nested structure of the data. For practical reasons, i.e. limiting the amount of soil fractionation work, we used samples from 4 whole-plots (ambient rings 2 and 3; FACE rings 1 and 4). The number of replicates per treatment are therefore: CO2treatment n=4 (2 ambient + 2 FACE); N
treat-ment n=8 (4 unfertilized + 4 N-fertilized); Species n=24 (8 P.
alba + 8 P. nigra + 8 P. euramericana). Main or interaction
effects were considered to be significant when the P-value of the F-test was <0.05.
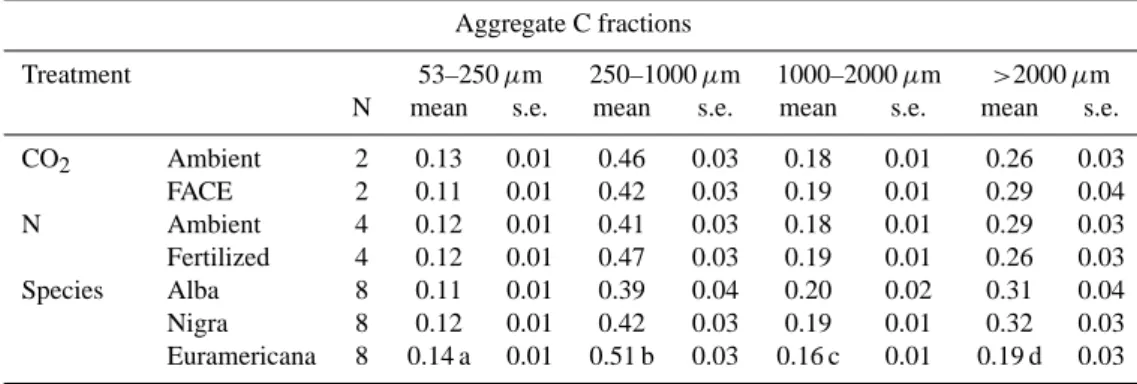
Table 3. Effect of FACE, N-fertilization and species on aggregate C fractions.
Aggregate C fractions
Treatment 53–250 µm 250–1000 µm 1000–2000 µm >2000 µm
N mean s.e. mean s.e. mean s.e. mean s.e.
CO2 Ambient 2 0.13 0.01 0.46 0.03 0.18 0.01 0.26 0.03 FACE 2 0.11 0.01 0.42 0.03 0.19 0.01 0.29 0.04 N Ambient 4 0.12 0.01 0.41 0.03 0.18 0.01 0.29 0.03 Fertilized 4 0.12 0.01 0.47 0.03 0.19 0.01 0.26 0.03 Species Alba 8 0.11 0.01 0.39 0.04 0.20 0.02 0.31 0.04 Nigra 8 0.12 0.01 0.42 0.03 0.19 0.01 0.32 0.03 Euramericana 8 0.14 a 0.01 0.51 b 0.03 0.16 c 0.01 0.19 d 0.03
a. Significant species effect (P=0.002) on 53–250 µm aggregate carbon fraction. b. Significant species effect (P=0.029) on 250–1000 µm aggregate carbon fraction. c. Possible species effect (P=0.090) on 1000–2000 µm aggregate carbon fraction. d. Significant species effect (P=0.026) on >2000 µm aggregate carbon fraction.
Table 4. Effect of FACE, N-fertilization and species on aggregate N fractions.
Aggregate C fractions
Treatment 53–250 µm 250–1000 µm 1000–2000 µm >2000 µm
N mean s.e. mean s.e. mean s.e. mean s.e.
CO2 Ambient 2 0.09 0.01 0.32 0.02 0.15 0.01 0.23 0.04 FACE 2 0.09 0.01 0.30 0.02 0.14 0.01 0.22 0.03 N Ambient 4 0.09 0.01 0.32 0.02 0.14 0.01 0.24 0.03 Fertilized 4 0.08 0.01 0.31 0.02 0.15 0.01 0.22 0.03 Species Alba 8 0.08 0.01 0.30 0.03 0.17 0.01 0.27 0.04 Nigra 8 0.10 0.01 0.33 0.03 0.17 0.01 0.29 0.03 Euramericana 8 0.08 0.01 0.31 0.03 0.10 a 0.01 0.12 b 0.01
a. Significant species effect (P=0.001) on 1000–2000 µm aggregate nitrogen fraction. b. Significant species effect (P=0.007) on >2000 µm aggregate nitrogen fraction.
3 Results
At the end of the fifth growing season, average soil C and N percentages of the top 10 cm of the mineral soil in the sam-pled rings (1–4) were 1.19 and 0.12% respectively (Table 1). The average bulk density was 1.22 g soil cm−3.
3.1 Whole sample fractionation
The small macro-aggregate (250–1000 µm) weight fraction was the largest fraction making up one-third of the total sam-ple weight (Table 2). The second largest weight fraction was the large macro-aggregate (>2000 µm) fraction. FACE and N fertilization treatments had no effect on aggregate weight fractions. However, differences in species did change the weight distribution among the aggregate fractions signifi-cantly. Populus euramericana, as compared to P. alba and
nigra, increased the free micro-aggregate (53–250 µm) and
small macro-aggregate fractions and decreased the medium and large macro-aggregate fraction.
Based on C content, the small macro-aggregate aggregate fraction was again the largest holding on average 44% of the carbon (Table 3). FACE and N fertilization treatments had no effect on the C distribution. However, P. euramericana in-creased the free micro- and small macro-aggregate C fraction while it decreased the medium and large macro-aggregate C fraction.
Most N was contained in the small macro-aggregate frac-tion, making up almost one-third of the total (Table 4). Again, only a species effect was observed. P. euramericana decreased the medium (1000–2000 µm) and large macro-aggregate N fractions.
484 M. R. Hoosbeek et al.: Effects of elevated CO2and species on soil C protection
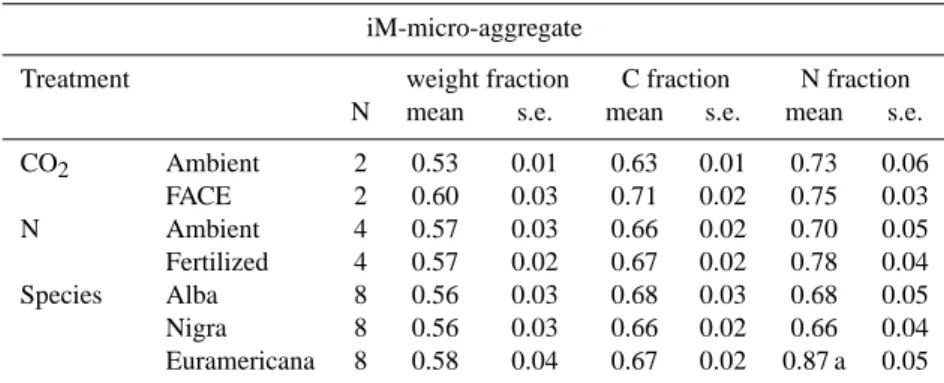
Table 5. Isolated iM-micro-aggregate weight, C and N fractions.
iM-micro-aggregate
Treatment weight fraction C fraction N fraction
N mean s.e. mean s.e. mean s.e.
CO2 Ambient 2 0.53 0.01 0.63 0.01 0.73 0.06 FACE 2 0.60 0.03 0.71 0.02 0.75 0.03 N Ambient 4 0.57 0.03 0.66 0.02 0.70 0.05 Fertilized 4 0.57 0.02 0.67 0.02 0.78 0.04 Species Alba 8 0.56 0.03 0.68 0.03 0.68 0.05 Nigra 8 0.56 0.03 0.66 0.02 0.66 0.04 Euramericana 8 0.58 0.04 0.67 0.02 0.87 a 0.05
a. Significant species effect (P=0.003) on iM-micro-aggregate N fraction.
3.2 Intra-macro-aggregate (iM) fractions
The combined small and medium macro-aggregates con-sisted of, on average by weight percentage, 57% iM-micro-aggregates, 24% iM-coarse POM and sand, and 15% iM-clay and silt particles. FACE and N fertilization treatments and poplar species had no significant effect on the iM-aggregate weight fractions (Table 5; iM-clay and silt and iM-coarse POM and sand data not shown). FACE did however, increase the iM-micro-aggregate weight fraction from 0.53 (ambient) to 0.60 (FACE).
Similarly, FACE and N fertilization treatments and poplar species had no significant effect on the iM-aggregate C frac-tions, although FACE increased the iM-micro-aggregate C fraction. The iM-N fractions were not affected by either FACE or N treatment. However, the iM-micro-aggregate N fraction increased under Populus euramericana.
4 Discussion
In preparation of the POPFACE experiment the experimental field was ploughed during the Fall of 1998 (Hoosbeek et al., 2004). At that time the structure of the loamy A horizon was characterized by coarse prismatic peds (FAO, 1990). Five years after establishment of the plantation, three litter layers (L, F and H) had formed on top of the mineral soil. Under-neath, the structure of the A horizon had changed into fine and medium sized blocky and granular aggregates. In the F, H and A horizons many arthropods and a few earthworms were observed. Afforestation obviously changed the struc-ture of the top soil within 5 years.
We hypothesized that FACE treatment, through an in-crease of net primary production and inin-creased C input into the soil, would increase the formation of macro-aggregates and subsequently the formation of micro-aggregates. We also expected N-fertilization to have a positive effect on aggregate formation because of increased N availability to plants and soil flora and fauna.
4.1 Whole sample fractionation
The results of whole sample fractionation showed no FACE or N fertilization effect on aggregate formation. Instead, a species effect was observed. Fewer medium and large sized and more small sized macro-aggregates were present un-der P. euramericana. Moreover, P. euramericana increased the formation of free micro-aggregates. According to the model of aggregate formation, in which micro-aggregates are formed within macro-aggregates, this increase of free micro-aggregates under P. euramericana may be explained in two ways: 1) More medium and large sized macro-aggregates broke up prior to sampling which increased the number of released micro-aggregates. 2) More small sized macro-aggregates are being formed and subsequently more micro-aggregates are being released. Explanation 1 assumes in-creased disruption or degradation of large macro-aggregates under P. euramericana. Also, it assumes that the medium and large macro-aggregate fractions were not replenished by newly formed medium and large macro-aggregates. Ex-planation 2 assumes an increase in the speed of the cycle of aggregate formation, resulting in an increase of macro-aggregate formation and subsequently an increase of micro-aggregate formation. Explanation 1 seems unlikely because there is no good reason for increased disruption of medium and large macro-aggregates and the subsequent lack of for-mation of new medium and large sized macro-aggregates un-der P. euramericana. Explanation 2 is supported by estimates of fresh plant remains entering the soil. Lukac et al. (2003) calculated the amount of C transferred into the soil via fine roots during the first rotation (POPFACE) as a result of fine root production and turnover. They estimated the C input for respectively P. alba, nigra and euramericana under ambient CO2to be: 124, 128 and 170 (g/m2); and under FACE
re-spectively: 189, 232 and 309 (g/m2). The actual amount of C entering the soil was thought to be higher because root res-piration and exudation was not accounted for. However, on average, under ambient CO2and FACE, 42% more C entered
the soil via fine roots under P. euramericana as compared to under alba and nigra. Hoosbeek et al. (2004) estimated the input of C into the soil with the C3/C4 stable isotope method during the second and third year. Again, most C entered the soil under P. euramericana, i.e. on average 16 and 15% more new C in respectively 2000 and 2001 as compared to P. alba and nigra. The observed larger C inputs and increase of small macro-aggregate and free micro-aggregate fractions under P.
euramericana are in agreement with the cycle of aggregate formation model. The larger input of fresh litter under P. eu-ramericana increased the number of sites for microbial
ac-tivity and the number of nucleation centers for aggregation. Enhanced microbial activity induced an increase of binding of organic matter and soil particles into macro-aggregates. More enclosed organic matter was decomposed and was sub-sequently associated with mineral particles. Increased asso-ciation resulted in increased formation of micro-aggregates and long term stabilization of soil organic matter.
As with the weight fractions, the free micro- and small macro-aggregate C fractions increased under P.
eurameri-cana, while the medium and large macro-aggregate C
frac-tions decreased. The medium and large macro-aggregate N fractions also decreased under P. euramericana. A species effect on the micro- and small macro-aggregate N fractions was probably obscured by the relatively high C/N ratio of the fresh plant material as compared to the lower C/N ratio of the older organic matter included in the macro-aggregates.
The absence of a N-fertilization effect suggests that N availability is not a limiting factor to the soil flora and fauna involved in processes related to aggregate formation. 4.2 Intra-macro-aggregate (iM) fractions
The isolated iM-micro-aggregate weight and C fractions were larger under FACE than under ambient CO2, although
not significantly (Table 5). This lack of significance may in part be due to the limited statistical power of the split-split-plot design with respect to the CO2 treatment. If we had
assumed the six soil samples per plot (CO2 treatment ring)
to be independent, then the iM-micro-aggregate C fraction would have been significantly (P=0.003) larger under FACE. This result may seem to contradict the fact that the macro-aggregate fractions, that harbored these iM-micro-macro-aggregate fractions, were not affected by FACE. However, the fractions remaining on the sieves after wet sieving represent aggregate fractions with a certain minimum aggregate stability. Sim-ilar weight fractions may still include aggregates with dif-ferent stabilities above a certain minimum. Although the macro-aggregate fractions were not affected by FACE, the average stability of the macro-aggregate fractions formed un-der FACE may have been higher. A higher stability causes a slower macro-aggregate turnover, which enhances the for-mation of iM-micro-aggregates inside (Six et al., 2000). So, after five years of treatment, FACE may have increased the formation of the iM-micro-aggregate C fraction probably due
to increased stability of macro-aggregates. Eventually, these iM-micro-aggregates may be released from the “nursery” and may increase the “free” micro-aggregate C fraction as fraction of the whole soil. Through this mechanism, FACE may increase the stabilization and protection of soil C in iM-micro-aggregates, and may eventually, as we expect, also in-crease the stabilization and protection of soil C in “released” micro-aggregates. However, as mentioned, this trend can not be confirmed with the statistical model that we used based on the split-split-plot design.
Another factor affecting the results of the iM-macro-aggregate fractions may have been the inclusion of small amounts of fine (53–250 micron) inter-micro-aggregate par-ticulate organic matter (POM) released through the disper-sion of macro-aggregates or unstable micro-aggregates. We assumed this POM material to be negligible as compared to the isolated iM-micro-aggregate fraction, especially on weight basis. But, the C and N contents may have been af-fected to some extent, implying that not all obtained C and N was truly protected.
4.3 Forest FACE experiments
Until recently, increased atmospheric CO2concentration was
reported to have no significant effect on soil C sequestration at forest FACE experiments (Houghton, 2003; Lichter et al., 2005; Norby et al., 2002; Schlesinger and Lichter, 2001). After six years of CO2enrichment at the Duke Forest FACE
experiment, Lichter et al. (2005) did not detect a significant FACE effects on soil C content. However, the C content of the mineral top soil (0–15 cm) averaged over the FACE and control rings significantly increased during the experi-ment due to regrowth. Physical fractionation suggested that this increase occurred entirely within the free light fraction in which SOM is not protected against decomposition. The iPOM and iM-micro-aggregate C fractions were not affected by FACE. Lichter et al. (2005) concluded that forest soils are unlikely to sequester significant additional quantities of at-mospheric C associated with CO2fertilization because of the
low rates of C input to refractory and protected SOM pools. Recently, Jastrow et al. (2005) raised the question whether the lack of a FACE effect on soil C content is a general re-sponse or a function of (1) the low statistical power of most experiments, and/or (2) the magnitude of CO2-stimulated C
inputs relative to the duration of the experiments. At the Oak Ridge deciduous forest FACE experiment, organic C in the surface 5 cm of the soil increased linearly during 5 years of CO2 enrichment, while C in the ambient plots
re-mained relatively constant (Jastrow et al., 2005). A signif-icant FACE effect on soil C was observed for the top 5 cm. Sampling of a thicker soil increment, e.g. 0–15 cm, would have “diluted” the increase of C which would have resulted in a non-significant effect. A meta-analysis of 35 indepen-dent experimental observations from a wide range of ecosys-tems showed that CO2enrichment increased soil C by 5.6%
486 M. R. Hoosbeek et al.: Effects of elevated CO2and species on soil C protection
(Jastrow et al., 2005). According to Jastrow et al. (2005), this result supports the generality of the observed increase of soil C under FACE at the Oak Ridge experiment.
At the EuroFACE site we also observed a significant larger increase in total soil C% after 5 years of CO2 enrichment
(Hoosbeek et al., 2006). Chemical fractionation revealed that this increase occurred within the labile soil C fraction. The question remained whether the observed larger increase of total soil C and the increase of labile soil C under FACE would eventually result in long-term C sequestration in stable organic matter fractions.
The results of physical fractionation presented in this study reveal that FACE did not affect the formation of aggregates. This lack of an effect may be due to the low statistical power of the split-split-plot design. We did, however, observe a trend of increased stabilization and protection of soil C in micro-aggregates formed within macro-aggregates under FACE. Moreover, the largest effect on aggregate formation was due to differences in species, i.e. poplar genotype. P.
eu-ramericana increased the formation of free micro-aggregates
which means that more newly incorporated soil C was stabi-lized and protected. The choice of species in a plantation, or the effect of global change on species diversity, may there-fore affect the stabilization and protection of C in soils.
Acknowledgements. We thank J. Marinissen for her advice and help with the wet sieving and sand fraction procedures. C. Cal-fapietra and colleagues are gratefully acknowledged for managing and maintaining the FACE facility. Funding was provided by the European Commission Fifth Framework Program, Environment and Climate RTD Program, research contract EVR1-CT- 2002-40027 (EUROFACE) and by the Centre of Excellence “Forest and Climate” of the Italian Ministry of University and Research (MIUR).
Edited by: Z. Cai
References
Baldock, J. A. and Skjemstad, J. O.: Role of the soil matrix and minerals in protecting natural organic materials against biologi-cal attack, Organic Geochem., 31, 697–710, 2000.
Calfapietra, C., Gielen, B., Galema, A. N. J., Lukac, M., De Angelis, P., Moscatelli, M. C., Ceulemans, R., and
Scarascia-Mugnozza, G.: Free-air CO2 enrichment (FACE) enhances
biomass production in a short-rotation poplar plantation, Tree Physiology, 23, 805–814, 2003.
Chenu, C. and Stotzky, G.: Interactions between microorganisms and soil particles: An overview, in: Interactions between mi-croorganisms and soil particles, edited by: Huang P. M., Bollag, J.-M., Senesi, N., John Wiley & Sons Ltd., 2002.
Davidson, E. A. and Janssens, I. A.: Temperature sensitivity of soil carbon decomposition and feedbacks to climate change, Nature, 440, 165–173, 2006.
Del Galdo, I., Six, J., Peressotti, A., and Cotrufo, M. F.: Assessing the impact of land-use change on soil C sequestration in
agricul-tural soils by means of organic matter fractionation and stable C isotopes, Global Change Biology, 9, 1204–1213, 2003.
DeLucia, E. H., Hamilton, J. G., Naidu, S. L., Thomas, R. B., An-drews, J. A., Finzi, A. C., Lavine, M., Matamala, R., Mohan, J. E., Hendrey, G. R., and Schlesinger, W. H.: Net primary
produc-tion of a forest ecosystem with experimental CO2enrichment,
Nature, 284, 1177–1179, 1999.
Elliott, E. T.: Aggregate structure and carbon, nitrogen, and phos-phorous in native and cultivated soils, Soil Sci. Soc. A. J., 50, 627–633, 1986.
Elliott, E. T., Palm, C. A., Reuss, D. E., and Monz, C. A.: Organic matter contained in soil aggregates from a tropical chronose-quence: Correction for sand and light fraction., Agric. Ecosyst. Environ., 34, 443–451, 1991.
FAO: Guidelines for soil description, Food and Agricultural Orga-nization of the United Nations, Rome, 1990.
Gielen, B., Calfapietra, C., Lukac, M., Wittig, V. E., De Angelis, P., Janssens, I. A., Moscatelli, M. C., Grego, S., Cotrufo, M. F., Godbold, D. L., Hoosbeek, M. R., Long, S. P., Miglietta, F., Polle, A., Bernacchi, C. J., Davey, P. A., Ceulemans, R., and Scarascia-Mugnozza, G. E.: Net carbon storage in a poplar
plan-tation (POPFACE) after three years of free-air CO2enrichment,
Tree Physiology, 25, 1399–1408, 2005.
Hamilton, J. G., DeLucia, E. H., George, K., Naidu, S. L., Finzi, A. C., and Schlesinger, W. H.: Forest carbon balance under elevated
CO2, Oecologia, 131, 250–260, 2002.
Hoosbeek, M. R., Li, Y., and Scarascia-Mugnozza, G.: Free
atmo-spheric CO2enrichment (FACE) increased labile and total
car-bon in the mineral soil of a short rotation Poplar plantation, Plant and Soil, 281, 247–254, 2006.
Hoosbeek, M. R., Lukac, M., Van Dam, D., Godbold, D. L., Velthorst, E. J., Biondi, F. A., Peressotti, A., Cotrufo, M. F., De Angelis, P., and Scarascia-Mugnozza, G.: More new carbon in the mineral soil of a poplar plantation un-der Free Air Carbon Enrichment (POPFACE): Cause of in-creased priming effect?, Global Biogeoch. Cycles, 18, GB1040, doi:1010.1029/2003GB002127, 2004.
Houghton, R. A.: The contemporary carbon cycle, in: Biogeochem-istry, edited by: Schlesinger W. H., Elsevier, 473–513, 2003. Houghton, R. A., Davidson, E. A., and Woodwell, G. M.: Missing
sinks, feedbacks, and understanding the role of terrestrial ecosys-tems in the global carbon balance, Global Biogeochem. Cycles, 12, 25–34, 1998.
Janssens, I. A., Freibauer, A., Ciais, P., Smith, P., Nabuurs, G. J., Folberth, G., Schlamadinger, B., Hutjes, R. W. A., Ceulemans, R., Schulze, E.-D., Valentini, R., and Dolman, A. J.: Europe’s terrestrial biosphere absorbs 7 to 12% of Europen anthropogenic
CO2emissions, Science, 300, 1538–1542, 2003.
Jastrow, J. D.: Soil aggregate formation and the accrual of particu-late and mineral-associated organic matter, Soil Biol. Biochem., 28, 665–676, 1996.
Jastrow, J. D., Miller, R. M., Matamala, R., Norby, R. J., Boutton, T. W., Rice, C. W., and Owensby, C. E.: Elevated atmospheric carbon dioxide increases soil carbon, Global Change Biol., 11, 2057–2064, 2005.
Kemper, W. D. and Rosenau, R. C.: Aggregate stability and size distribution, in: Methods of soil analysis. Part I. Physical and mineralogical methods, edited by: Klute A., 2nd ed, American Society of Agronomy Madison, WI 1986.
Krull, E. S., Baldock, J. A., and Skjemstad, J. O.: Importance of mechanisms and processes of the stabilisation of soil organic matter for modelling carbon turnover, Functional Plant Biology, 30, 207–222, 2003.
Liberloo, M., Calfapietra, C., Lukac, M., Godbold, D., Luo, Z. B., Polle, A., Hoosbeek, M. R., Kull, O., Marek, M., Raines, C., Taylor, G., Scarascia-Mugnozza, G., and Ceulemans, R.: Woody biomass production during the second rotation of a bio-energy Populus plantation increases in a future high CO2world, Global
Change Biol., 12, 1094–1106, 2006.
Lichter, J., Barron, S. H., Bevacqua, C. E., Finzi, A. C., Irving, K. F., Stemmler, E. A., and Schlesinger, W. H.: Soil carbon seques-tration and turnover in a pine forest after six years of atmospheric
CO2enrichment, Ecology, 86, 1835–1847, 2005.
Lukac, M., Calfapietra, C., and Godbold, D. L.: Production, turnover and mycorrhizal colonization of root systems of three Populus species grown under elevated CO2(POPFACE), Global
Change Biol., 9, 838–848, 2003.
Miglietta, F., Peressotti, A., Vaccari, F. P., Zaldei, A., De Angelis, P.,
and Scarascia-Mugnozza, G.: Free-air CO2enrichment (FACE)
of a poplar plantation: the POPFACE fumigation system, New Phytologist, 150, 465–476, 2001.
Norby, R. J., DeLucia, E. H., Gielen, B., Calfapietra, C., Giardina, C. P., King, J. S., Ledford, J., McCarthy, H. R., Moore, D. J. P., Ceulemans, R., De Angelis, P., Finzi, A. C., Karnosky, D. F., Ku-biske, M. E., Lukac, M., Pregitzer, K. S., Scarascia-Mugnozza, G., Schlesinger, W. H., and Oren, R.: Forest response to elevated
CO2is conserved across a broad range of productivity, Proc. Nat.
Acad. Sci. USA, 102, 18 052–18 056, 2005.
Norby, R. J., Hanson, P. J., O’Neill, E. G., Tschaplinski, T. J., Weltzin, J. F., Hansen, R. A., Cheng, W., Wullschleger, S. D., Gunderson, C. A., Edwards, N. T., and Johnson, D. W.: Net
primary productivity of a CO2-enriched deciduous forest and
the implications for carbon storage, Ecological Applications, 12, 1261–1266, 2002.
Oades, J. M.: Soil organic matter and structural stability: mecha-nisms and implications for management, Plant and Soil, 76, 319– 337, 1984.
Oades, J. M.: The role of biology in the formation, stabilization and degradation of soil structure, Geoderma, 56, 377–400, 1993. Prentice, I. C., Farquhar, G. D., Fasham, M. J. R., Goulden, M. L.,
Heimann, M., Jaramillo, V. J., Kheshgi, H. S., Le Quere, C., Sc-holes, R. J., and Wallace, D. W. R.: The carbon cycle and atmo-spheric carbon dioxide, in: Climate Change 2001: The scientific basis, IPCC, editor, Cambridge University Press, Cambridge and New York, 183–237, 2001.
Puget, P., Chenu, C., and Balesdent, J.: Total and yound organic matterdistributions in aggregates of silty cultivated soils, Euro-pean Journal of Soil Science, 46, 449–459, 1995.
Pulleman, M. M., Jongmans, A. G., Marinissen, J. C. Y., and Bouma, J.: Effects of organic versus conventional arable farming on soil structure and organic matter dynamics in a marine loam in the Netherlands, Soil Use and Management 19, 157–165, 2003. Scarascia-Mugnozza, G. E., Calfapietra, C., Ceulemans, R., Gielen,
B., Cotrufo, M. F., De Angelis, P., Godbold, D. L., Hoosbeek, M. R., Kull, O., Lukac, M., Marek, M., Miglietta, F., A., P., Raines, C., Sabatti, M., Anselmi, N., and Taylor, G.: Responses to
ele-vated [CO2] of a short rotation, multispecies poplar plantation:
the POPFACE/EUROFACE experiment, in: Managed
Ecosys-tems and CO2, edited by: N¨osberger J., Long, S. P., Norby, R.
J., Stitt, M., Hendrey, G. R., Blum, H., Springer Verlag, Berlin, Heidelberg, New York, 173–195, 2006.
Schlesinger, W. H. and Lichter, J.: Limited carbon storage in soil and litter of experimental forest plots under increased
atmo-spheric CO2, Nature, 411, 466–469, 2001.
Six, J., Callewaert, P., Lenders, S., De Gryze, S., Morris, S. J., Gre-gorich, E. G., Paul, E. A., and Paustian, K.: Measuring and un-derstanding carbon storage in afforested soils by physical frac-tionation, Soil Sci. Soc. A. J., 66, 1981–1987, 2002.
Six, J., Carpentier, A., Van Kessel, C., Merckx, R., Harris, D.,
Horwath, W. R., and L¨uscher, A.: Impact of elevated CO2on
soil organic matter dynamics as related to changes in aggregate turnover and residue quality, Plant and Soil, 234, 27–36, 2001. Six, J., Elliott, E.T., and Paustian, K.: Aggregate and soil organic
matter dynamics under conventional and no-tillage systems, Soil Sci. Soc. A. J., 63, 1350-1358, 1999.
Six, J., Elliott, E. T., and Paustian, K.: Soil macroaggregate turnover and microaggregate formation: A mechanism for C sequestration under no-tillage agriculture, Soil Biol. Biochem., 32, 2099–2103, 2000.
Six, J., Elliott, E. T., Paustian, K., and Doran, J. W.: Aggrega-tion and soil organic matter accumulaAggrega-tion in cultivated and native grassland soils, Soil Sci. Soc. Am. J., 62, 1367–1377, 1998. Tisdall, J. M. and Oades, J. M.: Organic matter and water-stable
aggregates in soils, J. Soil Sci., 33, 141–163, 1982.
Van Doesburg, J. D. J.: Particle-size analysis and mineralogical analysis, in: Manual for soil and water analysis, edited by: Bu-urman P., Van Lagen, B., Velthorst, E. J., Backhuys Publishers, Leiden, The Netherlands, 1996.
Van Lagen, B.: Soil Analyses, in: Manual for soil and water anal-yses, edited by: Buurman P., Van Lagen, B., Velthorst, E. J., Backhuys Publishers, Leiden, The Netherlands, 1996.
Van Veen, J. A. and Kuikman, P. J.: Soil structural aspects of de-composition of organic matter, Biogeochemistry, 11, 213–233, 1990.