RESEARCH PAPER
Phenotyping of CYP450 in human liver microsomes using
the cocktail approach
Dany Spaggiari&Laurent Geiser&Youssef Daali&
Serge Rudaz
Received: 28 February 2014 / Revised: 7 May 2014 / Accepted: 19 May 2014 / Published online: 4 June 2014 # Springer-Verlag Berlin Heidelberg 2014
Abstract The cocktail approach is an advantageous strategy used to monitor the activities of several cytochromes P450 (CYPs) in a single test to increase the throughput of in vitro phenotyping studies. In this study, a cocktail mixture was developed with eight CYP-specific probe substrates to simul-taneously evaluate the activity of the most important CYPs, namely, CYP1A2, CYP2A6, CYP2B6, CYP2C9, CYP2C19, CYP2D6, CYP2E1, and the CYP3A subfamily. After cocktail incubation in the presence of human liver microsomes (HLMs), the eight selected substrates and their specific me-tabolites were analyzed by ultra-high-pressure liquid chroma-tography and electrospray ionization quadrupole time-of-flight mass spectrometry. Qualitative and quantitative data were simultaneously acquired to produce an overview of the extended phase I biotransformation routes for each probe substrate in the HLMs and to generate phenotypic profiles of various HLMs. A comparison of the cocktail strategy with an individual substrate assay for each CYP produced similar results. Moreover, the cocktail was tested on HLMs with different allelic variants and/or in the presence of selective inhibitors. The results were in agreement with the genetic polymorphisms of the CYPs and the expected effect of the alterations. All of these experiments confirmed the reliability of this cocktail assay for phenotyping of the microsomal CYPs.
Keywords Cocktail approach . Ultra-high-pressure liquid chromatography–quadrupole time-of-flight mass
spectrometry . Cytochrome P450 profile . Phenotyping . Genetic polymorphism . Human liver microsomes
Introduction
Cytochromes P450 (CYPs) are the major phase I metabolic enzymes involved in the biotransformation of xenobiotics and endogenous compounds [1]. The activity of CYPs is character-ized by a high interindividual variability due to environmental factors (e.g., diet, drug therapy, toxic substances) and/or genetic polymorphisms, which are part of the individual CYP pheno-type. Certain major isoforms of the CYP superfamily involved in the metabolism of marketed drugs—CYP2C9, CYP2C19, and CYP2D6—are recognized as highly polymorphic. Accord-ing to the type of allelic variant affectAccord-ing these CYPs, genetic polymorphism can significantly alter their metabolic activity, thus modifying the clinical response and/or increasing the risk of drug–drug interactions (DDI). The evaluation of genetic polymorphism can be performed by sequencing the DNA of the CYP genes (genotyping) or by determining the CYP expression/activity (phenotyping). In certain cases, owing to the genetic and epigenetic regulations, the relationship between the CYP gene and the enzymatic activity is not trivial, which makes the test selection (e.g., constitutional or functional) for predicting the drug’s clinical response difficult. However, the evaluation of the DDI is possible only by CYP phenotyping [2]. Currently, in vitro phenotyping of CYPs has been success-fully used to enhance the background understanding of the behavior of polymorphic CYPs involved in xenobiotic metab-olism and DDI. For this purpose, human liver microsomes (HLMs) are typically used as the in vitro native phase I enzyme source for metabolism studies owing to their simple prepara-tion and ease of handling and the commercial availability of D. Spaggiari
:
L. Geiser:
Y. Daali:
S. Rudaz (*)School of Pharmaceutical Sciences, University of Geneva, University of Lausanne, Boulevard d’Yvoy 20, 1211 Geneva 4, Switzerland
e-mail: [email protected] Y. Daali
Division of Clinical Pharmacology and Toxicology, Geneva University Hospitals, Rue Gabrielle-Perret-Gentil 4, 1211 Geneva 14, Switzerland
numerous allelic variants. New strategies for performing in vitro metabolism studies have been developed recently with a particu-lar focus on inexpensive automation and reduction of reagent
consumption [3,4]. High-throughput strategies for microsomal
CYP investigations based on liquid chromatography (LC)–mass spectrometry (MS) have been developed with regard to its pow-erful separation capabilities, including high sensitivity, selectivity,
and resolution [5,6]. Among these strategies, the cocktail
ap-proach has been developed recently to efficiently and rapidly monitor the activities of several CYPs within a single test. In this study, selective CYP substrates, called probes, are incubated with microsomes, consecutively reducing the time and assay costs. Several in vitro cocktail approaches have been reported in the literature with various numbers of probe substrates and analytical strategies. The current status of cocktail approaches and methods to investigate CYP activities in HLMs has been reviewed recently [7]. In the context of phenotyping of CYPs, the use of a high-resolution device, such as a quadrupole time-of-flight (QTOF) mass spectrometer, is appealing considering that one CYP is often involved in the formation of numerous metabolites. With this type of instrumentation, untargeted acquisition provides an extended phenotypic profile of the CYPs. Hence, the substrates and their expected and unexpected metabolites are sensitively and accu-rately detected and identified within a single run. An additional advantage of this instrumentation is that data can be handled, processed, and filtered after the acquisition with specific commer-cially available software for untargeted metabolite detection and/ or identification. Therefore, the QTOF instrument could present several benefits for in vitro CYP phenotyping investigations.
In this study, a cocktail assay was originally designed for the phenotyping of the most important CYPs in humans, namely, CYP1A2, CYP2A6, CYP2B6, CYP2C9, CYP2C19, CYP2D6,
CYP2E1, and the CYP3A subfamily. An LC–MSE
method using generic gradient conditions was developed on an ultra-high-pressure LC (UHPLC)–QTOF platform for the reliable quantita-tive and qualitaquantita-tive analysis of this cocktail metabolization. The CYP activity assessment was based on the metabolic ratio. A radar plot representation of the CYP phenotypic profile was proposed for a better comparison of the different assays and the various phenotypes determined. A comparison was made be-tween the cocktail approach and classic tests, which perform individual incubations of the substrates. The latter was then evaluated for the CYP phenotyping of allelic variant HLMs. An altered allelic variant HLM was finally evaluated by addition of CYP-specific inhibitors and human recombinant enzymes.
Materials and methods
Chemicals, reagents, test compounds, and other materials Methanol (MeOH), acetonitrile (ACN), and water of ultra LC– MS grade were purchased from Biosolve (Valkenswaard,
Netherlands). Formic acid (98–100 %) was obtained from Merck (Darmstadt, Germany). Chlorzoxazone (98 %),
6-hydroxychlorzoxazone (97 %), (±)-4′-hydroxymephenytoin
(98 %), 4′-hydroxyflurbiprofen (98 %), and hydroxybupropion (95 %) were purchased from Toronto Research Chemicals (Tor on t o O N , C a na d a ) . P ot as s i u m h yd (Tor ox i de , 4 ( 2 -hydroxyethyl)piperazine-1-ethanesulfonic acid sodium salt (HEPES) (99.5 %), dextromethorphan hydrobromide (99 %), dextrorphan tartrate (98 %), bupropion hydrochloride (98 %), phenacetin (97 %), acetaminophen (99 %), flurbiprofen (99 %), coumarin (99 %), 7-hydroxycoumarin (99 %), ketoconazole (98 %), and anhydrous quinidine (98 %) were obtained from Sigma-Aldrich (Buchs, Switzerland), whereas methanolic stock solutions of midazolam and 1-hydroxymidazolam were pur-chased from Lipomed (Arlesheim, Switzerland). (S)-Mephenytoin (99 %) was obtained from Enzo Life Sciences
(Lausen, Switzerland), reducedβ-nicotinamide adenine
dinucle-otide 2′-phosphate tetrasodium salt (NADPH) (96 %) was obtain-ed from Applichem (Darmstadt, Germany), and leucine-enkephalin was obtained from Bachem (Bubendorf, Switzerland). Pooled HLMs from 30 donors (i.e., reference HLMs) and HLMs with allelic variants (CYP2D6*4/*4, CYP2C9*3/*3, and CYP2C19*2/*2) from single donors (HH35, HH519, and HH689, respectively) were purchased from BD Biosciences (Allschwil, Switzerland). Human CYP Baculosomes reagent (baculosome CYP2D6) was obtained from Invitrogen (Basel, Switzerland). Aliquots of HLMs and baculosome CYP2D6 were
stored at−80 °C. A 50 mM NADPH stock solution was prepared
in water and stored at −20 °C. Immediately before the
CYP-dependent metabolism assays, intermediate concentrations of the HLMs and baculosome CYP2D6 were prepared by diluting aliquots with the 50 mM HEPES (pH 7.4) buffer solution, which was prepared by dissolving the required amount of HEPES in water. The pH was adjusted to 7.4 with potassium hydroxide using a SevenMulti S40 pH meter (Mettler Toledo, Greifensee, Switzerland). The substrate, metabolite, and inhibitor stock
solu-tions at 1 mg/mL were prepared in MeOH and stored at−20 °C
for 6 months or less. Intermediate solutions were appropriately reconstituted daily in the 50 mM HEPES (pH 7.4) buffer solution. Characterization of CYP-dependent metabolism in HLMs Incubation method
All of the microsomal incubations were performed in
dupli-cate in a final incubation volume of 100 μL. The reaction
medium contained 50 mM HEPES (pH 7.4), excess NADPH, 0.5 mg protein per milliliter of HLMs, and an individual CYP probe substrate or a cocktail of substrates. The final substrate concentrations were obtained by adding the required volume of the intermediate substrate or cocktail solution to the
reac-tion medium. These concentrareac-tions were as follows: 50μM
5μM for flurbiprofen, 100 μM for (S)-mephenytoin, 5 μM for
dextromethorphan, 40μM for chlorzoxazone, and 2.5 μM for
midazolam. The final organic solvent (MeOH) concentration was 0.5 % (v/v). After preincubation for 3 min at 37 °C, the CYP-dependent phase I reactions were initiated by adding excess NADPH (2.0 mM). The incubation proceeded for 20 min at 37 °C under agitation (400 rpm). The enzymatic
reaction was stopped by adding 100μL of ice-cold ACN to
the reaction medium. The precipitated proteins were removed by centrifugation (5 min at 10,000 rpm), and an aliquot
(150μL) of the resulting supernatant was transferred to a vial
for LC–MS analysis.
Well-characterized CYP competitive inhibitors, such as quinidine (CYP2D6) and ketoconazole (CYP3A), were added
at a single concentration of 1 μM, whereas baculosome
CYP2D6 was tested at 3 nM. Each reagent was incubated in duplicate with the cocktail of substrates and the allelic variant CYP2D6*4/*4 HLMs under the previously described incuba-tion condiincuba-tions.
Data treatment
Prism version 5.01 (GraphPad Software, San Diego, CA, USA) was used to determine the most appropriate fitting model for the depletion of the eight substrates (one phase decay) and the formation of the eight metabolites (one site total).
Liquid chromatography–mass spectrometry UHPLC–QTOF instrumentation
The chromatographic analyses were performed with an Acquity UPLC system (Waters, Milford, MA, USA) able to deliver mobile phases at a pressure of up to 1,000 bar. The equipment includes a binary solvent manager with a maxi-mum delivery flow rate of 2 mL/min, an autosampler with a 2-μL loop operating in full-loop injection mode, and a column manager composed of a precolumn eluent heater and a column oven set to 40 °C. The UPLC system was coupled in an optimized configuration with a Xevo® QTOF mass spectrom-eter (Waters, Milford, MA, USA) fitted with a Z-spray electrospray ionization (ESI) source [8]. The samples were stored at 4 °C in the autosampler prior to and during the analysis. Data acquisition, data handling, and instrument con-trol were performed by MassLynx version 4.1 (Waters, Mil-ford, MA, USA).
Reversed-phase LC conditions
The reversed-phase LC separations were performed on a
Waters 100 mm×2.1 mm XBridgeTMBEH C18XP column
with 2.5-μm particle size and a flow rate of 400 μL/min in
gradient mode (solvent A, water with 0.1 % formic acid; solvent B, ACN with 0.1 % formic acid, 2–75 % solvent B in 15 min, up to 95 % solvent B in 0.2 min, held at 95 % solvent B to 0.5 min, then column reconditioning at 2 % solvent B to 18 min), with the eluate from the first 0.5 min diverted to waste.
ESI-QTOF-MSEparameters
Regarding the MS operating conditions, the desolvation gas (nitrogen) flow was set to 1,000 L/h with a tem-perature of 500 °C, the source temtem-perature was 150 °C, the cone gas (nitrogen) flow rate was 20 L/h, the collision gas (argon) flow rate was 0.2 mL/min, and the capillary voltage was 3.0 kV in the positive mode and 2.4 kV in the negative mode. The cone voltage and the extraction cone voltage were similar in both positive and negative mode at 30 V and 4.1 V, respectively. The microchannel plates were operated at 2,200 V in posi-tive mode and at 1,750 V in negaposi-tive mode, with a 4-GHz time-to-digital converter. The QTOF-MS system was operated in wide-pass quadrupole mode with a low collision energy set to 4 eV to acquire MS infor-mation in the first function, and a collision energy ramp from 20 to 35 eV was applied in the second function
(MSE mode). The data were collected in the V-optics
centroid mode over an m/z range of 100–1,000 for both functions with an accumulation time of 0.2 s. The data were acquired using programmed dynamic range en-hancement (pDRE) technology and an independent ref-erence lock-mass ion infused through the LockSpray™ interface to ensure accuracy and to decrease acquisition variability. A solution of leucine-enkephalin (m/z
556.2771) at a concentration of 0.2 μg/mL in 1:1
(v/v) ACN/water plus 0.1 % formic acid was used as the reference compound and was infused at a flow rate
of 10 μL/min. The LockSpray frequency was set to
20 s (scan duration of 1 s) and the data were averaged over five spectra.
Quantitative evaluation of the method Selectivity
Method selectivity was assessed by injecting (1) HEPES buffer, (2) the analyte and cofactor in HEPES buffer, (3) a blank microsomal incubation medium with the cofactor, (4) the analyte in blank microsomal incubation medium without the cofactor, and (5) a mixture of analytes in microsomal incubation medium without the cofactor. Extracted ion chro-matograms for each analyte were used to assess potential interference at the corresponding retention time.
Response function linearity
The response function for the eight substrates and their me-tabolites (N=16) was evaluated using microsomal incubation mixtures (without cofactor) reconstituted at concentrations ranging from 1 to 5,000 ng/mL. To evaluate the response function of each specific transition, each analyte in ten con-centrations (k=10) injected in triplicate was investigated. A conventional least-squares linear regression without weighting was fitted to the data obtained, and the response function range was evaluated with a determination coefficient
(R2) higher than 0.95.
Limit of detection and lower limit of quantification
The limit of detection and the lower limit of quantification were measured in reconstituted incubation samples as the concentrations possessing a response with a signal-to-noise ratio greater than or equal to 3 and 10, respectively.
Matrix effect
The matrix effect was determined according to method de-scribed by Matuszeski et al. [9]. Briefly, the signal intensity of the sample including the mixture of eight substrates and their metabolites added at three different concentrations (low, 50 ppb; medium, 200 ppb; high, 500 ppb) to reconstituted incubation mixture was compared with that of the standard mixture solution.
Precision and stability
The precision of the analytical method was measured by triplicate injection of reconstituted microsomal mixtures of substrates and metabolites on different analysis days. The eight substrate and metabolite pairs were evaluated at half concentration of the substrate during incubation. The relative standard deviation obtained on the absolute peak area and the quadratic mean (or root mean square) were used for assess-ment of within-day and between-day variabilities, respective-ly. The stability of the overall bioanalytical process was eval-uated by testing different aliquots of pooled HLMs on differ-ent days.
Results and discussion
Selection of substrates and evaluation of the reaction conditions
The eight CYP probe substrates of the cocktail, namely, phenacetin (CYP1A2), coumarin (CYP2A6), bupropion
(CYP2B6), flurbiprofen (CYP2C9), (S)-mephenytoin (CYP2C19), dextromethorphan (CYP2D6), chlorzoxazone (CYP2E1), and midazolam (CYP3A subfamily), were select-ed to monitor simultaneously the metabolic activities of clin-ically and toxicologclin-ically relevant cytochromes in humans. In preliminary experiments, several well-characterized probes were tested for an optimal cocktail assay. These eight com-pounds were finally selected according to the following: (1) in vitro recommendations based on the specificity of the CYP probe reaction (e.g., coumarin, bupropion, dextromethorphan, chlorzoxazone, and midazolam) [10], (2) in vivo and in vitro considerations (e.g., flurbiprofen), and (3) analytical and met-abolic issues. Phenacetin for example, was preferred over caffeine owing to its higher microsomal metabolic rate at a low concentration, (S)-mephenytoin was retained for the CYP2C19 activity assessment because omeprazole was found to be degraded in acidic solution, and flurbiprofen was retained over the commoner CYP2C9 in vitro probes, such as diclofenac and tolbutamide, owing to its presence in a well-known cocktail currently used in vivo in the clinical
environ-ment [11,12]. Although certain authors have proposed a
two-site binding model for CYP3A activity and have recommend-ed the use of two structurally unrelatrecommend-ed probes [10], only midazolam was included according to recent studies demon-strating the evaluation of the in vitro CYP3A subfamily ac-tivity, which was independent of the type and number of
substrates [13,14].
The adjustment of the experimental conditions for the cocktail, especially the incubation time and protein concen-tration, was performed with the reference HLMs (pooled). These incubation parameters were adjusted according to prac-tical recommendations for the following reasons: (1) to avoid excessive substrate depletion (less than 20 %) and (2) to maintain a linear relationship between the amount of enzyme
or the incubation time and product formation [15,16]. These
adjustments are challenging because the concentrations of the individual CYPs in HLMs cannot be increased or decreased separately because a constant ratio is maintained among the different isoenzymes. When the reaction adjustment is based on CYPs with low abundance in HLMs (e.g., CYP1A2, CYP2C19, and CYP2D6), a higher protein concentration is required to generate a detectable amount of the metabolite, but this produces higher concentrations of the high-abundance CYPs (e.g., CYP3A4 and CYP2C9), which negatively influ-ence the kinetics from a linear to a nonlinear behavior. An additional issue of higher microsomal protein concentrations concerns the nonspecific binding to proteins and lipids (matrix material) that can affect the reliability of the data [17]. In this study, the reaction conditions, including the enzyme protein concentration of 0.5 mg/mL and the incubation time of 20 min, were finally selected relative to the probe substrate that presents the slowest turnover, (S)-mephenytoin (CYP2C19). It has been shown elsewhere that the latter
requires a longer incubation and a higher protein concentra-tion to generate sufficient metabolite for detecconcentra-tion [18]. As
depicted in Fig.1, under these experimental conditions, the
in vitro recommendations were followed. As expected, sub-strates (e.g., midazolam and coumarin) with a rapid turnover
and low Michaelis–Menten constants (Km) were highly
de-pleted, and their major metabolites were primarily formed after 20 min. This incubation time exceeded the optimal incubation time (15 min or less) to maintain the linearity of 1′-hydroxymidazolam and 7-hydroxycoumarin production [19,20]. Linear metabolite formation and low substrate dis-appearance were followed for the other CYPs monitored. Finally, these kinetic conditions were considered as acceptable because the linear metabolite formation was followed for the most of the CYPs, including the highly polymorphic CYPs (CYP2C9, CYP2C19, and CYP2D6).
The concentrations of seven of the eight substrates were set
near or below their respective Km values (Table 1) for the
following reasons: (1) to maintain the high specificity of the probe reaction, (2) to avoid or reduce potential interactions among the substrates of the cocktail, and (3) to minimize the percentage of organic solvent generally used for better sub-strate solubility but that could significantly modify the
CYP-mediated metabolism [22]. Only the slow turnover probe
(S)-mephenytoin required its inclusion in the cocktail at a
con-centration higher than its Kmto detect its metabolite.
Prelim-inary probe–probe interaction experiments showed that bupropion (probe substrate for CYP2B6) interfered with the
activity of several CYPs, in particular that of CYP2C19. Therefore, the concentration of bupropion was decreased to less than 1/15 of the initial value. Hence, the observed inter-action between this substrate and this isoform was reduced [a
s l i g h t i n c r e a s e o f C Y P 2 C 1 9 - m e d i a t e d ( ± ) - 4
′-hydroxymephenytoin production], as reported elsewhere [20].
LC–MSE
method
Considering the heterogeneous physicochemical properties of the analytes studied, a generic gradient-based analytical reversed-phase LC method was used to monitor the activities of the eight CYP450 isoforms. With the cocktail developed, the eight CYP probe substrates and their metabolites were simultaneously analyzed in microsomal incubations, and are
listed in Table1along with the exact mass (m/z) and polarity
of the ESI used for the detection. The initial experiments were performed to evaluate and optimize the ESI-MS response by using both the positive mode and the negative mode and by varying the cone voltages (fixed or ramped). Most of the compounds showed good sensitivity in positive ionization mode, except for chlorzoxazone/6-hydroxychlorzoxazone and flurbiprofen/4′-hydroxyflurbiprofen, with sensitivities that were significantly better in negative ionization mode. In terms of absolute sensitivity (i.e., ion counts), the optimal cone voltage was 30 V, regardless of the polarity chosen. As
depicted in Fig.2, by use of a generic gradient LC separation,
all of the analytes were eluted with retention times ranging
0 20 40 60 80 100 120 0 20 40 60 80 100 120 phenacetin coumarin bupropion flurbiprofen (S)-mephenytoin dextromethorphan chlorzoxazone midazolam
Incubation time [min]
Substrate depletion [%] 0 20 40 60 80 100 120 0 20 40 60 80 100 120 acetaminophen 7-hydroxycoumarin hydroxybupropion 4'-hydroxyflurbiprofen ( dextrorphan 6-hydroxychlorzoxazone 1'-hydroxymidazolam
Incubation time [min]
Metabolite Formation [%] (CYP1A2) (CYP2A6) (CYP2B6) (CYP2C9) (CYP2C19) (CYP2D6) (CYP2E1) (CYP3A) ) -4'-hydroxymephenytoin Fig. 1 Depletion of probe
substrates and formation of cytochrome P450 (CYP)-specific metabolites in human liver microsomes (HLMs) at 0.5 mg protein per milliliter as a function of time. Substrate depletion is expressed as a percentage of the amount of substrate at t=0 min, and metabolite formation is expressed as a percentage of the amount of metabolite at t= 120 min
from 2 to 10.5 min and were separated using the accurate mass feature of the mass spectrometer (±0.02 Da, first function MS). With use of the selected gradient, the substrate/ metabolite ion suppression effects were avoided because each substrate was eluted after its respective metabolites. Low chromatographic selectivity between midazolam and its me-tabolite, 1′-hydroxymidazolam, was observed, along with cer-tain critical selectivity windows for (S)-mephenytoin/dextro-methorphan, phenacetin/coumarin/bupropion, and 7-hydroxycoumarin/dextrorphan. However, because of the MS dimensions, an overall resolution was obtained. To extract the maximum information from the microsomal metabolism, a multiresidue method that allows both quantitative and
quali-tative (MSE) analysis was considered. Compared with a
clas-sic time-of-flight MS acquisition, this detection mode consisted of a first function (quantitative data) obtained in the wide-pass quadrupole mode at a low fixed collision energy (4 eV) and an alternated second function (qualitative data) with a collision energy ramping from 20 to 35 eV. Combining the MS/MS spectra obtained and postprocessing of the data with automated software, one can reveal the complementary metabolites that can potentially be formed.
Furthermore, in metabolism studies performed with the cocktail substrates, the analytes are present in the incubation sample over a wide range of concentrations. To overcome this highly dynamic concentration range issue, which could lead to incorrect exact mass measurements owing to the saturation of
the time-to-digital converter detector, a special feature, pDRE, should be activated. In this case, an unattenuated and an attenuated accumulation time are combined within the run to generate a stitched data point where the measured mass could
be considered as exact. The combination of MSEand pDRE
significantly decreased the effective data acquisition rate of the time-of-flight MS analyzer. With an accumulation time of 0.2 s (5 Hz, excluding the interscan delay), the effective acquisition rate corresponded to approximately 0.8 s (1.25 Hz). This value is not compatible with the very thin peaks obtained with the narrow-bore column packed with sub-2-μm particles. Considering the effective acquisition rate, sufficient data acquisition points (three points for each func-tion) to achieve good quantitative data and MS data of suffi-cient quality for reprocessing could not be obtained under the optimal UHPLC conditions (0.04 min at 4.4 % of the peak
height at 600μL/min). To address this constraint, a 100-mm
column packed with larger particles (2.5μm) was used instead
of a shorter column (50 mm) packed with smaller particles (1.7-μm particle inner diameter). With use of this configura-tion, the following advantages were obtained: (1) the peak width adapted to the data acquisition rate (0.11 min at 4.4 % of
the peak height at 400 μL/min), (2) equivalent
chromato-graphic performance (equivalent column length to particle size ratio), (3) reduced extra-column broadening (higher col-umn variance), (4) reduced backpressure (380 bar, which corresponds to a decrease of approximately 40 %), and (5) Table 1 The eight substrates selected for the cocktail approach, with their cytochrome P450 (CYP)-specific metabolites and exact detection mass CYP isoform Probe substrate CYP-specific
reaction CYP-specific metabolite Kma (μM) Concentration for incubation (μM) Exact mass (m/z) Polarity
1A2 Phenacetin O-Deethylation 1.7-152 50 180.1024 ES+
Acetaminophen 152.0675 ES+
2A6 Coumarin 7-Hydroxylation 0.3-2.3 2 147.0446 ES+
7-Hydroxycoumarin 163.0395 ES+
2B6 Bupropion Hydroxylation 67-168 5 240.1155 ES+
Hydroxybupropion 238.0998 (−H2O) ES+
2C9 Flurbiprofen 4′-Hydroxylation 6-42 5 199.0923 (−COO) ES−
4′-Hydroxyflurbiprofen 215.0875 (−COO) ES−
2C19 (S)-Mephenytoin 4′-Hydroxylation 13-35 100 219.1134 ES+
(±)-4′-Hydroxymephenytoin 235.1083 ES+
2D6 Dextromethorphan O-Demethylation 0.4-8.5 5 272.2014 ES+
Dextrorphan 258.1858 ES+
2E1 Chlorzoxazone 6-Hydroxylation 39-157 40 167.9852 ES−
6-Hydroxychlorzoxazone 183.9801 ES−
3A subfamily Midazolam 1′-Hydroxylation 1-14 2.5 326.0860 ES+
1′-Hydroxymidazolam 342.0809 ES+
ES electrospray aFrom [21]
reduced flow rate (400μL/min vs 600 μL/min). Compared with the UHPLC conditions, the analysis time was increased by a factor of 3, but the required sensitivity and an acceptable
number of data points (at least seven at 4.4 % of the peak height) were obtained for correct peak shape generation with
both the MS function and the MSEfunction.
Fig. 2 Extracted ion chromatograms [of the first function mass spec-trometry (MS), ±0.02 Da] of substrates and their CYP-specific metabo-lites corresponding to the analysis of the cocktail microsomal incubation
(20 min). The peak highlighted with a cross results from an in-source MS fragmentation (thermal degradation) of phenacetin in conditions used for the analysis. ES electrospray, RT retention time, TOF time of flight
Quantitative evaluation of the method
The selectivity of the LC–MSE method was confirmed by
injecting a series of blank samples as described in detail in “Selectivity.” The extracted ion chromatograms (±0.02 Da) for each analyte showed no major interferences at the corre-sponding retention time. Response functions were considered
as linear (R2>0.95) over concentrations ranging from the
measured lower limit of quantification to 2,000 ng/mL, and the method provided the desired sensitivity for each analyte.
As shown in Table2, the response signal (peak area) of
some compounds was evaluated at three concentrations (low, medium, and high) and was slightly affected (more than 25 %) by the matrix effect, particularly for the compounds with the shortest retention times. However, this effect was corrected by the use of the metabolic ratio as the analytical response. The metabolic ratio, representing the CYP-specific metabolite to probe substrate ratio, has often been used as a parameter for in vivo and in vitro characterization of the activities of CYPs instead of exclusive monitoring of the CYP probe metabolite formation [23]. When the CYP-specific biotransformation is a major pathway of the probe substrate, the metabolite and substrate peak areas are closely correlated, and the metabolic ratio will reflect the alteration of the isoform activity (e.g., the presence of a genetic mutation).
The method precision of the LC–MSE
method was then estimated by triplicate injection of reconstituted mixtures of substrates and metabolites on numerous analysis days, and the variability obtained on the absolute peak area for each analyte and for the CYP-specific metabolite to the probe substrate area
ratio are reported in Table2. Considering the analytes
indi-vidually, the root mean square of the within-day variabilities of the values presented ranges from 8.3 to 28.8 %. The analytical variability was improved (within ±20 %) for all the substrate and metabolite pairs using the absolute peak area ratio, reducing the between-day variabilities to between 4.0 and 14.5 %.
Variability of the microsomal incubation method for as-sessment of the CYP activities was then estimated on numer-ous days by separately incubating different aliquots of the pooled HLMs with the cocktail (freeze–thaw cycles). The metabolic variability of the incubation method for the eight CYP-specific probe substrates in pooled HLMs was within a tolerance fixed at ±20 %. No significant batch or day effects were observed on the activities of the CYPs, except for CYP2D6 (day effect) and CYP3A (batch effect), whose var-iability was less than 30 %. Considering these results, the overall method showed the ability to generate reliable data for estimation of the relative activities of the CYPs. It has to be noted that in the case of a minor pathway, the metabolic ratio is not sufficiently sensitive to reflect the activity of the mon-itored CYP owing to the strong effect of substrate depletion performed by other CYPs. Because the CYP-specific
biotransformations of the probe substrates selected for this cocktail were major pathways, the metabolic ratio was an appropriate value representing assessment of the in vitro ac-tivities of the CYPs without absolute quantification of the probe metabolites.
Comparison between the single-substrate and cocktail approaches
To evaluate the potential interactions among the probes of the cocktail, the CYP activities were compared using the meta-bolic ratios obtained for the pooled HLMs, with the individual substrates and the cocktail. For the latter, the presence of multiple probes and metabolites in the incubation sample could affect the activities of the CYPs and give an unrealistic impression of the phase I metabolic capacity of the HLMs. Considering that this type of HLM is a mixture of microsomes prepared from several donors with normal CYP phenotypic profiles, pooled HLMs possess the status of an average pa-tient. The CYP phenotypic profiles obtained with the cocktail
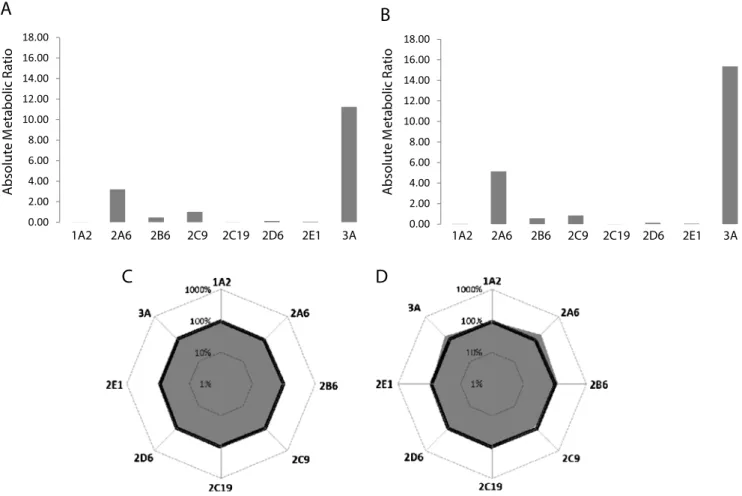
approach and the classic approach are reported in Fig.3a and
b, respectively. The measured ratios were over a range of four orders of magnitude, and only the CYPs with high enzymatic turnover (e.g., CYP2A6 and CYP3A) could be evidenced. For clarity, the activities of the CYPs obtained using the cocktail approach were considered as reference values (e.g., 100 % of phase I activity). This reference profile could be represented
on an octagonal radar plot (Fig. 3c) in which each axis
corresponds to the relative activity of the CYP. The logarith-mic scale affords equivalent visual variations in cases of increasing and respective decreasing activities of the CYPs. For example, an activity increased by a factor of 2 (i.e., 200 %) presents the same variation as that reduced by a factor of 2
(i.e., 50 %). When the two profiles are overlapped (Fig.3d),
no significant differences are observed. The activities of all of the CYPs were similar within 20 %, except for CYP2A6 and CYP3A. The CYP2A6 activity was decreased by approxi-mately 38 % in the cocktail assay, whereas the CYP3A activ-ity was decreased by approximately 27 %, with both isoforms generating lower metabolic ratios. For these isoforms, certain interactions caused by the cocktail approach have been sug-gested in the literature, which were not clearly identified [20, 24–26]. Although certain CYP activities decreased owing to the inhibitory effect, the cocktail assay allowed the acquisition of similar information in a single experiment about the CYP phenotypic profile as the classic approach but using a smaller amount of microsomes and proceeding eight times faster. Determination and alteration of the CYP phenotypic profile of allelic variant HLMs
The microsomal activities of the eight CYPs of allelic variants CYP2C9*3/*3, CYP2C19*2/*2, and CYP2D6*4/*4 from
Ta b le 2 Q u ant ita tive evalu ati o n o f the liquid chromatography –MS E method for the cocktail approach CY P is oform S ubstr ate , me tab o lite , m eta bolic ra ti o (pea k ar ea ra tio ) Respons e function (LLOQ to 2 ,000 ng/mL) R 2 LO D (ng/mL) LL OQ (ng/mL) Ma tri x ef fe ct (% ) (k = 3 ) P recision, RS D (%) (k =3 ) Low conc entr ati o n Medium conc entr ati o n High conc entr ati o n W it h in-d ay Be twe en-day 1234567 1A2 P henacetin 0 .9886 <1 1 9 2 1 1 1 9 0 1 5 .8 8.3 4 .2 15.1 1 1.2 20.8 6 .0 12.9 Acetaminophen 0 .9802 <1 5 7 7 6 5 5 0 1 6.3 9 .4 7.5 1 1.4 8 .8 13.0 9 .1 1 1 .1 Acetaminophen /phenace tin 8 1 5 9 5 5 3.0 0 .6 5.9 7 .0 3.5 10.9 3 .2 5.8 2A6 C oumarin 0.9716 2 5 8 5 9 8 8 0 1 8.3 13.0 7 .9 13.1 13.3 22.0 6 .7 14.4 7-Hydroxycoumarin 0.9823 2 5 8 4 8 9 8 0 1 4. 1 9 .7 1.2 14.3 12.8 25.0 9 .6 14.0 7-Hydroxycoumarin/coumarin 9 7 9 2 1 0 2 9 .5 3.7 6 .7 2.2 6 .4 5.6 4 .4 5.9 2B6 B upropion 0.9873 2 5 8 5 1 05 8 7 2 2 .8 1 1 .8 3.3 15.3 6 .7 18.9 7 .0 13.9 Hy droxybupropion 0.9853 <1 1 9 1 9 6 9 8 2 4.4 14.1 4 .6 6.0 1 1.6 10.7 6 .9 12.8 Hy droxybupropion/buprop ion 1 05 9 0 1 0 8 3 .6 1.4 2 .3 1 1 .5 1 1 .5 9.1 0 .7 7.3 2C9 F lurbiprofen 0 .9535 50 200 NA 7 0 4 9 1 6 .9 14.9 34.7 3 .5 3.4 2 .7 6.7 16.0 4′ -Hydroxyflurbiprofen 0 .9535 20 100 NA 5 7 5 4 2 0 .8 12.7 18.6 2 .8 1.9 1 .2 9.9 12.3 4′ -Hydroxyflurbiprofen/flur biprofen NA 8 1 1 1 2 3 .9 2.7 14.2 4 .5 2.6 2 .5 8.3 6 .8 2C19 (S )-Mephenyto in 0 .9857 2 5 8 7 9 9 7 2 1 2. 4 13.2 0 .8 14.0 14.0 22.4 4 .9 13.3 (± )-4′ -Hy d roxymephenytoin 0 .9797 2 5 9 4 9 9 8 0 1 5.7 13.6 1 .9 12.2 8 .5 22.9 6 .9 13.3 (± )-4′ -Hy d roxymephenytoin/( S )-mephenytoin 1 0 7 1 01 1 1 0 4 .3 1.9 1 .3 4.4 5 .4 1.0 6 .0 4.0 2D6 D extromethorphan 0 .9868 <1 1 7 3 9 9 7 4 1 3.5 13.9 4 .5 9.3 1 1.1 19.0 5 .3 1 1 .9 Dextrorphan 0 .9892 <1 1 8 5 9 6 7 4 1 4.0 7 .4 2.6 3 .5 4.5 8 .3 1 1 .0 8.3 Dextrorphan/dextro methorph an 1 1 7 9 8 1 05 5.6 5 .8 7.0 9 .5 7.5 13.5 7 .8 8.5 2E1 C hlorzoxazo ne 0.9641 5 2 0 7 0 9 1 7 5 1 4.3 13.9 72.9 3 .1 2.4 1 .3 9.2 28.8 6-Hydroxychlorzoxazon e 0.9684 20 100 8 2 1 0 9 8 7 1 1.9 19.2 58.9 3 .7 3.4 4 .7 7.1 24.1 6-Hydroxychlorzoxazon e/ chlorzoxazone 1 1 6 1 14 1 1 1 2.4 32.8 18.1 0 .7 4.1 5 .5 2.9 14.5 3A subfamily Midazolam 0 .9848 <1 1 7 2 9 0 7 4 1 1.6 13.5 1 1.0 27.1 16.8 22.6 1 .7 16.8 1′ -Hydroxymidazolam 0.9816 <1 1 7 6 9 0 7 7 2 4. 6 23.2 13.2 23.7 1 1.8 24.7 7 .4 19.6 1′ -Hydroxymidazolam/midazolam 1 0 6 1 00 1 0 3 1 4.9 10.4 3 .8 5.6 7 .0 4.6 6 .5 8.4 LL OQ low er limit of qua ntif ica tion ,LOD li mi t o f d et ec tion, NA not available, RSD relative standard deviation
single human donors were selected to be characterized with the cocktail assay developed. These HLM variants were selected because they were affected by an important genetic polymorphism, which significantly reduced the activities of three major CYPs (CYP2C9, CYP2C19, and CYP2D6) involved in the metabolism of major pharma-ceutical drugs. The metabolic ratios of these single donors were expressed as the percentage of the reference value (pooled HLMs), and the normalized phenotypic profiles
are reported in Fig. 4. This representation of the
micro-somes presents certain advantages in terms of visual in-terpretation. First, it demonstrates that the overall meta-bolic capacity of the microsomes exhibits an important interindividual variability. Then, in addition to the pres-ence of genetic polymorphism [27], the three single-donor microsomes show three very different CYP phenotypic profiles. The results for each single-donor allelic variant HLM were in complete agreement with the genetic poly-morphism and each exhibited reduced enzymatic activity for the CYP concerned compared with the activity expressed in normal pooled HLMs.
In addition to genetic variability (polymorphism), the CYP activities can be inhibited or induced by drugs. Two of the most significant enzymes participating in marketed drug me-tabolism, i.e., CYP2D6 and the CYP3A subfamily (especially CYP3A4) [28], are often involved in DDI.
The alteration of the activities of these CYPs and of the phenotypic profile was then studied for the allelic variant CYP2D6*4/*4 HLMs. Chemical competitive inhibitors and baculosome CYP2D6 were sequentially incubated with the CYP2D6*4/*4 HLMs to demonstrate the capability of the cocktail approach to show evidence of the metabolism
mod-ification. As expected and as depicted in Fig.5a, the addition
of quinidine (1μM), a CYP2D6 selective inhibitor, did not
modify the overall microsomal phenotype. Owing to the very low initial activity of this allelic variant isoform (i.e., CYP2D6 was already affected by genetic polymorphism), the effect of this potent inhibitor is negligible. The specificity of this
inhib-itor at 1μM was confirmed by the similar profiles of the CYP
activities and the noninhibited system (Fig.4c).
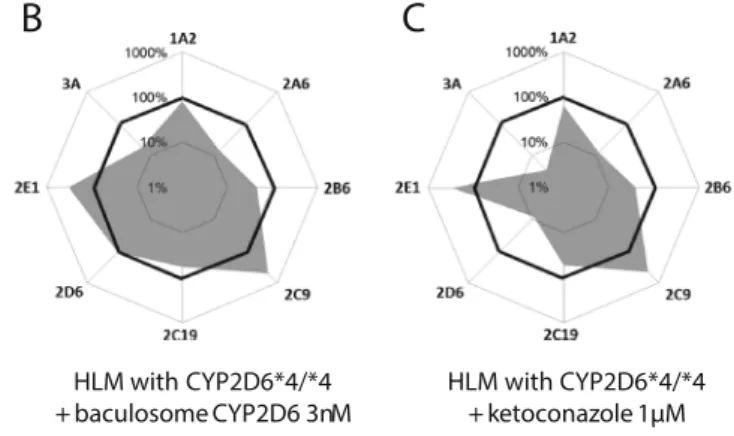
Then, to improve the reduced CYP activity in the same polymorphic HLMs, this system was exposed to baculosome 3A
2D6
2B6 2C19
1A2 2A6 2C9 2E1
0.00 2.00 4.00 6.00 8.00 10.00 12.00 14.00 16.00 18.00 0.00 2.00 4.00 6.00 8.00 10.00 12.00 14.00 16.00 18.00 3A 2D6 2B6 2C19
1A2 2A6 2C9 2E1
Absolute M etabolic R atio Absolute M etabolic R atio
A
B
C
D
Fig. 3 Classic representation of CYP phenotypic metabolic profiles of pooled HLMs obtained with the cocktail approach (a) and with the classic approach (individual incubations of substrates) (b). Histograms showing absolute metabolic ratios for the activities of the eight CYPs. Alternative representation of CYP phenotypic profiles of pooled HLMs obtained with
the cocktail approach (c) and with the classic approach (d). The radar chart in c reports the metabolic ratios expressed as the reference profile (100 %), whereas the radar chart in d shows the overlapping of the reference profile and the profile obtained with the classic approach expressed as a percentage of the reference
CYP2D6 (3 nM). As shown in Fig. 5b, the polymorphic HLMs recovered the CYP2D6 metabolic activity after addi-tion of the funcaddi-tional isoform without modifying the overall phase I metabolic capacity.
The addition of ketoconazole, a CYP3A selective inhibitor,
at a concentration of 1 μM reduced the CYP3A activity,
whereas the activities of the other CYPs monitored were not
modified compared with the original profile (Fig.5c), which
confirms the high specificity of ketoconazole at this concentration.
QTOF data for the extension of the CYP phenotypic profile As previously mentioned, the cocktail phase I metabolism is very complex owing to the large number of substrates and the simultaneous presence of all of the hepatic isoforms of the CYPs in the HLMs. Each substrate generates specific metabolites, but these metabolites could be substrates, cre-ating a second generation of phase I metabolites. Therefore, the number of features to potentially monitor will increase with the number of probes in the cocktail. In this context, QTOF-MS acquisition, which does not require prior selec-tion of the metabolites to be detected, could be advanta-geously applied. Indeed, known metabolites can be accu-rately extracted with the exact mass and narrow mass
win-dow (e.g., Fig.2), whereas unknown metabolites can also
be detected and identified using automated software (e.g., Metabolynx™). Two simple examples of this concept are
shown in Fig. 6. In addition to 1′-hydroxylation, the
CYP3A subfamily catalyzes to a minor extent the
4-hydroxylation of midazolam (Fig. 6a) [29]. The resulting
metabolite has the same mass as the major metabolite, but it
has a different retention time, as depicted in Fig. 2. The
modification of the CYP3A activity, expressed as the met-abolic ratio of 4-hydroxymidazolam to midazolam in allelic variant CYP2D6*4/*4 HLMs, was in complete agreement with the alterations and was very close to that obtained for
the major metabolite. As shown in Fig. 6b, the enzyme
isoforms involved in the overall metabolism of dextrome-thorphan are CYP2D6, responsible for the O-demethylation
to dextrorphan, and CYP3A, which mediates the N-demethylation to 3-methoxymorphinan. The specificity of
CYP3A is high, but Kmfor this pathway is 100 times higher
than for O-demethylation, making it a minor metabolic pathway [10]. Extraction of 3-methoxymorphinan occurs at the same mass as dextrorphan, and has a retention time of
6.33 min (Fig.2). As depicted in Fig.6b, the modification
of the CYP3A activity, expressed as the metabolic ratio of 3-methoxymorphinan to dextromethorphan in allelic vari-ant CYP2D6*4/*4 HLMs, showed results similar to those obtained considering both of the midazolam metabolites. The addition of quinidine or baculosome CYP2D6 did not affect the ratio representing this CYP3A-mediated biotrans-formation. As expected, the addition of ketoconazole de-creased the CYP3A activity. The significantly lower affin-ity of dextromethorphan for CYP3A could explain the lower effect of ketoconazole on the CYP3A activity com-pared with midazolam.
Finally, these biotransformations could be integrated as a supplementary assessment of the CYP3A activity and, con-sidering that each CYP isoform can potentially be involved in the formation of known and unknown metabolites from dif-ferent substrates, a more precise phenotypic profile of the
CYPs (e.g.,“extended cocktail profile”) could be generated
using QTOF-MS by extracting the latent metabolic information.
Conclusion
A cocktail assay including eight probe substrates was devel-oped to simultaneously phenotype the eight major CYPs in HLMs. The CYP activities were evaluated on the basis of the
metabolic ratio measured using the LC–MSE
method. Sepa-ration of the analytes was performed on a 10-cm column
packed with 2.5-μm particles, which primarily allowed the
acquisition of a suitable chromatographic peak width
compat-ible with the low acquisition rate generated by the MSEand
pDRE association. This type of detection method made
A
B
C
HLM with CYP2C9*3/*3 HLM with CYP2C19*2/*2 HLM with CYP2D6*4/*4 Fig. 4 Determination of CYP
phenotypic profile with the cocktail approach. Application to single-donor polymorphic HLMs: aCYP2C9*3/*3; b CYP2C19*2/ *2; and c CYP2D6*4/*4. CYP metabolic ratios are expressed as a percentage of the metabolic ratios obtained with pooled HLMs (100 %)
possible the simultaneous acquisition of good quantitative and qualitative data with an enhanced dynamic range and im-proved mass accuracy measurements. The variability of the analytical method was improved using the metabolic ratio, which avoided the use of an additional analytical standard in the quenching solution. Owing to the good analytical variabil-ity, it was possible to use this parameter as an indicator of the CYP activity without performing absolute quantification.
Time-based investigations on cocktail metabolism in pooled HLMs defined 20 min as the optimal incubation time,
which corresponds to a compromise between linearity of metabolite formation and acceptable substrate depletion. Un-der these conditions, the low enzymatic turnover substrate (S)-mephenytoin generated a detectable amount of CYP-specific metabolite, allowing the assessment of the highly polymor-phic CYP2C19 activity.
The reliability of the cocktail assay was confirmed after comparison with individual incubations of the substrates, which generated similar results. The CYP phenotypic profile resulted in the following: (1) better understanding of the
A
B
C
HLM with CYP2D6*4/*4 + quinidine 1µM HLM with CYP2D6*4/*4 + ketoconazole 1µM HLM with CYP2D6*4/*4 + baculosome CYP2D6 3nM Fig. 5 CYP phenotypic profile ofsingle-donor polymorphic HLMs (CYP2D6*4/*4) modified with 1μM quinidine (a), 3 nM baculosome CYP2D6 (b), and 1μM ketoconazole (c), obtained with the cocktail approach. CYP metabolic ratios are expressed as a percentage of the metabolic ratios obtained with pooled HLMs (100 %)
A
B
Fig. 6 a Microsomal phase I metabolism of midazolam (I). The metab-olites are 1′-hydroxymidazolam (II) and 4-hydroxymidazolam (III). The histogram at the bottom represents the CYP3A activity of single-donor polymorphic HLMs (CYP2D6*4/*4) modified with 1 μM quinidine, 3 nM baculosome CYP2D6, or 1μM ketoconazole, using CYP3A-medi-ated 4-hydroxylation of midazolam. CYP metabolic ratios (4-hydroxy-midazolam to (4-hydroxy-midazolam) are expressed as a percentage (mean±range, n=2) of the metabolic ratio obtained with no altered CYP2D6*4/*4 HLMs (100 %). b Microsomal phase I metabolism of dextromethorphan
(I). The metabolites are dextrorphan (II), 3-methoxymorphinan (III), and 3-hydroxymorphinan (IV). The histogram at the bottom represents the CYP3A activity of single-donor polymorphic HLMs (CYP2D6*4/*4) modified with 1μM quinidine, 3 nM baculosome CYP2D6, or 1 μM ketoconazole, using CYP3A-mediated N-demethylation of dextrome-thorphan to 3-methoxymorphinan. CYP metabolic ratios (3-methoxymorphinan to dextromethorphan) are expressed as a percentage (mean ± range, n=2) of the metabolic ratio obtained with no altered CYP2D6*4/*4 HLMs (100 %)
overall metabolic capacity of the microsomes tested, (2) com-parison between profiles, and (3) an easily observable demon-stration of the modifications of the CYP activities. Conse-quently, this cocktail assay was shown to be useful for phase I microsomal metabolism characterization and to rapidly high-light xenobiotics with a significant effect on the activities of CYPs, which is helpful during screening experiments. In com-bination with more sophisticated in vitro methods and/or with the assistance of in vitro-based computational simulation of in vivo data, this cocktail approach may be the first step toward filling the existing gap between in vitro and in vivo data.
References
1. Testa B, Pedretti A, Vistoli G (2012) Foundation review: reactions and enzymes in the metabolism of drugs and other xenobiotics. Drug Discov Today 17:549–560
2. Samer CF, Lorenzini KI, Rollason V, Daali Y, Desmeules JA (2013) Applications of CYP450 testing in the clinical setting. Mol Diagn Ther 17:165–184
3. Nicoli R, Curcio R, Rudaz S, Veuthey JL (2009) Development of an in-capillary approach to nanoscale automated in vitro cytochromes P450 assays. J Med Chem 52:2192–2195
4. Curcio R, Nicoli R, Rudaz S, Veuthey JL (2010) Evaluation of an in-capillary approach for performing quantitative cytochrome P450 activity studies. Anal Bioanal Chem 398:2163–2171
5. Tolonen A, Turpeinen M, Pelkonen A (2009) Liquid chromatography-mass spectrometry in in vitro drug metabolite screening. Drug Discov Today 14:120–133
6. Nicoli R, Martel S, Rudaz S, Wolfender JL, Veuthey JL, Carrupt PA, Guillarme D (2010) Advances in LC platforms for drug discovery. Expert Opin Drug Dis 5:475–489
7. Spaggiari D, Geiser L, Daali Y, Rudaz S (2014) A cocktail approach for assessing the in vitro activity of human cytochrome CYP450s: an overview of current methodologies. J Pharm Biomed Anal. doi:10. 1016/j.jpba.2014.03.018
8. Spaggiari D, Fekete S, Eugster PJ, Veuthey JL, Geiser L, Rudaz S, Guillarme D (2013) Contribution of various types of liquid chromatography-mass spectrometry instruments to band broadening in fast analysis. J Chromatogr A 1310:45–55
9. Matuszewski BK, Constanzer ML, Chavez-Eng CM (2003) Strategies for the assessment of matrix effect in quantitative bioanalytical methods based on HPLC-MS/MS. Anal Chem 75: 3019–3030
10. Yuan R, Madani S, Wei XX, Reynolds K, Huang SM (2002) Evaluation of cytochrome P450 probe substrates commonly used by the pharmaceutical industry to study in vitro drug interactions. Drug Metab Dispos 30:1311–1319
11. Jerdi MC, Daali Y, Oestreicher MK, Cherkaoui S, Dayer P (2004) A simplified analytical method for a phenotyping cocktail of major CYP450 biotransformation routes. J Pharm Biomed Anal 35:1203– 1212
12. Bosilkovska M, Déglon J, Samer C, Walder B, Desmeules J, Staub C, Daali Y (2014) Simultaneous LC–MS/MS quantification of P-glycoprotein and cytochrome P450 probe substrates and their metab-olites in DBS and plasma. Bioanalysis 6:151–164
13. Watanabe A, Nakamura K, Okudaira N, Okazaki O, Sudo KI (2007) Risk assessment for drug-drug interaction caused by metabolism-based inhibition of CYP3A using automated in vitro assay systems
and its application in the early drug discovery process. Drug Metab Dispos 35:1232–1238
14. Sevrioukova IF, Poulos TL (2013) Understanding the mechanism of cytochrome P450 3A4: recent advances and remaining problems. Dalton Trans 42:3116–3126
15. Tucker GT, Houston JB, Huang SM (2001) Optimizing drug devel-opment: strategies to assess drug metabolism/transporter interaction potential - towards a consensus. Br J Clin Pharmacol 52:107–117 16. Bjornsson TD, Callaghan JT, Einolf HJ, Fischer V, Gan L, Grimm S,
Kao J, King SP, Miwa G, Ni L, Kumar G, McLeod J, Obach RS, Roberts S, Roe A, Shah A, Snikeris F, Sullivan JT, Tweedie D, Vega JM, Walsh J, Wrighton SA (2003) The conduct of in vitro and in vivo drug-drug interaction studies: a Pharmaceutical Research and Manufacturers of America (PhRMA) perspective. Drug Metab Dispos 31:815–832
17. Di L, Kerns EH, Li SQ, Carter GT (2007) Comparison of cytochrome P450 inhibition assays for drug discovery using human liver micro-somes with LC-MS, rhCYP450 isozymes with fluorescence, and double cocktail with LC-MS. Int J Pharm 335:1–11
18. Walsky RL, Obach RS (2004) Validated assays for human cyto-chrome P450 activities. Drug Metab Dispos 32:647–660
19. Weaver R, Graham KS, Beattie IG, Riley RJ (2003) Cytochrome P450 inhibition using recombinant proteins and mass spectrometry/ multiple reaction monitoring technology in a cassette incubation. Drug Metab Dispos 31:955–966
20. Kozakai K, Yamada Y, Oshikata M, Kawase T, Suzuki E, Haramaki Y, Taniguchi H (2012) Reliable high-throughput method for inhibi-tion assay of 8 cytochrome P450 isoforms using cocktail of probe substrates and stable isotope-labeled internal standards. Drug Metab Pharmacokinet 27:520–529
21. US Food and Drug Administration (2011) Drug development and drug interactions: table of substrates, inhibitors and inducers.http:// w w w. f d a . g o v / d r u g s / d e v e l o p m e n t a p p r o v a l p r o c e s s /
developmentresources/druginteractionslabeling/ucm093664.htm.
Accessed Jan 2014
22. Chauret N, Gauthier A, Nicoll-Griffith DA (1998) Effect of common organic solvents on in vitro cytochrome P450-mediated metabolic activities in human liver microsomes. Drug Metab Dispos 26:1–4 23. Baudoin R, Prot JM, Nicolas G, Brocheton J, Brochot C, Legallais C,
Benech H, Leclerc E (2013) Evaluation of seven drug metabolisms and clearances by cryopreserved human primary hepatocytes culti-vated in microfluidic biochips. Xenobiotica 43:140–152
24. Palmer JL, Scott RJ, Gibson A, Dickins M, Pleasance S (2001) An interaction between the cytochrome P450 probe substrates chlorzoxazone (CYP2E1) and midazolam (CYP3A). Br J Clin Pharmacol 52:555–561
25. Pillai VC, Strom SC, Caritis SN, Venkataramanan R (2013) A sensitive and specific CYP cocktail assay for the simultaneous as-sessment of human cytochrome P450 activities in primary cultures of human hepatocytes using LC-MS/MS. J Pharm Biomed Anal 74: 126–132
26. Dierks EA, Stams KR, Lim HK, Cornelius G, Zhang HL, Ball SE (2001) A method for the simultaneous evaluation of the activities of seven major human drug-metabolizing cytochrome P450s using an in vitro cocktail of probe substrates and fast gradient liquid chroma-tography tandem mass spectrometry. Drug Metab Dispos 29:23–29 27. Wilson ZE, Rostami-Hodjegan A, Burn JL, Tooley A, Boyle J, Ellis
SW, Tucker GT (2003) Inter-individual variability in levels of human microsomal protein and hepatocellularity per gram of liver. Br J Clin Pharmacol 56:433–440
28. Guengerich FP (2008) Cytochrome P450 and chemical toxicology. Chem Res Toxicol 21:70–83
29. Patki KC, von Moltke LL, Greenblatt DJ (2003) In vitro metabolism of midazolam, triazolam, nifedipine, and testosterone by human liver microsomes and recombinant cytochromes P450: role of CYP3A4 and CYP3A5. Drug Metab Dispos 31:938–944
![Fig. 2 Extracted ion chromatograms [of the first function mass spec- spec-trometry (MS), ±0.02 Da] of substrates and their CYP-specific metabo-lites corresponding to the analysis of the cocktail microsomal incubation](https://thumb-eu.123doks.com/thumbv2/123doknet/14811634.611550/7.892.81.816.68.939/extracted-chromatograms-function-trometry-substrates-corresponding-microsomal-incubation.webp)