nanoparticles in aqueous and solid
matrices
David Bossert
1, Dominic A. Urban
1, Mattia Maceroni
1, Liliane Ackermann-Hirschi
1,
Laetitia Haeni
1, Phattadon Yajan
1, Miguel Spuch-Calvar
1, Barbara Rothen-Rutishauser
1,
Laura Rodriguez-Lorenzo
1,3, Alke Petri-Fink
1,2& Fabienne Schwab
1As the commercial use of synthetic amorphous silica nanomaterials (SiO2-NPs) increases, their effects on the environment and human health have still not been explored in detail. An often-insurmountable obstacle for SiO2-NP fate and hazard research is the challenging analytics of solid particulate silica species, which involves toxic and corrosive hydrofluoric acid (HF). We therefore developed and validated a set of simple hydrofluoric acid-free sample preparation methods for the quantification of amorphous SiO2 micro- and nanoparticles. To circumvent HF, we dissolved the SiO2-NPs by base-catalyzed hydrolysis at room temperature or under microwave irradiation using potassium hydroxide, replacing the stabilizing fluoride ions with OH−, and exploiting the stability of the orthosilicic acid monomer under a strongly basic pH. Inductively coupled plasma – optical emission spectroscopy (ICP-OES) or a colorimetric assay served to quantify silicon. The lowest KOH: SiO2 molar ratio to effectively dissolve and quantify SiO2-NPs was 1.2 for colloidal Stöber SiO2-NPs at a pH >12. Fumed SiO2-NPs (Aerosil
®
) or food grade SiO2 (E551) containing SiO2-NPs were degradable at higher KOH: SiO2 ratios >8000. Thus, hydrofluoric acid-free SiO2-NP digestion protocols based on KOH present an effective (recoveries of >84%), less hazardous, and easy to implement alternative to current methods.Knowing the concentrations of amorphous silica particles is essential in numerous areas of science and technol-ogy. Several million tons of this material are produced each year1. However, the analysis of particulate silica spe-cies (here termed SiO2) is challenging. A major reason for the lack of knowledge in biomedical sciences on SiO2 nanoparticle (SiO2-NP) cell interactions or long-term fate and effects in the body2 is the costly, time-consuming, and hazardous method required for the analysis of Si. As a result of the challenging analytics involved with the quantification of SiO2-NPs, most environmental and toxicological studies are performed with nanoparticles that are less environmentally relevant, but easier to analyze (e.g., gold3 or quantum dots). Other fields relying on sili-con analytics including and nano-sized SiO2-NPs are fate research on SiO2 nano-agrochemicals, micro-nutrient cycling of orthosilicic acid (Si(OH)4) in agriculture4,5, and the biogeochemical impacts of phytoplankton such as diatoms6,7. In daily life, food grade SiO2-NPs are present as a part of food grade SiO2 (E551) that is used in various products (e.g. in table salt as an anticoagulant). Their expected daily intake is 1.8 mg kg−18. Due to the release of studies that indicate this nanomaterial may cause a pro-inflammatory response9–11, manufacturers and consumers of products containing E551 have a direct interest in knowing their SiO2 content. A promising emerg-ing approach that directly detects intact, i.e. not previously digested, SiO2-NPs is semerg-ingle-particle mass spectrom-etry12. For now, this method is limited to a specific particle size range and requires highly specialized laboratory equipment and personnel. The need for simpler, inexpensive, and broadly applicable Si quantification methods to quantify SiO2-NP concentrations cannot be overstated.
1Adolphe Merkle Institute, University of Fribourg, Chemin des Verdiers 4, 1700, Fribourg, Switzerland. 2chemistry
Department, University of Fribourg, Chemin du Musée 9, 1700, Fribourg, Switzerland. 3Nano4Enviroment
Unit, Water Quality Group, INL - International Iberian Nanotechnology Laboratory, 4715-330, Braga, Portugal. Correspondence and requests for materials should be addressed to A.P.-F. (email: [email protected]) or F.S. (email: [email protected])
Received: 9 November 2018 Accepted: 9 May 2019 Published: xx xx xxxx
preparation protocols have in common that concentrated hydrofluoric acid is used as a standard ingredient to break down the poorly soluble particular SiO2 fraction and to stabilize Si in solution in soluble Si-F complexes. Hydrofluoric acid is highly hazardous, especially once it is in contact with skin, and therefore requires expensive and time-consuming safety precautions. Additional neutralization steps before injection into the instrument are needed because free hydrogen fluoride (HF) is highly corrosive for tubings and glass parts24,25. Silicon quantifica-tion methods under acidic condiquantifica-tions are therefore either prone to false-positive results, and/or include hazard-ous chemicals, are time-consuming, and are expensive.
Since SiO2 dissolution or extraction is an essential step in Si quantification, alternative hydrofluoric acid-free solubilization and extraction protocols for silica have been explored. Digestion protocols under basic conditions use for example lithium metaborate (LiBO2), lithium tetraborate (Li2B4O7), tetramethylammonium hydroxide (TMAH), and alkali bases26,27. Fusion techniques involving LiBO
2 and Li2B4O7 are often used in geology to ana-lyze soils and rocks with high Si contents, where large sample masses are available. However, for the analysis of samples containing Si in the lower mg range, these techniques have the drawback of being an open vessel diges-tion of only solid samples with high temperatures, low throughput, and the introducdiges-tion of a high concentradiges-tion of salt into the sample, requiring high dilution, and increasing the limits of quantification27. Similar to HF, TMAH is highly poisonous28. Concentrated NaOH and KOH can break down crystalline (e.g. quartz) samples and are less hazardous alternatives to extract Si from e.g. quartz, feldspar, and kaolin29. However, for samples containing organic carbon these bases have to be combined with strong oxidizers, which can have detrimental effects on the PTFE (Teflon) digestion vessels and the ICP-OES torch (e.g. NaOH and H2O2)30. Initial attempts to dissolve and quantify low amorphous SiO2 concentrations in plant samples used H2O2 in conjunction with KOH30, or low KOH: SiO2 ratios of 1.2 to analyze silicate species in amorphous silica gel18. Despite these first successes using KOH, the state of the art remains to dissolve SiO2 in acidic protocols using hydrofluoric acid, largely due to a lack of validation and knowledge on the application scope of this non-traditional approach.
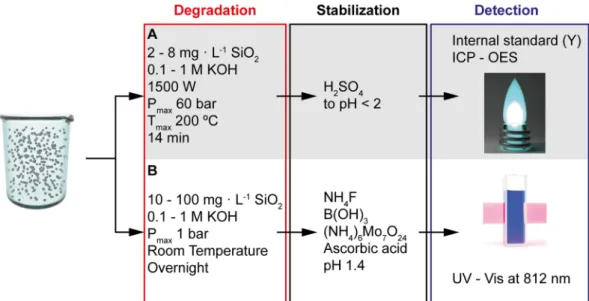
A validated SiO2 solubilization method based on KOH can significantly reduce the hazards and time to quan-tify Si. A hydrofluoric acid-free approach is more ecologic and economic due to the reduced use of disposable personal protection equipment, less toxic waste, and less corrosion damage to the equipment. The aims of the present work were therefore to (a) explore and validate the potential of KOH to digest amorphous particulate SiO2 for the quantification of Si by direct comparison with an approach that involves in situ hydrofluoric acid (Fig. 1); and (b) use the resulting KOH digestion methods to quantify the concentration and recovery of three different types of SiO2 (colloidal, fumed, and food grade) in matrices of increasing complexity, ranging from water to cell culture medium and food.
Results and Discussion
Molar ratio of KOH: SiO
2for complete SiO
2dissolution—mechanism.
The results of the method optimization using the High_SiO2 digestion method outlined in the method section and Table 1 are presented in Fig. 2. The dissolution of colloidal SiO2 into Si(OH)4 species was less dependent on the concentration of KOH, and more on the ratio of KOH to SiO2, which optimally is >1.2, and the pH, which should be >12. A volume of 10.0 mL of 0.1 M KOH (final concentration 82 mM) solubilized up to 50 mg of colloidal SiO2-NPs in suspension (Fig. 2). This corresponds to a molar ratio of 1.2 KOH: SiO2, in line with the results from Yang et al.19. The same volume of 0.05 M KOH still dissolved up to 30 mg colloidal SiO2-NPs (molar ratio: 1.0 KOH: SiO2), but did not dissolve 50 mg SiO2-NPs anymore (molar ratio: 0.6 KOH: SiO2), apparent from the high particle counts per sec-ond detected by DLS in that particular sample (Fig. 2). A slightly elevated DLS signal was also observed for the molar ratio of 1.0 KOH: SiO2. These results demonstrate that at least an equimolar concentration of KOH and optimally an excess of >20% is needed to dissolve SiO2. The constant ratio suggests that KOH fulfills a two-fold purpose: (a) installing a pH of >12 for the base-catalyzed hydrolytic degradation of hydrated silica31, and (b) neutralizing the Si(OH)4 liberated during this reaction to maintain the high pH. The threshold pH of >12 corre-sponds to the 14 mM KOH that are not neutralized by Si(OH)4 in the sample digested with 1.2 KOH: SiO2 (82 mM KOH, 68 mM SiO2), and is in agreement with the pH of 9–12 reported by Croissant et al. to dissolve SiO2-NPs31. We therefore adapted 0.1 M KOH and 1.2 KOH: SiO2 ratio as minimum values for further digestions for colloidal SiO2-NPs, and slightly more for fumed SiO2 NPs based on our observations (discussion below).For further investigation on the dissolution mechanism, the incompletely digested sample containing 50 mg colloidal SiO2-NPs in suspension with the insufficient 0.6 KOH: SiO2 ratio (Fig. 2) was dialyzed after the diges-tion against water for 1 d to remove KOH and dissolved Si species, and then inspected by transmission electron microscopy (TEM, Fig. 2). The structure of these partially dissolved SiO2-NPs revealed electron-transparent
nanopores and more surface roughness compared to the dense, non-porous, and smooth structure of freshly synthesized SiO2-NPs (Fig. 2), confirming results of Li et al., who, based gas adsorption analysis results, ascribed some nanoporosity to colloidal SiO2-NPs due to aggregation-based NP growth32. An alternative explanation for the porosity is that the dissolution does not progress from the surface towards the core, but is targeted on specific silanol bonds31 throughout the molecular structure. These observations are in line with Park et al., who showed that SiO2-NPs undergo a shape evolution due to Si-O bond-breaking and bond-making caused by hydroxyl ions, leading to rearrangement of high-energy bonds in the core33,34. No remaining NPs were observable by TEM in the samples digested using ratios >0.6 KOH: SiO2 (Fig. 2).
Method development.
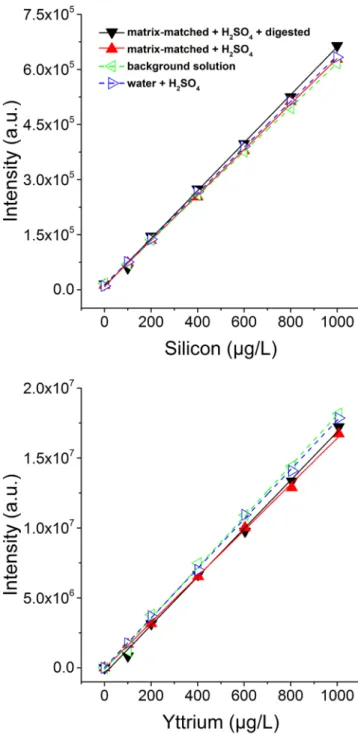
Comparison of calibration types. Four calibrations with increasing degrees ofcom-plexity (water + H2SO4; acidic background solution (BgS, 2% HNO3, 0.5% HCl); matrix-matched + H2SO4; and matrix-matched + H2SO4 + digested) are shown in Fig. 3 and their fitting parameters in Supplementary Table S2. As apparent from the high R2 (0.9987–0.9998), both Si and Y were stable in the concentration range of the
cali-brations under all conditions. As expected, calicali-brations exclusively containing acids showed the most stable Si signal (R2 = 0.9998), and the most complex calibration was slightly more unstable (R2 = 0.9987). A similar trend
was observed for the signal of the internal standard yttrium. Only subtle signal suppression of Si or Y due to the matrix were observable: the maximal relative difference between the sensitivity of the different calibrations was 7.7% for Si and 9.5% for Y. For Si, the highest sensitivity (652 ± 9.5 counts/(µg L−1)) was observed for the
Figure 1. Key steps and reagents used to hydrolytically degrade SiO2 nanoparticles under basic conditions using potassium hydroxide, and detect dissolved Si and Si(OH)4, respectively, under acidic conditions. The SiO2 concentrations stated are those used for the method development. (A) HF-free procedure for detection by inductively coupled plasma – optical emission spectrometry (ICP-OES) method suitable for complex matrices and accurate detection of low Si concentrations. (B) Procedure for detection by the colorimetric method using a UV-vis spectrophotometer. This method involves in situ HF, was used to validate method A, and is suitable for simple sample matrices.
Method Digestion Analysis max. SiO2 (mg L−1) max. KOH (M) range of molar ratio KOH: SiO2 Digested by max. Si (mg L−1) max. KOH (mM) Analyzed by High SiO2 4110 0.958 0.6–60.1 Microwave 1921 958 DLS KOH0.1 8.53 0.06 423–1922 1.98 30 ICP KOH0.5 70 0.5 0.4–1.7 0.75 100 KOH1.0 4.50 0.60 8017–36916 1.05 300 RT + KOH0.1 100 0.1 60.1 RT 4.45 10 UV-Vis RT + KOH1.0 2.61 0.6 13803–14704 0.57 300 ICP 85 1 462–707 2.39 39 UV-Vis
Table 1. Investigated digestion methods for samples containing SiO2. High_SiO2: high SiO2-NP concentrations were used to find the lowest KOH concentration leading to complete solubilization. KOH0.1, KOH0.5, KOH1.0: different KOH concentrations were tested to assess Si recovery in simple and complex matrices. RT + KOH0.1, RT + KOH1.0: the solubilization of SiO2-NPs at room temperature (RT) was tested (recoveries: refer to Table 2).
Figure 2. Results of digestion methods tested to find the optimal KOH: SiO2 ratio that allowed for a complete dissolution of SiO2-NPs. Dynamic light scattering (DLS) particle count rates and transmission electron microscopy (TEM) images are shown. High count rates represent undigested or partially digested colloidal SiO2-NPs. The lowest possible potassium hydroxide concentration for complete solubilization of the SiO2-NPs (digestion method: High_SiO2) was 0.092 M. In these or higher tested KOH concentrations (molar ratio of 1.2– 60.1 KOH: SiO2), all SiO2-NPs dissolved. The high particle count rate in the 48 mM KOH sample with a molar KOH: SiO2 ratio of 0.6 shows that the lower KOH concentration did not fully dissolve the 50 mg of SiO2-NPs. For these incompletely digested SiO2-NP samples, the TEM micrographs revealed a broadening of the size, an increase in surface roughness, and the presence of nanopores compared to the original SiO2-NPs.
Detection
method Digestionmethod SiOsource2 Matrix Recovery ± s.d.(%)
BEC LOQ LOD
(µg SiO2 L−1) ICP-OES KOH0.1 colloidal water 85 ± 2 24.5 80.1 41.1 KOH0.5 DMEM 84 ± 20 48.2 216.3 98.6 KOH1.0 fumed water 114 ± 25 63.7 67.6 64.8 colloidal tomato saucea 124 ± 5 n.d. n.d. n.d.
food grade seasoninga 95 ± 13 n.d. n.d. n.d.
RT + KOH1.0 colloidal water 84 ± 4.9 113 296 168 fumed 105 ± 1.4 113 296 168 Colorimetry RT + KOH0.1 colloidal 111 ± 7 115 264 148 fumed 67 ± 2 22 430 144 RT + KOH1.0 76 ± 9 120 307 176
Table 2. Recoveries and detection limits for amorphous SiO2-NPs. Colloidal Stöber SiO2-NPs; fumed Aerosil
®
SiO2-NPs; and food grade SiO2, also known as E551. The SiO2-NPs were analyzed in matrices of increasing complexity: water, cell culture medium (DMEM), potato seasoning, and tomato sauce. The numbers in the digestion method names are the KOH concentrations used in mol L−1. s.d.: standard deviation. n.d.: not determined. BEC: background equivalent concentration. LOD: instrument limit of detection. LOQ: instrument limit of quantification. RT: room temperature. ICP: Inductively coupled plasma – optical emission spectrometry. aThe food matrix was pre-digested as mentioned in section Pre-digestion of samples containingmatrix-matched + H2SO4 + digested calibration, and the lowest for the BgS calibration (602 ± 3 counts/(µg L−1)). The digestion and addition of 0.1 M KOH moderately stabilized free Si. However, Fig. 3 shows that neither the acids used (2.25 M H2SO4, 0.5% HCl, and 2.0% HNO3), nor the 0.1 M KOH, nor the digestion in the microwave led to a change of the Si signal noticeable in the statistical scatter of the data. For Y, the trends in matrix effects were somewhat different than for Si, and the highest sensitivity (18204 ± 321 counts/(µg L−1)) was observed for the BgS calibration, in agreement with HSAB theory (stabilizing effect of soft nitrate ligands on the soft Y metal ions which is less effective for hard Si ions)35. The variability of the Y intercept was somewhat increased due to an accidental systematic second addition of internal standard which had to be corrected in the data by subtraction. The Y calibrations suffered from slight sensitivity loss under the matrix-matched KOH conditions by ~2–7%. Nevertheless, the absolute sensitivity for Y was excellent throughout all experiments. We therefore used the matrix-matched + H2SO4 + digested calibrations with the highest sensitivity for Si for all measurements shown in Fig. 4 and Table 2.
Figure 3. Four calibrations of Si in matrices of increasing complexity are compared. Water + H2SO4: Si in water, acidified by H2SO4. Background solution: Si in aqueous acidic background solution (2% HNO3, 0.5% HCl). matched + H2SO4: Si with added KOH (3 mL, 0.1 M), without microwave digestion, acidified by H2SO4. Matrix-matched + H2SO4 + digested: Si with added KOH (3 mL, 0.1 M), with microwave digestion, acidified by H2SO4.
Repeatability and recovery. The measured concentrations of the SiO2-NP suspensions (Table 1) digested via the method KOH0.1 are compared with their calculated concentrations of Si in Fig. 4. A total recovery of Si/SiO2 of 85 ± 2% was achieved with an instrument limit of detection of 41 µg L−1 and an instrument limit of quantification of 80 µg L−1 SiO2 (Table 2). The method was linear in the investigated range of injected Si (373–1981 µg L−1) which corresponds to 1.88–8.53 mg L−1 SiO2 during the digestion. The relative error of the Si sensitivity, which can be attributed to measurements being taken over the course of multiple days by different investigators with different calibration matrices, was 31%. Three outliers are present among the hundred-twenty repeated measurements in Fig. 4. We attribute them to human pipetting errors. In practice, such errors can be detected and eliminated by analyzing, as in the present study, at least n = 3 replicate samples. While no outliers were deleted in the present study to present the reader with a realistic dataset, performing for example a Grubbs outlier test can identify such anomalies. In potential future large-scale applications, a robotic pipetting system can prevent such outliers. Overall, the repeatability of the measurements of concen-tration series prepared individually, digested in different microwave runs, and measured on the same day was very high (Fig. 4). This demonstrates that there is no significant buildup of Si in the instrument within one run, and the selected rinsing time of 55 s (10% HNO3) between samples was sufficient. We found, however, that it is necessary to clean the detector window in regular intervals and to thoroughly rinse the instrument with 10% HNO3 and Milli-Q (18.2 MΩ · cm) after each run.
We expected the recovery of Si in ICP-OES to be proportional to the stability of free Si(OH)4, and inversely proportional to the fraction of re-polymerized Si(OH)4 in the sample. The polymerization of silica is accelerated under several conditions such as pH >2, high temperature, and ionic strength >0.2 M19,36. Here, the pH was adjusted by the addition of H2SO4 to a pH of <2 to minimize polymerization and push the equilibrium towards orthosilicic acid. Although this addition of H2SO4 also increased the ionic strength, previous studies found that Si(OH)4 polymerization in the presence of H2SO4 is minimal36. The present results (Fig. 3) show a moderate sta-bilizing effect of H2SO4 on dissolved Si, based on a 3.5% difference between the sensitivities of Si calibrations in H2SO4 or BgS.
The higher the excess KOH concentrations, the lower the Si recovery was, which is in line with the abovemen-tioned destabilization of Y and stabilization of Si in high KOH environments. The Si recovery dropped by 15% in samples containing 0.1 M KOH compared to 1.0 M KOH. Hence, it is important to add the same concentration of KOH to the calibration in case the samples require KOH concentrations >0.1 M for digestion to account for this matrix effect. Finally, the SiO2 polymerization is accelerated by high Si(OH)4 concentrations36. We found plasma instability starting from 4000 µg Si L−1 upwards, and therefore limited routine concentrations to <1000 µg Si L−1.
Sample storage. Storing samples for extended periods showed that digestates could be analyzed after up to two
weeks without a statistically significant loss of recovery. A 3.6% decrease of Si recovery from 101.1% to 97.5% was observed between day 1 and at day 14 (Fig. 5, analysis of variance (ANOVA) and Tukey’s post-hoc test, p > 0.69). The recovery after 61 days of storage showed a significantly (18.3%, p < 0.031) reduced Si recovery of 82.6%. Such extended periods of storage of concentrated digestates at room temperature (RT) significantly affect the freely
Figure 4. Recovery and repeatability for the inductively coupled plasma – optical emission spectrometry
(ICP-OES) measurements of SiO2-NPs. One hundred twenty samples and ten blanks were measured to test the performance of the Si quantification (digestion method KOH0.1). Gravimetrically calculated nominal Si concentrations versus the measured internal yttrium standard corrected Si concentrations are shown. The dashed line is the linear fit through all measurements. The method was repeatable and resulted in a recovery of 85.3 ± 2.2% in the concentration range of 0–2 mg Si L−1 of silicon dioxide.
dissolved Si in the sample (ANOVA p < 0.02), likely due to re-polymerization. We noted improved stability of (1) refrigerated, (2) diluted, (3) low ionic strength, and (4) low pH samples. All these three conditions are known to push the equilibrium of polymerized SiO2 towards Si(OH)436.
Method applicability.
Suspensions containing fumed SiO2-NPs (Aerosil®
). The recoveries for fumedSiO2-NP suspensions digested using the method KOH1.0 (Table 1) are summarized in Table 2. The fumed SiO2-NP stock suspensions mainly contained aggregates (hydrodynamic diameter 267 nm) of smaller primary NPs 13 ± 5 nm in diameter (Supplementary Fig. S1 and Supplementary Table S1). We chose a harsher KOH con-centration of 1.0 M for fumed SiO2-NPs due to the expected poorer solubility of the non-porous and less hydrox-ylated fumed SiO2-NPs compared to the more porous and more hydroxhydrox-ylated colloidal SiO2-NPs8,32,37. While the specific surface area is, for the present particle sizes and fractal dimensions, expected to be higher for the fumed SiO2-NPs (200 m2 g−1) than the colloidal SiO2-NPs (~23–32 m2 g−1 based on literature for colloidal particles of smaller size)32, both the lower surface hydroxylation and lower porosity of fumed SiO2-NPs can hamper the base-catalyzed hydrolytic degradation due to the postulated mechanism of amorphous SiO2 dissolution that first requires hydration and hydrolysis of amorphous siloxane networks into silanols before the nucleophilic attack of OH−31. Also, suspensions of pre-digested, oven-dried SiO2-NPs formed acidic suspensions, which partially neutralized the added KOH in initial attempts to use 0.1 M KOH for digestion. Using 1.0 M KOH, we obtained a recovery of 114 ± 25% for fumed SiO2-NPs, and the same digestion at RT without microwave 105 ± 1.4% (Table 2). This elevated recovery (not significantly higher than 100%, one sample T-test, p > 0.22) may be a result of slightly less stabilized free Si ions than Y ions in the digestates, which were slightly more acidic than the cali-brations. In samples digested using KOH concentrations ≤0.5 M, recoveries remained <85% in ICP-OES meas-urements (Table 2), confirming that significant matrix effects occur due to excess KOH, as discussed in section
Repeatability and Recovery, only in SiO2 samples that are digested in >0.1 M KOH.
SiO2 in complex matrices. The performance of the method in SiO2-containing complex matrices tested is shown
in Table 2 (cell culture medium, tomato sauce, potato seasoning). We observed low recoveries for the diges-tion of SiO2 in complex samples using 0.1 M KOH in preliminary tests. By using the method KOH0.5 on the SiO2-NP-spiked cell culture medium samples, we obtained a recovery of 84 ± 20% of SiO2 without pre-digestion (Table 2). The large statistical scatter can be connected to the complex formulation of the cell culture media Dulbecco Modified Eagle Medium (DMEM). Among many amino acids and vitamins, DMEM also contains ~10 g L−1 of dissolved inorganic salts, of which 3.6 g L−1 is sodium, which is notorious for causing high variability in ICP-OES measurements30,38. The present results show that the KOH digestion of SiO2-NPs in a serum-free cell culture medium delivered, despite some variability, an acceptable accuracy and recovery.
For the food matrix samples, i.e. the tomato sauce spiked with colloidal SiO2-NPs and the potato seasoning, the matrix was first digested in HNO3 to isolate the SiO2-NPs (i.e. pre-digestion) and then these NPs were dissolved by KOH (refer to Experimental Section). As with DMEM, we had to use higher KOH concentrations of 1.0 M to get satisfactory recoveries. We obtained a recovery of 124 ± 5% and 95 ± 13% for colloidal SiO2-NPs in tomato sauce and food grade SiO2 (E551) in potato seasoning, respectively. The recoveries of both samples (tomato sauce, potato seasoning) were calculated relative to the mass of remaining solids after the first acid-mediated digestion step, as SiO2 was the sole remainder detected by energy-dispersive X-ray spectroscopy (EDX) after the harsh HNO3 pre-digestion (data not shown). According to the literature, the natural Si concentration in tomatoes is maximally ~61 mg kg−139, corresponding to ~31 µg natural Si in the analyzed mass of tomato sauce. The high recovery of 124 ± 5% for colloidal SiO2-NPs spiked into the tomato sauce (Table 2) indicates that additional natu-ral SiO2 was detected in the tomato sauce. The recovery of 95 ± 13% SiO2 found for the potato seasoning (Table 2)
Figure 5. Stability of digestates containing hydrolytically degraded SiO2 over time. The concentration is proportional to the recovery: the data can be read from both y-axes. Certified Si standard solutions digested according to method KOH0.1 (Table 1) and stored at room temperature were measured at different time points after digestion. The storage time significantly affected the concentration after sixty-one days, but not after fourteen days (analysis of variance, p < 0.02, Tukey’s post-hoc test, p > 0.69).
corresponds to a total of 4.8 g SiO2 kg−1 for the potato seasoning. Sodium residues from the pre-digestion can be the reason for the more variable results compared to the other tested matrices, in line with the results for DMEM, and as also reported by Frantz et al.30. The quantity of the anti-caking agent was not indicated on the potato sea-soning package. However, our results are in good agreement with Si analyses of related products in the literature40.
SiO2-NP digestion at room temperature—ICP-OES (HF-free) vs. colorimetry (not HF-free). For colloidal SiO2-NPs
in a simple matrix, the microwave digestion is replaceable by an RT digestion overnight in 0.1 M or 1.0 M KOH, without much reduction in recoveries (Table 2). Colloidal SiO2-NPs digested in 1.0 M KOH at RT yielded a recovery of 84 ± 5% compared to 85 ± 2% for 0.1 M KOH in the microwave (both measured by ICP-OES). This demonstrates that porous, almost entirely hydroxylated colloidal SiO2-NPs are digestible at RT without expensive instrumentation, and confirms reports by Tanakaa and co-workers, who found that silica gel dissolves in 0.1 M KOH without the aid of microwave irradiation18.
The efficiency of ICP-OES and colorimetry in detecting SiO2-NPs was directly compared for samples digested using the method RT + KOH1.0 (Tables 1 and 2). Using colorimetry, the recovery for fumed SiO2-NPs was lower (76 ± 9%) than for ICP-OES (105 ± 1.4%). Also, for the fumed SiO2-NPs, the recovery was only 67 ± 2% when digested in 0.1 M KOH at RT (Table 2), revealing a limitation of the digestion methods at RT for fumed SiO2-NPs and colorimetry that only detects fully dissolved orthosilicic acid or small Si oligomers21. Despite the larger specific surface area, the non-porous, less hydroxylated fumed SiO2-NPs were, in agreement with Zhang and co-workers37, harder to completely digest and required the harsher 1.0 M KOH conditions, in contrast to the more soluble porous, more hydroxylated colloidal SiO2-NPs. The ICP-OES method was more robust in detecting incompletely digested SiO2 at RT: a high recovery was found for fumed SiO2-NPs of 105 ± 1.4% in 1.0 M KOH.
The trend in the recovery of the two detection methods for colloidal SiO2-NPs was inverse: despite milder digestion conditions (0.1 M KOH), colorimetry detected more Si (111 ± 7%) than ICP-OES (84 ± 5%, 1.0 M KOH). The simplest explanation for this seemingly contradictory result is that the harsh 1.0 M KOH conditions readily dissolved the colloidal SiO2-NPs, and because the easier to dissolve colloidal SiO2-NPs did not consume all of the 1.0 M KOH, the excess KOH negatively affected the ICP-OES recovery. This confirms the earlier finding that, for colloidal SiO2-NPs, KOH concentrations <0.5 M are sufficient for ICP-OES analysis and excess KOH should be avoided.
The present results show that the ICP-OES detection of Si is more widely applicable than colorimetry because, despite satisfactory recoveries, the quantification via colorimetric detection of Si has several limitations. First, as mentioned before, the colorimetric quantification of Si suffers from a wide variety of interferences20,41 and exclusively detects fully dissolved Si(OH)4 or small oligomers21. Second, the present colorimetric determination of Si employed a four-fold higher dilution factor (105) compared to ICP sample preparation (25). Based on the LODs in Table 2, this results in an estimated detectable concentration for the colorimetry of >15–32 mg SiO2 L−1, and for the ICP-OES of >1.7–7.4 mg SiO2 L−1, depending on the sample matrix. The high detection limit for the colorimetry makes it challenging to detect Si in samples with low SiO2 concentrations of <15 mg SiO2 L−1 without additional pre-concentration steps as used e.g. by Rimmelin-Maury and co-workers6. Future development of the KOH digestion method for colorimetry should, therefore, focus on reducing the LOD by reducing this dilution factor or including pre-concentration steps. Finally, the digestion protocol for colorimetry uses ammonium fluo-ride at a low pH, which raises concerns of in situ hydrofluoric acid formation due to its pKa of ~3.17.
Conclusion
Herein, we report a series of methods using basic KOH digestion to quantify Si in a broad variety of samples. Digested samples containing particulate amorphous SiO2 or Si(OH)4 could be quantified by ICP-OES or color-imetry (Fig. 6). The method was successfully applied in samples of low and high complexity including aqueous colloidal or fumed SiO2-NP suspensions, SiO2-NP-spiked cell culture media, SiO2-NP-spiked tomato sauce, and potato seasoning containing food grade SiO2 (E551). SiO2 dissolved at a minimum KOH: SiO2 ratio of 1.2 at pH values >12. The complexity of the sample matrix and the manufacturing process of the SiO2 under investigation
Figure 6. Graphical abstract showing the main findings of this study. A hydrofluoric-acid-free digestion
method to quantify SiO2 nanoparticles in different matrices was developed for optical emission spectrometry and cross-validated by colorimetry and an HF approach.
dissolution and quantification methods presented here are simple to implement alternatives to current standard procedures and applicable in fields such as biomedical sciences and environmental chemistry where SiO2-NP quantification in complex matrices is important.
Method Section
Materials, chemicals, and matrices.
Commercially available fumed (pyrolytic) SiO2-NPs (Aerosil®
200, 98% SiO2, specific surface area of 200 m2 g−1) were purchased from Evonik (former Degussa). Fumed SiO2-NPs are produced by continuous flame hydrolysis, are reported to be non-porous by the manufacturer and Mebert and co-workers8, and are less hydroxylated than colloidal SiO2-NPs37. All chemicals used were per analysis grade unless it is stated otherwise. Water was pre-purified by a Milli-Q system (18.2 MΩ.cm arium 611DI, Sartorius Stedim Biotech, Germany). Dialysis membranes were purchased from Roth (Membra-Cel
™
, 14 kDa cut-off).Both cell culture medium and food matrices are relevant chemically complex matrices that reportedly pose significant analytical challenges for NP analytics43,44. We selected three representative complex matrices according to the following criteria: (1) the cell culture media DMEM is widely used in in vitro NP-cell interaction studies45; (2) tomato sauce is a typical food matrix containing with <61 mg kg−1 comparatively little SiO
239; and (3) potato seasoning is a foodstuff where E551, i.e. food grade SiO2, was listed on the packaging as an anti-caking ingredient. The potato seasoning (Qualité & Prix Country Potato Seasoning Blend, Germany) and the tomato sauce (Cirio Rustic Tomato Purée, Italy) were purchased from a local supermarket.
Colloidal SiO
2-NP synthesis.
Colloidal SiO2-NPs were synthesized via a co-condensation reaction adapted from Stöber et al.46. Briefly, ethanol (522 mL, absolute, Honeywell), ammonia (122.7 mL, 1.65 mol, 25% aqueous solution, Merck), and water (40.5 mL, MilliQ) were mixed and heated to 60 °C. The mixture was stirred at that temperature for 1 h to equilibrate. Tetraethyl orthosilicate (67.5 mL, 302 mmol, Sigma-Aldrich) was added, and the mixture was stirred at 60 °C overnight. The mixture was allowed to cool to RT, and the NPs were washed three times by centrifugation (Thermo Scientific, F15-8 × 50cy fixed-angle rotor, 5000 × g, 10 min) and redispersed in water. The final opaque SiO2-NP suspension (500 mL) contained 23.1 g SiO2 kg−1, as determined gravimetrically by drying aliquot volumes of the suspension. Due to the sol-gel manufacturing process, colloidal Stöber SiO2-NPs are more porous and almost fully hydroxylated compared to the fumed SiO2-NPs8,32,37.Nanoparticle characterization.
The SiO2-NPs were characterized by TEM (primary particle diameter), and dynamic light scattering (DLS, hydrodynamic particle diameter, surface charge). The results are summarized in Supplementary Fig. S1 and Supplementary Table S1. For TEM analysis, samples were prepared by diluting NP suspension (1 μL) with ethanol (5 μL, absolute, Honeywell) for SiO2-NPs and water for fumed SiO2-NPs directly on the TEM grids (carbon film, 300 mesh on Cu, Electron Microscopy Sciences) and wicking remaining liquid using a precision wipe tissue (Kimtech Science). The TEM images were recorded in 2048 × 2048 pixel resolution (Veleta CCD camera, Olympus) on a FEI Tecnai Spirit TEM, operating at an acceleration voltage of 120 kV. The DLS samples were diluted with water (1% v/v) and measured on a Brookhaven Particle Size Analyzer Plus90 (USA) (scattering angle 90°, 1 min acquisition, 10 repetitions). The size distribution of the particles was analyzed by computer-assisted particle size analysis software (imageJ, plugin: psa-r12)47, applied to the TEM micrographs.Digestion pretests to find the KOH concentration for complete SiO
2dissolution.
A series of digestion methods (throughout the text referred to as High_SiO2) was tested to find the highest SiO2 mass and lowest KOH concentration that allowed for complete solubilization of all SiO2 nanoparticles in the sample. Colloidal SiO2-NP suspensions (433–2165 µL of a 23.1 g SiO2 kg−1 suspension, equivalent to 10, 20, 30, and 50 mg of SiO2) were weighed into the PTFE microwave vessels, and KOH (10 mL, 0.05, 0.1, 0.5, or 1.0 M) was added (Table 1). The mixtures were sealed and digested in the microwave (details below). The digestates were measured by DLS (particle counts per second) and visualized using TEM to detect undigested SiO2-NPs.Digestion methods investigated for ICP-OES.
Figure 1 shows the key steps, and Table 1 the reagents and concentrations used in the different digestion protocols investigated. All microwave digestions were con-ducted using an Anton Paar Multiwave PRO, equipped with a 24HVT50 rotor holding 25 mL PTFE microwave vessels with pressure-activated-venting caps (PTFE-TFM, max. pressure 40 bar). All microwave runs consisted of a temperature ramp to 200 °C for 7 min followed by a temperature hold for 7 min and concluded by a coolingthe PTFE microwave vessels and diluted with water to ~2 g. Aqueous KOH (3 mL, 0.1, 0.5, or 1.0 M, respectively, Table 1) was added, and the mixtures were prepared for the microwave run. The digestates were transferred to conical tubes (polypropylene, Falcon
®
) and acidified by H2SO4 (2.25 M) to pH 1–2. Internal standard (yttrium, 50 mg L−1 solution in 2% HNO3/0.5% HCl, 100 μL) was spiked, and the samples were topped off with water to 10 mL for the ICP-OES analysis.
RT + KOH0.1, RT + KOH1.0. Here, the SiO2 digestion at RT was tested, and the Si detection of ICP-OES was compared with colorimetry. For the ICP measurements, stock suspensions (25 mg SiO2 kg−1 in water) of either colloidal or fumed SiO2-NPs were mixed with KOH (3.0 mL, 1.0 M) and stirred overnight at RT (Table 1). Then, H2SO4 (2.25 M) was added until pH 1–2 was reached. Internal standard (yttrium, 50 mg L−1 solution in 2% HNO3/0.5% HCl, 100 μL) was spiked, and the resulting digestates were topped off with water to 10 mL for the ICP-OES analysis.
Pre-digestion of samples containing food matrix. The colloidal SiO2-NP-spiked tomato sauce samples and the food grade SiO2-NP containing potato seasoning were pre-digested according to a procedure for food analysis established in our laboratory. In pretests, we found that for these food matrices, the method KOH0.1 to KOH1.0 was not suitable due to the high solid content. We therefore used a two-step digestion for these samples, consist-ing of an acidic pre-digestion of the food matrix followed by KOH digestion of the oven-dried SiO2-containconsist-ing residue. Briefly, for the pre-digestion, the sample (~0.5 g) was added to the PTFE microwave vessels and nitric acid (63%, 3 mL) was added. The closed vessels were heated in the microwave (700 W, 10 min at 60 °C) without previously running a ramp. After this run, the vessels were opened to release nitric oxide gases, closed again, and heated in the microwave (800 W) according to the following program: ramp (90 °C, 5 min), hold (2 min), ramp (180 °C, 6 min), hold (15 min) and cool to 70 °C. The cooled digestates were transferred into 15 mL conical tubes (polypropylene, Falcon
®
) and diluted with water to 5 mL. The digested samples were cleaned by centrifugation at 8000 × g for 10 min at 4 °C and redispersed in 1 mL of water. The centrifugation-redispersion cycle was repeated until the pH of the suspensions reached 5–6. The water was evaporated in an oven and the resulting Si-containing solids were operationally defined to consist of 100% SiO2, as an energy dispersive X-ray spectrometric (EDX) elemental analysis found no impurities. These solids were used to prepare stock suspensions in water for quan-tification experiments using the basic digestion methods KOH1.0-KOH0.1 and subsequent ICP-OES analysis.ICP-OES Si Quantification and Calibrations.
The ICP-OES analyses of Si were performed on a Perkin Elmer Avio-200 (radio frequency power 1500 W, gas flow rates 8 L/min (Ar, plasma), 0.2 L/min (N2, auxiliary), pump 0.8 L/min (nebulizer), concentric glass nebulizer, cyclonic glass spray chamber, spectral lines: Si 251.611 nm, Y 371.029 nm). Certified reference element standards (TraceCERT®
; Y, 989 mg kg−1 in 2% HNO3; Si, 975 mg kg−1 in 2% NaOH, Sigma-Aldrich) were diluted gravimetrically in an acidic BgS to a concentration of 50 mg kg−1.Four types of Si calibrations with increasing complexity were prepared using the same volumes and con-centrations as in the digestion method KOH0.1 to assess the effects on the Si sensitivity of the ICP-OES for samples in different acids, in KOH matrix, and digested in the microwave. The four Si calibrations were Si in water and H2SO4 (short: water + H2SO4); Si in BgS; Si in water and KOH (3 mL, 0.1 M), acidified by H2SO4 (short: matrix-matched + H2SO4); and Si in water and KOH (3 mL, 0.1 M) digested in the microwave, and acidified by H2SO4 (short: matrix-matched + H2SO4 + digested). The background was accounted for by subtraction of the blank concentration.
Sample preparation for colorimetric SiO
2analysis.
To test the suitability of the KOH digestion method for colorimetry, and to cross-validate the ICP-OES results using a conventional approach involving hydrofluoric acid, we quantified the dissolved silicon dioxide according to a modified version of the colorimetric method based on the blue molybdosilicic acid complex (Fig. 1)19. For the digestion, lyophilized colloidal SiO2-NPs (2.0 mg, 33.0 µmol SiO2) or fumed SiO2-NPs (1.7 mg, 28.3 µmol SiO2) were suspended in 0.1 M KOH (20 mL) for the colloidal SiO2-NPs or 1.0 M KOH (20 mL) for the fumed SiO2-NPs and stirred overnight at RT. All the resulting digestates were then diluted to a final concentration of 0.1 M KOH. From here, we followed the colorimetric SiO2 analysis protocol reported by Yang et al.19 using 5 mL of the colloidal SiO2-NP digestate and 9 mL of the fumed SiO2-NP digestate (concentration: 9.2–92 colloidal SiO2 L−1, and 9.2–14.4 mg fumed SiO2 L−1, respec-tively). Water (5 mL), HCl (1 M, 5 mL) and NH4F (1 M, 1 mL) were added, and the mixtures were stirred at 25 °C in a water bath for 45 min. Mixing a 5-fold excess of HCl with NH4F produces HF in situ due to the pKa of HF ofData Availability
The data generated or analyzed during this study are included in this article and its Supplementary Information Files. Raw data sets analyzed during this study are available from the corresponding author upon reasonable request.
References
1. Wang, Y., Kalinina, A., Sun, T. Y. & Nowack, B. Probabilistic modeling of the flows and environmental risks of nano-silica. Science of the Total Environment 545, 67–76, https://doi.org/10.1016/j.scitotenv.2015.12.100 (2016).
2. Bourquin, J. et al. Biodistribution, Clearance, and Long-Term Fate of Clinically Relevant Nanomaterials. Advanced Materials 30, https://doi.org/10.1002/adma.201704307 (2018).
3. Ferry, J. L. et al. Transfer of gold nanoparticles from the water column to the estuarine food web. Nature Nanotechnology 4, 441–444, https://doi.org/10.1038/Nnano.2009.157 (2009).
4. Haynes, R. J. Significance and Role of Si in Crop Production. Advances in Agronomy 146, 83–166, https://doi.org/10.1016/ bs.agron.2017.06.001 (2017).
5. Ma, J. F. Role of silicon in enhancing the resistance of plants to biotic and abiotic stresses. Soil Sci Plant Nutr 50, 11–18, https://doi. org/10.1080/00380768.2004.10408447 (2004).
6. Rimmelin-Maury, P., Moutin, T. & Queguiner, B. A new method for nanomolar determination of silicic acid in seawater. Anal Chim Acta 587, 281–286, https://doi.org/10.1016/j.aca.2007.01.055 (2007).
7. Round, F. E. Diatom Communities - Their Response to Changes in Acidity. Philos T Roy Soc B 327, 243–249, https://doi.org/10.1098/ rstb.1990.0059 (1990).
8. Mebert, A. M., Baglole, C. J., Desimone, M. F. & Maysinger, D. Nanoengineered silica: Properties, applications and toxicity. Food Chem Toxicol 109, 753–770, https://doi.org/10.1016/j.fct.2017.05.054 (2017).
9. Winkler, H. C. et al. My D88-dependent pro-interleukin-1beta induction in dendritic cells exposed to food-grade synthetic amorphous silica. Part Fibre Toxicol 14, 21, https://doi.org/10.1186/s12989-017-0202-8 (2017).
10. Tsugita, M., Morimoto, N. & Nakayama, M. SiO2 and TiO2 nanoparticles synergistically trigger macrophage inflammatory responses. Particle and Fibre Toxicology 14, 11, https://doi.org/10.1186/s12989-017-0192-6, (2017).
11. Park, E. J. & Park, K. Oxidative stress and pro-inflammatory responses induced by silica nanoparticles in vivo and in vitro. Toxicology Letters 184, 18–25, https://doi.org/10.1016/j.toxlet.2008.10.012 (2009).
12. Bustos, A. R. M. & Winchester, M. R. Single-particle-ICP-MS advances. Analytical and Bioanalytical Chemistry 408, 5051–5052, https://doi.org/10.1007/s00216-016-9638-1 (2016).
13. Frydrych, R. Zur Molybdatreaktion Definierter Kieselsauren. Chem Ber-Recl 97, 151–&, https://doi.org/10.1002/cber.19640970120 (1964).
14. Alon, A., Frenkel, M. & Bernas, B. Determination of Silica by Conways Microdiffusion Technique. Anal Chim Acta 31, 279–&, https://doi.org/10.1016/S0003-2670(00)88820-0 (1964).
15. Mullin, J. B. & Riley, J. P. The Colorimetric Determination of Silicate with Special Reference to Sea and Natural Waters. Anal Chim Acta 12, 162–176, https://doi.org/10.1016/S0003-2670(00)87825-3 (1955).
16. Strickland, J. D. H. The Preparation and Properties of Silicomolybdic Acid.2. The Preparation and Properties of Beta-Silicomolybdic Acid. Journal of the American Chemical Society 74, 868–871, https://doi.org/10.1021/ja01124a003 (1952).
17. Strickland, J. D. H. The Preparation and Properties of Silicomolybdic Acid.1. The Properties of Alpha-Silicomolybdic Acid. Journal of the American Chemical Society 74, 862–867, https://doi.org/10.1021/ja01124a002 (1952).
18. Tanakaa, M. & Takahashib, K. Silicate species in high pH solution molybdate, whose silica concentration is determined by colorimetry. Anal Chim Acta 429, 117–123, https://doi.org/10.1016/S0003-2670(00)01275-7 (2001).
19. Yang, H. L. et al. Molybdenum blue photometry method for the determination of colloidal silica and soluble silica in leaching solution. Anal Methods-Uk 7, 5462–5467, https://doi.org/10.1039/c5ay01306b (2015).
20. Rinder, T. & Oelkers, E. H. On the colorimetric measurement of aqueous Si in the presence of organic ligands and common pH buffering agents. Mineral Mag 78, 1431–1436, https://doi.org/10.1180/minmag.2014.078.6.10 (2014).
21. Coradin, T., Eglin, D. & Livage, J. The silicomolybdic acid spectrophotometric method and its application to silicate/biopolymer interaction studies. Spectrosc-Int J 18, 567–576, https://doi.org/10.1155/2004/356207 (2004).
22. Strickland, J. D. H. The Preparation and Properties of Silicomolybdic Acid.3. The Combination of Silicate and Molybdate. Journal of the American Chemical Society 74, 872–876, https://doi.org/10.1021/ja01124a004 (1952).
23. Lamble, K. J. & Hill, S. J. Microwave digestion procedures for environmental matrices. Analyst 123, 103r–133r, https://doi. org/10.1039/A800776D (1998).
24. Wang, X. G. et al. A review of treatment strategies for hydrofluoric acid burns: Current status and future prospects. Burns 40, 1447–1457, https://doi.org/10.1016/j.burns.2014.04.009 (2014).
25. Kirkpatrick, J. J. R., Enion, D. S. & Burd, D. A. R. Hydrofluoric-Acid Burns - a Review. Burns 21, 483–493, https://doi. org/10.1016/0305-4179(95)93254-H, (1995).
26. Hauptkorn, S., Pavel, J. & Seltner, H. Determination of silicon in biological samples by ICP-OES after non-oxidative decomposition under alkaline conditions. Fresen J Anal Chem 370, 246–250, https://doi.org/10.1007/s002160100759 (2001).
27. Delijska, A., Blazheva, T., Petkova, L. & Dimov, L. Fusion with Lithium Borate as Sample Preparation for Icp and Aas Analysis. Fresen Z Anal Chem 332, 362–365, https://doi.org/10.1007/Bf00468816 (1988).
American Chemical Society 134, 15790–15804, https://doi.org/10.1021/ja304907c (2012).
38. Hislop, J. E. & Hornbeck, J. W. Coping with effects of high dissolved salt samples on the inductively coupled plasma spectrometer. Commun Soil Sci Plan 33, 3377–3388, https://doi.org/10.1081/Css-120014531 (2002).
39. Powell, J. J. et al. A provisional database for the silicon content of foods in the United Kingdom. Brit J Nutr 94, 804–812, https://doi. org/10.1079/Bjn20051542 (2005).
40. Dekkers, S. et al. Presence and risks of nanosilica in food products. Nanotoxicology 5, 393–405, https://doi.org/10.3109/17435390.2 010.519836 (2011).
41. Fanning, K. A. & Pilson, M. E. Q. On the Spectrophotometric Determination of Dissolved Silica in Natural Waters. Anal Chem 45, 136–140 https://doi.org/10.1021/ac60323a021 (1973).
42. Yu, L. L., Fassett, J. D. & Lindstrom, A. P. Determination of Si in Standard Reference Material SRM 295x Silica-on-Filter. J Anal Atom Spectrom 18, 738–741, https://doi.org/10.1039/b212069k (2003).
43. Singh, G., Stephan, C., Westerhoff, P., Carlander, D. & Duncan, T. V. Measurement Methods to Detect, Characterize, and Quantify Engineered Nanomaterials in Foods. Compr Rev Food Sci F 13, 693–704, https://doi.org/10.1111/1541-4337.12078 (2014). 44. Go, M. R., Bae, S. H., Kim, H. J., Yu, J. & Choi, S. J. Interactions between Food Additive Silica Nanoparticles and Food Matrices.
Front Microbiol 8, https://doi.org/10.3389/fmicb.2017.01013 (2017).
45. Yang, Y. X. et al. Evaluation of the toxicity of food additive silica nanoparticles on gastrointestinal cells. Journal of Applied Toxicology
34, 424–435, https://doi.org/10.1002/jat.2962 (2014).
46. Stöber, W., Fink, A. & Bohn, E. Controlled growth of monodisperse silica spheres in the micron size range. J Colloid Interf Sci (1968). 47. Sperling, R. Github repository and Documentation, https://github.com/psa-rs/psa-macro (2010).
48. Schwartz, M. C. Photometric Determination of Silica in the Presence of Phosphates. Ind Eng Chem Res 14, 893–895 (1942). 49. Galhardo, C. X. & Masini, J. C. Spectrophotometric determination of phosphate and silicate by sequential injection using
molybdenum blue chemistry. Anal Chim Acta 417, 191–200, https://doi.org/10.1016/S0003-2670(00)00933-8 (2000).
Acknowledgements
This research was financially supported by the Swiss National Science Foundation (SNSF project 136976), the SNSF Ambizione project 168187, the Adolphe Merkle Foundation, and the University of Fribourg. We are grateful to Jessica Caldwell for English language proofreading.
Author Contributions
D.B., D.A.U., B.R.-R., A.P.-F. and F.S. conceived and designed the Si analytics experiments. M.S.-C. and L.R.-L. conceived, designed, and accomplished the Si method performance analysis in complex matrices. L.A.-H. established and accomplished the Si analysis by colorimetry. M.S.-C. contributed to the graphic design of Figs 1, 2 and 6. L.H. performed the pre-digestion of the spiked food samples. P.Y. characterized the Aerosil
®
particles. D.A.U. and M.M. measured all ICP-OES samples except those for the complex matrix analysis that were measured by L.R.-L. The result interpretation was performed by D.B., L.R.-L. and F.S. and the writing of the manuscript was performed by D.B. and F.S. All authors contributed to discussions of the manuscript.Additional Information
Supplementary information accompanies this paper at https://doi.org/10.1038/s41598-019-44128-z.
Competing Interests: F.S. and M.M. have a patent pending on a SiO2-NP plant growth enhancer. Other than that, the authors have declared no conflict of interest.
Publisher’s note: Springer Nature remains neutral with regard to jurisdictional claims in published maps and
institutional affiliations.
Open Access This article is licensed under a Creative Commons Attribution 4.0 International
License, which permits use, sharing, adaptation, distribution and reproduction in any medium or format, as long as you give appropriate credit to the original author(s) and the source, provide a link to the Cre-ative Commons license, and indicate if changes were made. The images or other third party material in this article are included in the article’s Creative Commons license, unless indicated otherwise in a credit line to the material. If material is not included in the article’s Creative Commons license and your intended use is not per-mitted by statutory regulation or exceeds the perper-mitted use, you will need to obtain permission directly from the copyright holder. To view a copy of this license, visit http://creativecommons.org/licenses/by/4.0/.