HAL Id: hal-01830050
https://hal.archives-ouvertes.fr/hal-01830050
Submitted on 4 Jul 2018
HAL is a multi-disciplinary open access archive for the deposit and dissemination of sci-entific research documents, whether they are pub-lished or not. The documents may come from teaching and research institutions in France or abroad, or from public or private research centers.
L’archive ouverte pluridisciplinaire HAL, est destinée au dépôt et à la diffusion de documents scientifiques de niveau recherche, publiés ou non, émanant des établissements d’enseignement et de recherche français ou étrangers, des laboratoires publics ou privés.
Influence of Phytoplankton Lysis or Grazing on
Bacterial Metabolism and Trophic Relationships
France van Wambeke
To cite this version:
France van Wambeke. Influence of Phytoplankton Lysis or Grazing on Bacterial Metabolism and Trophic Relationships. Microbial Ecology, Springer Verlag, 1994, 27, pp.143 - 158. �hal-01830050�
Microb Ecol (1994) 27:143-158
MICROBIAL
ECOLOGY
© 1994 Springer-Verlag New York Inc.
Influence of Phytoplankton Lysis or Grazing on Bacterial Metabolism and Trophic Relationships
F. Van Wambeke
Microbiologie Marine, C.N.R.S., U.P.R. 223, Campus de Luminy, case 907, 13 288 Marseille cedex 9, France
Received: 22 May 1993; Revised: 18 October 1993
Abstract. Experimental microcosms were used to study the dynamics of heterotrophic bacterial populations with respect to phytoplankton loss. In a two-stage linked culture system, we artificially separated production and loss
processes of a diatom Phaeodactylum tricornutum. In the first (productive)
stage, the algae developed axenically and continuously. The outfow was fluxed in two degradation stages, where phytoplankton-derived detritus re- suited respectively from: (1) excretion and by-products of phagotrophic organ- isms (protozoans), and (2) bacterial degradation through bacterial attachment and lysis. According to the phytoplankton decay mode, i.e., lysis or grazing, bacterial adaptations were different. The study of bacterial productivity and aminopeptidase activity showed specific bacterial evolution during the succes- sion of different prey-predator relationships. The occurrence of aggregates allowed nanoflagellates to develop an alternative diet; they fed not only on bacteria, but also on partially degraded phytoplankton detritus, inducing a strong short-cut in the food chain. Sources and controls of extracellular prote- olytic activity are discussed. Such experimental approaches are interesting because they separate bacterial lysis and protozoan grazing of phytoplankton, as well as the fates of their corresponding phytoplankton detritus in the micro- bial food web.
Introduction
Spring phytoplankton blooms generally cease as rapidly as they appear. Grazing, lysis, and sedimentation are the main factors ending such blooms [24, 47]. Some of these are favored by hydrodynamic singularities [26]. Jumars et al. [22] demon- strated the importance to bacterial growth of by-products resulting from incomplete ingestion, digestion, and absorption during grazing. For zooplankton material is lost through fecal material, excretion, and breakage of prey during feeding. Egested food vacuoles and excretion constitute the means of loss for protozoans. Conse- quently, in the euphotic zone, grazer by-products and phytoplankton-lysed detritus constitute sources of organic matter for heterotrophic bacteria. During phytoplank-
144 F. Van Wambeke
ton lysis, microbial succession shows a characteristic aggregation phase [2, 30] associated with well-defined attached bacterial populations possessing high growth rates [16, 27] and high capacities to hydrolyse bio-polymers [14, 48]. Then a disaggregation phase occurs, due to the combined activity of bacteria and protozo- ans [2]. In contrast, in the case of phytoplankton grazing, Jumars et al. [22] suggest a rapid diffusion away of solutes resulting from incomplete digestion. Furthermore, undigested vacuolar contents issued from protozoan grazing are submicron parti- cles usually classified as dissolved organic matter, i.e., at the opposite end of the particle size spectrum when compared to fresh aggregated phytodetritus.
Polymer hydrolysis is a rate-limiting step in the microbial utilization of organic matter during phytoplankton post-blooms [4, 15]. Enzymatic activity per cell and bacterial growth rates show complex variations from pre-bloom to post-blooms situations [23]. Thus, bacterial productivity should be strongly dependent on the size distribution of particles and on the composition of the available detrital mate- rial. Several questions arise from these hypotheses: (1) Does grazing or lysis degradation processes provide equivalent phytoplankton-derived detritus in terms of availability for heterotrophic bacteria? (2) Are there direct relationships between hydrolytic activity and bacterial productivity? (3) Is bacterial production favored by the pre-digestion of phytoplankton by grazers? and (4) How do heterotrophic nanoflagellates feeding on bacteria interfere during these two decay modes?
Observations in natural conditions do not provide answers to these questions. An experimental study appears to be necessary to differentiate phytoplankton loss processes. For this purpose a two-stage continuous culture system was developed. In the first stage, an axenic, pure culture of Phaeodactylum tricornutum developed in nitrogen-sufficient conditions. This primary production was transferred to a second stage containing natural sea water stored in the dark. This stage comprised two treatments designed to determine the fate of phytoplankton through the micro- bial food web [1] by differentiating between bacterial lysis and protozoan grazing. The effect of grazing or lysis of P. tricornutum on bacterial production, aminopep- tidase activity, and trophic relationships was studied throughout the microbial successions occurring in both microcosms.
Materials and Methods Microcosm Design
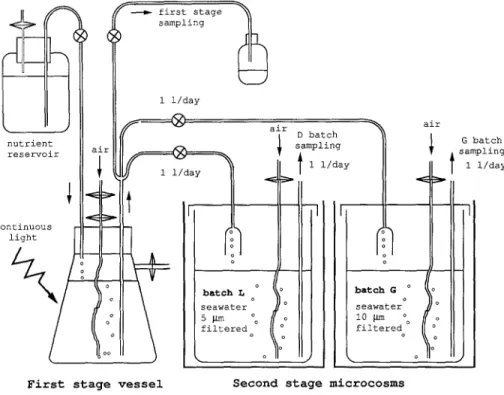
The two-stage culture system is shown in Fig. 1. In the first stage (P) the P. tricornutum was grown axenically in N-sufficient conditions in a 5-liter culture vessel under continuous light at 20°C. This culture was maintained at a dilution rate of 0.5 day- 1. The outflow was separated into 3 fractions. One was obtained by a peristaltic pump which ran for 4 h (4-8:00 a.m.) to collect first-stage samples. The 2 other fractions were obtained by a pump which ran from 8:00 a.m. to 4:00 a.m. The first-stage outflow (mean 1 liter per batch and per day) was divided into two 100-liter batches (G and L), pre-filled with 80 liters of filtered sea water. The L batch was devoted to bacterial lysis of phytoplankton and was filtered (5 p,m, cellulose acetate, Sartorius, G6ttingen, Germany) to prevent protozoan development. The G batch was devoted to grazing of phytoplankton by protozoans and was filtered only through a 10-~m filter (Nuclepore, Cambridge, USA) to permit protozoan growth. Such filtration discarded metazoans, and was intended to obtain the minimum of trophic levels in the protozoan food web. Filtration was by means of a siphon-filter, ensuring no contact with air under the filter and no turbulence [38]. The 2 batches, G and L, were kept in the dark to avoid any new phototrophic production. Average water
/ f P first stage i ~ sampling 1 1/day air ~ air , D batch i I . I G batch
nutrient i ~ s ampllng ~ ,sampling
reservoir a n | 1 i/day ~ l 1 1/day
continuous light o ° ° seawater d
First stage vessel Second stage m i c r o c o s m s
(in the dark) Fig. 1. Schematic diagram of the two-stage experimental system,
temperature was 20°C. The inflow of 1 liter day- 1 was counterbalanced by sampling the same volume
every day. The experiment lasted 30 days.
Biomass Determinations
Algae, heterotrophic nanoflagellates, and bacteria were fixed with formalin (final concentration 2%) and stained with DAPI (final concentration 500 Ixg liter-I). Bacteria were filtered through 0.2-p~m Nuclepore filters and counted according to the technique described by Porter and Feig [32]. Samples were dispersed by sonication (75 W, 2 rain with a 5-mm probe). Bacterial biovolumes were estimated by sizing width (W) and length (L) of about 150 bacteria from random fields on several slides. Individual biovolumes were calculated as:
Vol = 7r x (W 2 x L/4 - W3/12).
Algae and heterotrophic nanoflagellates were filtered through 0.8-~m Nuclepore filters and counted by epifiuorescence microscopy according to the technique described by Sherr and Sherr [40]. The variation coefficient averaged 15% for counts. Nanoflagellates were classified into different categories according to their size and morphology during counting with an ocular micrometer. Variation coeffi- cient (VC) averaged 15% for counts.
Bacterial Production
Bacterial production was estimated daily by the thymidine (Tdr) method [13]. Subsamples (10 ml) were incubated at 20°C in the dark for 1 h after receiving 10 nM [methyl-3H]thymidine (83 Ci mmol-l). A killed control was prepared with 5% trichloracetic acid (TCA). To stop incubation, each
146 F. Van Wambeke duplicate was cooled for 5 rain in an ice-water bath, followed by the addition of 1 ml of ice-cold 55% TCA. The two duplicates and the blank were filtered through Sartorius cellulose acetate filters (0.2 I~m). Filters were rinsed 3 times with 3 ml ice-cold 5% TCA before radioassaying.
Time course experiments (0, 15, 30, 60, and 120 rain) performed during the higher activity period demonstrated that Tdr incorporation was always linear over 1 h in the two batches. Thymidine saturation was verified 3 times (days 0, 7, and 27), by incubating [3H]Tdr at 2, 5, 10, 15, and 20 nM final concentration. Isotope dilution was inhibited by using the concentration of 10 nM, which was saturating (more than 75% of the Vmax) in most of the saturation tests performed.
Conversion factors were obtained twice in each batch (days 12 and 25) from simultaneous measure- ments of [3H]Tdr incorporation in ice-cold TCA, and increase in bacterial biomass in diluted batch cultures; 100 ml of 3-p~m filtered G or L batches were diluted with 900 mi of particle-free water from the same batch (0.2 txm, Sartorius acetate filter).
Empirical conversion factors were calculated during exponential growth by dividing the increase in bacterial biovolume by the integrated [3H]Tdr incorporation [34]. The carbon/biovolume conversion factor was determined from previously published [41] data. Rates of thymidine incorporation were converted to bacterial production using an average conversion factor of 34.4 ng C pmol Tdr- 1 (_4__ 79%, n = 4); this value was used for both batches during all the experiments.
Respiration of Amino Acids
Ten-milliliter samples of L and G batches were sampled daily and inoculated separately with [14C]arginine (10 nM), [laC]glutamic acid (10 nM), and [14C]leucine (10 nM). After 1 h of incubation at 20°C, samples were filtered through 0.2-p~m Sartorius acetate filters and rinsed 3 times with 0.2-p.m filtered sea water. The filters were examined with liquid scintillation counting. Respira- tion was measured by acidifying the filtrate with H2SO 4 and trapping the evolved 14CO2 in a phenylethylamine trap. Abiotic adsorption of the label was corrected with formalin-killed con- trois. One hour was a sufficient incubation time to reach isotopic equilibrium, as verified during three time-course experiments. Respiration percentage was expressed as percentage of total uptake for each amino acid. Difference between duplicates was, on average 11% of the respiration per- centage.
Aminopeptidase Activity
Aminopeptidase activity was assayed by measuring the production rate of 7 amido 4-methylcoumarin (MCA) from L-leucyl-methylcoumarin-HC1 (Leu-MCA) [ 18]. An aliquot of Len-MCA stock solution (5 m~ in methylcellosolve) was added to 3 ml of sample and gently mixed, yielding a final concentra- tion of 50 p~M Leu-MCA. Fluorescence intensity was recorded at 365 nm (excitation) and 445 nm (emission) in a Kontron, Warlord, UK SFM 23 B spectrofluorometer every 5 min during a 30 min incubation period at 20°C. As the Leu-MCA concentration employed was 50 IxM, aminopeptidase activity was expressed in terms of potential velocity (nanomoles Leu hydrolyzed per liter per hour).
Bacterial Mortality Rates
On three occasions (days 4, 11, and 22), bacterial mortality rates were measured in L and G batches according to the procedure of Servais et al. [37]. Briefly, we determined the long-term decrease of the radioactivity in the ice-cold TCA precipitate of subsamples, where bacterial populations had previously incorporated [3H]thymidine during one day. This decrease in radioactivity was measured in the total sample and in a 2-1xm pre-flltered 50-ml sample in order to estimate the grazing rate and the residual mortality rate of bacteria.
Phytoplankton Decay Mode and Microbial Trophodynamics 147
Data Analysis
In an ideal continuous culture, a microorganism changes its abundance according to the equation: d X / d t = D × ( X i - X o ) + K
where dX/dt (cells liter -a day -1) is the variation rate of cell abundance, D is the dilution rate of the batch (day-a), Xi and Xo (cells liter-1) the inflow and outflow cell numbers, respectively. K corre- sponds to the sum of biological and physical fluxes inside the culture, i.e., the sum of production sources minus the sum of losses, and consequently represents the net daily variations. Ideally, in stable continuous cultures dX/dt = 0 and the sign of Xo - Xi only determines if the microorganisms are 'consumed' or 'produced.'
In L and G batches, dX/dt varied, and the following equation was used:
Kx(i,j) = (XAj - XAi)/(j - i) + ((1/Vii) × [(XAj + XAi)/2 - (XPj + XP0/2]) (1)
where XAj and XA i were the microorganism concentration in the second stage, XPj and X P i the microorganism concentration in the first stage on days j and i, and Vii the second stage batch volume (liters) between days i and j.
Bacterial export fluxes (Fexp, micrograms carbon per liter per hour) were calculated from bacterial production and daily net variations of bacterial biomass as follows:
Fexp(i,j) : KijBB - (PB i + PBj)/2
where K~jBB is the daily net variation of bacterial biomass (micrograms carbon per liter per hour). PB i and PBj are bacterial productions (micrograms carbon per liter per hour) on days j and i, respectively. This equation gives an estimate of hourly rates of bacterial export for comparison with rates of bacterial production, but it is estimated from bacterial biomasses estimated daily and assumes linear interpola- tion of bacterial production between days i and j.
Considering a simple prey-predator relationship, instantaneous (daily) carbon gross growth effi- ciency Y of a predator Z feeding on a prey X can be estimated with calculated daily net variation, if this parameter approximates the true production and losses of the prey and predator, respectively, by the following equation:
Y = (Ki,jZ/IKi,jXI) × 100 (2)
The daily net variation K~,jZ is the production rate of the predator (micrograms carbon per liter per day). The daily net variation, IKi.jXl , is the clearance rate of the prey (micrograms carbon per liter per day). Carbon growth efflciencies were estimated only when daily corrected variations (net variations) were high and were supposed to reflect the true gross growth (or grazing rates) of the organisms. For protozoans, carbon equivalent was estimated from abundance and mean biovolume, using a 220 fg C Ixm -3 ratio [5] as conversion factor. The carbon equivalent for the three size classes of protozoans, I-H-Ill (bacterial predators, see results), were pooled to estimate daily corrected variation of bacterial
predators, termed Knag. The daily corrected variation of P. tricornutum carbon (Ket) was calculated
from P. tricornutum abundance, and carbon per cell ratio was calculated from the axenic culture (range
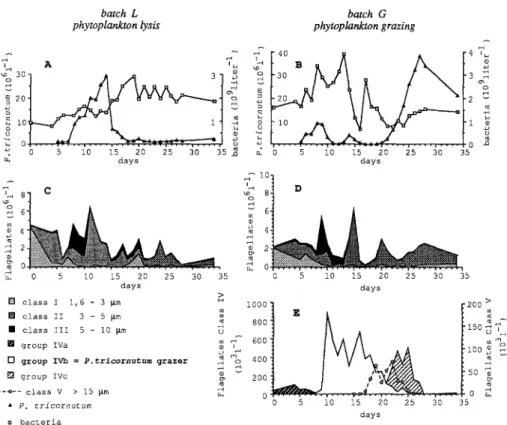
5.3-10.5 pg C algae-a). Results Microbial Communities I n b a t c h L ( 5 - ~ m p r e - f i l t e r e d ) , t h e a b s e n c e o f a n y k i n d o f l a r g e p r o t o z o a n a b l e to g r a z e d i r e c t l y o n P. tricornutum w a s c o n f i r m e d b y m i c r o s c o p e o b s e r v a t i o n s . F r o m d a y s 7 t o 11, P. tricornutum i n c r e a s e d in a c c o r d a n c e w i t h t h e t h e o r e t i c a l i n f l o w o f a b o u t 6 . 2 × 10⁶ c e l l s l i t e r - 1 d a y - 1 ( F i g . 2 A ) . I n c r e a s e in b a c t e r i a l d e n s i t y c o i n -
148 F. Van Warnbeke batch L phytoplankton lysis 2o % '~ o - - ' - " , ~ 0 5 i0 15 20 25 30 35 n ~ days % ~__ 6 4 2
~o
0 5 i0 15 20 25 30 35 days [] c l a s s I 1 , 6 - 3 ~ m ~> [] c l a s s II 3 - 5 ~ m [] c l a s s Ill 5 - i0 ~ m o [] g r o u p IVa ~ i [3 g r o u p IVb = P . t r l c o r n u t u m grazer ~ [] g r o u p IVc - - ~ - - c l a s s V > 15 ~ m • P. t r i c o r n u t u m u b a c t e r i a batch G phytoplankton grazing j - c 4 [ 4o B ~ A [4 e ~ c *d , , . . . . ,~ . . . . , : : _ ~ . , ' ~ . L ± ± ' [ . . . . , . . . . , . . . . | 0 " ~ 0 5 i0 15 20 2 5 30 35 days ~ 4 g 2 0 5 i0 15 20 25 30 35 days 8 0 0 150 600 ~ m i00 ~ 4 0 0 2 0 0 50 0 5 i0 15 20 2 5 30 35 daysFig. 2. Changes in numbers of microbial populations with time. Batch L (left): decomposition of phytoplankton; batch G (right): grazing of phytoplankton.
cided with P. tricornutum enrichment (days 5-10, Fig. 2A). During this period,
most of the bacterial population were free-living cells.
After this period, degradation of P. tricornutum followed the scheme described
by Biddanda and Pomeroy [2]. Initially, aggregates were exclusively composed of
P. tricornutum cells and bacteria; subsequently, aggregates also included phytode-
tritus and protozoans (day 8 to 14). Bacteria colonizing P. tricornutum cells
exhibited a specific morphology and attachment mode. They were rod-shaped (2.3 x 0.38 txm) and attached on algal cells only by their poles (spiked-bacteria). This characteristic aspect of attachment has been described by Newell et al. [30]
(Caulobacter attached on Thalassiosira cells), and suggested competition for space. This attachment was very strong, as some of them resisted the sonication treatment used for bacterial counts. Bacterial numbers increased during this aggre- gation phase until day 19.
After the algal peak (days 14 to 17), almost all aggregates disappeared. The algae lost their fluorescence brightness and seemed to have no cytoplasmic content. Such ghost cells were observed during other phytoplankton decomposition experiments [7, 14]. The phytoplankton then decomposed at the same rate as the inflow flux, as confirmed by the stabilization of algal counts from day 17. Bacterial counts stabi-
lized at about 2.2 x 10⁹ bacteria liter -1 , with oscillations (1.7-2.5 × 10⁹ bacteria
Phytoplankton Decay Mode and Microbial Trophodynamics 149 The heterotrophic nanoflagellates (HNAN) observed in this batch were almost spherical, with diameters ranging between 1.6 and 10 txm. Their counts were separated into three size classes: I (1.6-3 Ixm), II (3-5 txm), and III (5-10 p,m).
Maximum HNAN counts were obtained at day 11 (6.3 x 10 6 liter -1) and com-
prised mostly class II cells (Fig. 2C). The HNAN population decreased rapidly on
days 11-15, and then fluctuated until the end of the experiment (0.3-2.8 x 10 6
HNAN liter-l). Occasionally (day 20 and 24), HNAN peaks were opposed to those of bacteria, but this was not systematically observed.
In batch G (protozoan grazing), the microbial community appears morphologi- cally diversified. In addition to the three HNAN size classes observed in batch L,
other larger protozoans developed. Grazing of P. tricornutum was checked by
observation of digestive vacuoles fluorescing red or by an obvious phagocytosis step (half a diatom still visible, partially engulfed by a protozoan). The extreme sizes of protozoans showing such proofs of ingestion were 8 and 14 p,m. Most of these predatory cells were spherical; they constituted the class IVb. Two other morphological types of protozoans were identical in size to those of class IVb, but
never presented direct proof of P. tricornutum ingestion; one conical protozoan
(5-6 txm x 10-12 }xm) belonging to class IVa was detected at the beginning of the experiment (105 cells liter-I), and another one, more spherical (5.5-7 }xm x 7-9
Ixm), also peaked at 0.48 x 10 6 cells liter -1 at the end of the experiment (class
IVc).
Other protozoans (class V) were observed occasionally (Fig. 2E), and their
number was estimated approximately (<0.05 x 10 6 cells liter-1), given the impre-
cision of their counts. Among them, some ciliates (Lhomaniella, F. Rassoulzade-
gan, pers. comm.) and some amoebic forms (cell 12 Ixm in diameter, pseudopo- dium 16-24 txm long) were observed.
The microbial succession observed in this batch suggested three main prey-
predator relationships: class IVb on P. tricornutum, class V on class IVb and,
classes I, II, and HI on bacteria (Fig. 2B,D,E).
Heterotrophic Activity
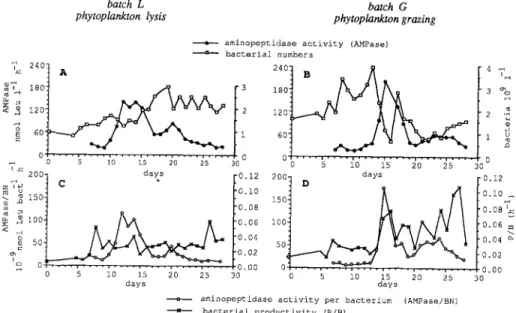
Aminopeptidase Activity. Aminopeptidase activity was measured on and after the 7th day of the experiment. In both batches (Fig. 3A,B), initial activities were low
(about 30 nmol Leu liter -1 h - l ) . In the lysis batch L, aminopeptidase activity
reached 141 nmol Leu liter -a h - at day 12 and was sustained up to 125 nmol Leu liter -1 h -1 for the four following days. In the grazing batch G, the peak was later (day 15) but higher (202 nmol Leu liter -1 h-l).
When expressed on a per bacterial cell basis, aminopeptidase activity showed more contrasted peaks than when expressed by unit volume (Fig. 3C,D). The aminopeptidase activity/bacterial count ratio was esPecially enhanced in grazing batch G since the highest aminopeptidase activity corresponded to a strong decrease in bacterial numbers.
Respiration of Amino Acids. Among the three amino acids tested, glutamic acid, which is more representative of maintenance metabolism, was more mineralized (Fig. 4). A progressive increase in the respired fraction was observed in batch L
150 F. Van Wambeke batch L phytoplankton lysis 'L 24°i A 6oi 0' • 0 batch G phytoplankton grazing
a aminopeptidase activity (AMPase)
---a--- bacterial numbers
1 2 0 6 0 0 • 4 ~ 3 % 2 -~ 5 0 5 i0 15 20 25 300.[ I x ~ 200- days ~ [0.12 2001 D days 12 m u 2 150 t °'I° 150 I 0.i0
~
I0.08
0.08 I
~< ~ 5 0 2 ~ I00 . ~ . ~ 00"040'0602 I0050 I 0"020"040"06 m'~o
0 ~ - 0100 0 - /0.00 5 i0 15 20 25 30 0 5 i0 15 20 25 30 days daysamiaopeptidase activity per b a c t e r i u m (AMPase/BN)
M bacterial productivity (P/B)
Fig. 3. Total extracellular proteolytic activity and bacterial biomass (A, B), and proteolytic activity per bacterium and bacterial productivity (C, D), in batches L (left) and G (right).
4J @ O b a t c h L phytoplankton
lysis
----m--- Glu • L e u Arg 50. 3 0 , 2 0 1 0 . . . . i . . . . i . . . . i . . . . i . . . . i . . . . i 0 5 I0 15 20 25 30 d a y s batch G phytoplankton grazing 50. 40- 30- 20. i0. 0 . . . . i . . . . i . . . . , . . . . i . . . . i . . . . i 5 I0 15 20 25 30 d a y sFig. 4. Mineralization (as percentage respired) of leucine, arginine, and glutamate in batches L (left)
and G (right).
(from 19.1% to 37.1% on day 22); in the G batch, in contrast, 45% of this amino acid was respired as early as day 13. Then, the respiration percentages of glutamic acid varied greatly (24--45%). In contrast, leucine was preferentially incorporated in proteins and was less respired in both batches. Leucine and arginine respiration percentages did not change significantly during the experiment in batch L (mean 5.7%, HVC 30% for Leu, and 11.2%, HVC 31% for Arg). In batch G, the Arg
Phytoplankton Decay Mode and Microbial Trophodynamics 151
batch L batch G
phytoplankton lysis phytoplankton grazing
----o--- b a c t e r i a l b i o m a s s (BB) - - b a c t e r i a l p r o d u c t i o n (FB) i b a c t e r i a l e x p o r t a t i o n (Fexp) 4. A [70 4. B IT0 ~=3 f \ ~ ~a0, 2 3 I \ I \ , A ~0 2 0 m : ? . i 2oN ,~ 1. I V I " " I " I 0 t~ . _ ~ " ° " I " I 0 o . ~ . . . i o :~ o . . . ~,- . . . [ o
5~.~o a5 2~ 2s 3o ~ A/1 zo_ 191 2o 25 3o
"
vvy
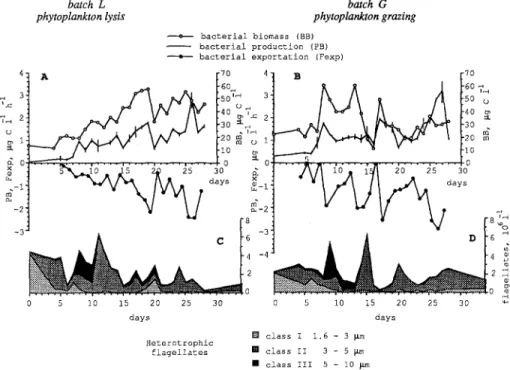
- 2 " ~ - 2 ' " 8 ! -3. " "~ ~ ~ 4 -4 4 2 2~; 0 5 i0 15 20 25 30 0 5 i0 15 20 25 30 d a y s d a y s [] c l a s s I 1,6 - 3 ~tm H e t e r o t r o p h i c f l a g e l l a t e s [] c l a s s II 3 - 5 ~ m • c l a s s III 5 - 10 ~ mFig. 5. A, B Bacterial biomass (Ixg C liter-i), bacterial production, and bacterial export (l~g C liter -1 h -1) in batches L (left) and G (right). See methods for calculation of bacterial export. Abundance of nanoflagellates class I, II, llI (C, D) are also reported for comparison with bacterial export. For bacterial production, bars represent differences between duplicates.
respiration percentage decreased significantly from 10.2% (confidence interval 7.9-12.5) to 5.4% (confidence interval 4.1-6.7) after day 17.
Bacterial Production and Export. Bacterial production varied from 0.1 to 2.8 txg C liter-1 h - l , and 0.3 to 3.2 ~g C liter-1 h-~ in batches L and G, respectively (Fig. 5A,B). As confirmed by time-series of bacterial productivity (Fig. 3C,D), bacterial production followed bacterial biomass more closely in batch L than in batch G.
Bacterial export rates (FCxp) were of the same order of magnitude as bacterial production. In batch G, F~xp peaks coincided with net increases of nanoflagellate numbers (days 9 and 14, Fig. 5D), but in batch L, a nanoflagellate peak did not coincide with high values of Fex p (day 11, Fig. 5C).
During the aggregation phase (day 11) in batch L, the residual mortality of bacteria observed in the < 2 p,m fraction was higher than the total (residual + grazing) mortality rates observed in the unfiltered fraction (Fig. 6). Such experi- mental bias suggested a dependence of free-living bacteria on dissolved organic matter released after hydrolysis of phytoplankton detritus by attached bacteria.
Trophic Transfer Calculations
Bacteria-Protozoan Class I, H, and III Relationships. Nanoflagellates of class I, II, and III were all feeding on bacteria and were combined to estimate their carbon
152 F. Van Wambeke 106 105 10 4 ~ unfiltered sample 0 sample filtered through 2 ~m at time o o o o o o o o , , , , i • , 50 lOO 150 200 hours
Fig. 6. Long term decrease in radioactivity in the cold TCA-insoluble fraction of a batch L sample after
[3H]thymidine incorporation, filtered (o) or not (e) through a 2-p,m filter at time zero. This bacterial mortality experiment was initiated on day 11 (during aggregation phase).
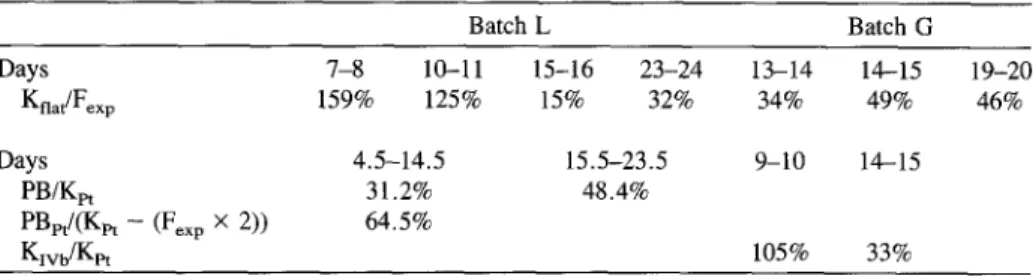
Table 1. Some estimates of carbon growth efficiencies based on characteristic ratios: K~ag/F~xp, nanoflagellates if feeding exclusively on bacteria; PB/Kr~, bacteria if feeding exclusively on all phytoplankton material; PB/[Kpt - (Fex p × 2 ) ] , bacteria if feeding exclusively on phytoplankton detri-
tal material that is not used by nanoflagellates; K l v b / K p t , protozoans of class IVb if feeding exclusively
on P. tricornutum. See results for assumptions and choice of time intervals considered. K f l a g , daily net
variation of nanoflagellate class I-II-III; F e x p , bacterial exportation flux; PB, bacterial production; Kpt,
daily net variation of P. tricornutum; Kxv b, daily net variation of nanoflagellate class IV b (all terms expressed in carbon units)
Batch L Batch G Days 7-8 10-11 15-16 23-24 13-14 14-15 19-20 Knat/Fexp 159% 125% 15% 32% 34% 49% 46% Days 4.5-14.5 15.5-23.5 PB/Kpt 31.2% 48.4% PBpt/(Kpt - (Fex p × 2)) 64.5% Klvb/Kpt 9-10 14-15 105% 33%
equivalent. Their g r o w t h efficiency, as reflected by the ratio Kflag/Fexp, was calcu- lated during daily intervals showing large protozoan n u m b e r increases (Table 1). T h e unrealistic ratios o f 159% and 125% obtained in batch L during the aggregation phase c o n f i r m e d that bacteria were not the exclusive diet for protozoans during this period. Nanoflagellates f r o m classes I, II, and III fed on free bacteria, but also on bacteria attached to phytoplankton. T h e y p r o b a b l y also engulfed aggregate detritus in their digestive vacuoles. Thus, considering this assumption and considering 40% as a reasonable g r o w t h yield for class I + II + III protozoans [11], it was estimated that bacteria w o u l d constitute only one-third (days 7 - 8 ) or one fourth (days 10-11) o f their carbon d e m a n d during the aggregation phase.
C o n v e r s e l y , values o f less than 50% were obtained for Kflag/Fex p ratios after this aggregation phase in batch L and o v e r the entire e x p e r i m e n t duration in batch G , and c o n f i r m e d that bacteria largely satisfied the carbon d e m a n d o f nanoflagellates (Table 1).
Phaeodactylum tricornutum-Bacteria Relationships. W h e n lysis was the m a i n degradative process, decaying P. tricornutum constituted the m a i n carbon source for bacteria. Thus, the ratio o f bacterial production to disappearing P. tricornutum
Phytoplankton Decay Mode and Microbial Trophodynamics 153
(PB/Kpt) constituted an estimate of the bacterial growth efficiency on available particulate material. PB/Ket calculated daily was highly variable during the experi- ment (n = 21; variation coefficient = 48%). To interpret these data, this ratio was estimated at two time intervals determined according to the microcosm evolution. The first interval (days 4.5-14.5) corresponded to the aggregation phase, and the second one (days 15.5-27.5) corresponded to a steady state in decomposition without visible aggregates. The integrated PB/Kpt ratios obtained were 31.2% and 48.4% for the first and the second phase, respectively (Table 1). If the fraction of detrital phytoplankton consumed directly by protozoa is taken into account (see
above: bacteria-protozoa relationships), the phytoplankton disappearing (Kpt) con-
stitute a carbon source for both bacteria and protozoans. Thus, the bacterial carbon
source equals Kpt minus carbon consumed by flagellates. I estimated (above) that
for one part of bacterial carbon (Fe×p), two other parts (Fex p × 2) should come from
phytoplankton detrital carbon to sustain nanoflagellate growth. Thus, the ratio PB/(Kpt - (Fex p × 2)) = 64.5% is an alternative estimate of bacterial growth effi- ciency during the aggregation phase (Table 1).
Discussion
Trophic Relationships
During phytoplankton grazing, a classic scheme of predator-prey successions
occurred. The two main trophic relationships, namely
P. tricornutum-protozoans
class IVb and bacteria-protozoans classes l, II, and III, were confirmed by the estimates of carbon growth efficiencies. In contrast, when the phytoplankton loss process was lysis, bacteria were not the exclusive diet.for protozoans. In this experiment, another carbon source participated in up to two-thirds of protozoan carbon demand during the aggregation phase.
During both the aggregation and disaggregation phases observed during phyto- plankton lysis, bacterial growth efficiencies on the available particulate material (PB/Kpt ratio) agreed with previously published data [30, 31, 35], with respect to fresh phytoplankton detritus or nutrient-enriched microcosms. Nevertheless these growth efficiencies increased with time, and this is in contradiction to two observa- tions: (1) the respiration percentage of glutamate increased during the experiment, and this amino acid is representative mainly of respiratory metabolism; and (2) the input of fresh algae was constant over time, but the degrading microcosms were not in a true steady state. Decomposition products that were refractory fractions proba- bly accumulated in the lysis batch L. Thus, the growth efficiency of bacteria should decrease with time, as the residual detrital material becomes more and more refractory [30, 31, 35].
Conversely, if a direct utilization of detrital phytoplankton by protozoans is taken into account, the bacterial growth efficiency would decrease from 64.5% during aggregation phase, to 48.4% during the disaggregation phase (Table 1). Such a decrease of bacterial growth efficiency is in agreement with the observations on glutamate respiration and lability of detrital material described above. But the bacterial carbon growth efficiency of 64.5% obtained in this way is out of the range of 10-45% obtained on fresh or nitrogen-rich phytoplankton detritus [30, 31, 35]. The true bacterial growth efficiency during the aggregation phase probably ranged
154 F. Van Wambeke between 31.2% and 65%. Effectively, the value of 65% was calculated, assuming (1) bacteria and phytoplankton detritus as sole carbon sources for protozoans and (2) a carbon growth efficiency of 40% for protozoans. Other sources of carbon for protozoans could also be present in aggregates. The ability of heterotrophic proto- zoans to incorporate colloids of different sizes has been demonstrated [39, 46]. Alternatively, protozoans could feed on bacterial exopolymer secretion, or on dissolved organic matter adsorbed on the detritus aggregate, as hypothesized by Decho [10]. Additionally, in phytoplankton aggregates, protozoan growth effi- ciency could be lower because of food excess [22]. Thus, the contribution of phytoplankton detritus as a food source for protozoans would be lower, and the bacterial growth efficiency on phytoplankton detritus would be lower.
These results demonstrated the "short-cut" of nanoflagellates in the food chain during the aggregation phase: their growth was sustained by attached bacteria and carbon sources included in phytoplankton-detritus aggregates.
Aminopeptidase Activity Sources and Controls
Both phytoplankton decaying modes, lysis and grazing, allowed bacteria to reach about the same productivities (0.03 h-1), although aminopeptidase activity devel- oped only in the presence of phytoplankton lysis. On the other hand, during the maximum intensity of bacterial grazing by protozoans, aminopeptidase activity increased. The development of this enzymatic activity had strong consequences on the bacterial metabolism. The hydrolyzed material constituted a new carbon source, and thus bacterial productivity increased by a factor of 3. Protozoan succession modified qualitatively and quantitatively organic substrates for bacterial growth. Thus, in the grazing batch, the bacterial productivity (P/B ratio) never reached steady-state.
When phytoplankton is lysed, algal envelope breakage is a preliminary step before leakage of intracellular metabolites. Therefore, attachment of bacteria on the phytoplankton cells is a necessary step to initiate exoenzyme induction [8], decom- position, and subsequent bacterial growth. Billen [4] explained the delayed growth of bacterioplankton with respect to phytoplankton at the end of blooms as a lag phase necessary to exoenzymatic activity development. Aminopeptidase activity per cell was then maintained at high levels for several days because the marked leakage of proteins probably contributed to modification of the kinetic parameters, Km and Vm [12, 15, 20]. Leakage of dissolved combined amino acids has been observed during zooplankton grazing on freshwater algae in a nutrient-enriched enclosure [9].
Growth of free-living bacteria was extremely dependent on the exoenzymatic activity of attached bacteria. Bacteria from 2-~zm filtered sea water exhibited high mortality rates (Fig. 6), suggesting their strong dependency on the small molecules hydrolyzed by attached bacteria. Such 'uncoupled solubilization' has also been hypothesized for copepod fecal pellets [25]. In the same way, in deep water masses bacteria attached to marine snow play an important role for the nutrition of free- living bacteria [43].
When grazing was the main phytoplankton loss process, the development of bacterial production and biomass was enhanced as soon as the inflow from the
Phytoplankton Decay Mode and Microbial Trophodynarnics 155
P. tricornutum culture was initiated. These bacteria used small molecules, as aminopeptidase activity did not develop during the first grazing phase by protozoa class IVb. Partially digested algal material contained in egested vacuoles, and direct protozoan excretion were the main sources of such small molecules.
The most interesting feature was the simultaneous increase of bacterial produc- tivity and aminopeptidase activity per cell when bacterial predation by protozoans appeared particularly active. Diverse positive feedback effects of predation may favor bacterial growth. These could include nutrient regeneration [7], dissolved organic matter excretion [29], bacteria maintained under substrate limitation [50], physiological youth [21], and a chemostat effect [42]. In addition, modification of kinetic parameters by a suddenly elevated concentration of proteins was a possible explanation for the increase in extracellular proteolytic activity per bacterium. When the albumin concentration rises from 10 to 100 ~g liter -1, the Vm of aminopeptidase increases by a factor of 5 [15]. In a previous experiment, the difference between the dissolved organic nitrogen and the dissolved free amino acids varied greatly (Van Wambeke, submitted). Assuming this difference to be composed mainly of proteins [3] and assuming 1 ~g N-protein equivalent to 6.25 ~g protein, protein fluctuations ranged from 150 to 535 ~g liter -1. Such protein variations could also arise during the bacterial grazing phase.
Release of dissolved combined amino acids by Paraphysomonas imperforata
was demonstrated by Nagata and Kirchman [29]. Assuming that growth carbon efficiencies and constitutive C/N ratio were equal for both protozoan classes, nanoflagellates feeding on nitrogen-rich bacteria had a better chance of releasing organic nitrogen (i.e., potential substrates for proteolytic exoenzymes) than class
IVb protozoans feeding on P. tricornutum (mean C/N ratio 7-8). This difference
may explain why aminopeptidase activity was not initiated during the P. tricornu-
tum grazing phase.
Although enzymatic regulation of kinetic parameters and taxonomic selection is a possible explanation for the instability of aminopeptidase activity per bacterium, others are microenvironmental conditions and richness of detrital material. Devel- opment of a noticeable aminopeptidase activity in an 0.2-p~m filtrate is generally described as a filtration artifact [18]. Dissolved enzymatic activity was sometimes observed [17, 19, 44], and has been attributed to lysed and senescent cells [8, 49]. It is also conceivable that tertiary and/or quatemary structures of enzymes were maintained in the colloidal material associated in the phytoplankton detritus-bacte- ria aggregates obtained, or in egested protozoan vacuoles [36]. Such enzymes could exhibit their activities for some time, as already observed in sediments [28].
In conclusion, a separation of phytoplankton lysis and grazing in an experimental approach permitted quantification of the fate of the phytoplankton detritus in the microbial food web. Lysis is associated with formation of aggregated phytodetri- tus, which indirectly enhanced bacterial productivity by sustaining extracellular aminopeptidase activity on a longer time scale. Additionally, these aggregates participated, alternatively with bacteria, in the diet of heterotrophic nanoflagel- lates. Thus, both free bacterial production and nanoflagellate production could be sustained by phytoplankton aggregates in the euphotic zone before their exportation via sinking. Bacteria benefited directly from the pre-digested material released during phytoplankton grazing, without the metabolic costs of phytoplankton break- down and exoenzymatic synthesis. In contrast, proteolysis activity increased during
156 F. Van Wambeke bacterial grazing by nanoflagellates, allowing a threefold increase in bacterial productivity.
Further experiments should focus on the capacity of each compartment of the food web to participate in phytoplankton loss (bacteria, protozoa, metazoa, and viruses) [6, 33, 45] to produce directly utilizable or potentially hydrolyzable sub- strates for bacterial growth. At the least, the actual importance of nonbacterial sources of aminopeptidase activity in phytoplankton-derived detritus (lysates, egested vacuoles) should be better evaluated.
Acknowledgments. I am grateful to J. Garcin for help during sampling, and F. Rassoulzadegan for identification of some protozoa. I thank L.-A. Meyer-Reil for providing comments on an earlier version of the manuscript, and A. Bianchi, M. Bianchi, D. Moriarty, and an anonymous reviewer for helpful critical comments.
References
1. Azam F, Fenchel T, Field JG, Gray JS, Meyer-Reil LA, Thingstad F (1983) The ecological role of water-column microbes in the sea. Mar Ecol Prog Ser 10:257-263
2. Biddanda BA, Pomeroy LR (1988) Microbial aggregation and degradation of phytoplankton- derived detritus in seawater I. Microbial succession. Mar Ecol Prog Ser 42:79-88
3. Billen G (1984) Heterotrophic utilization and regeneration of nitrogen. In: Hobbie JE, Williams PJ le B (eds) Heterotrophic activity in the sea. Plenum Press, New York, pp 313-355
4. Billen G (1990) Delayed development of bacterioplankton with respect to phytoplankton: a clue for understanding their trophic relationships. Arch Hydrobiol Beih Ergebn Limnol 34:191-201 5. Borsheim KY, Bratbak G (1987) Cell volume to cell carbon conversion factors for a bacterivorous
Monas sp. enriched from sea water. Mar Ecol Prog Set 36:171-175
6. Bratbak G, Heldal M, Norland S, Thingstad TF (1990) Viruses as partners in spring blooms in microbial trophodynamics. Appl Environ Microbiol 56:1400-1405
7. Caron DA, Goldman JC, Dennet MR (1988) Experimental demonstration of the roles of bacteria and bacterivorous protozoa in plankton nutrient cycles. Hydrobiologia 159:27-40
8. Chrost RJ (1990) Microbial ectoenzymes in aquatic environments. In: Overbeck J, Chrost R (eds) Aquatic microbial ecology, biochemical and molecular approaches. Springer-Verlag, pp 47-78 9. Chrost RJ, Rai H (1993) Ectoenzyme activity and bacterial secondary production in nutrient-
impoverished and nutrient-enriched freshwater mesocosms. Microb Ecol 25:131-150
10. Decho AW (1993) Microbial exopolymer secretions in ocean environments: their role(s) in food webs and marine processes. Oceanogr Mar Biol Annu Rev 28:73-154
11. FenchelT(1987)Ecology of protozoa. Thebiologyoffree-livingphagotrophicprotists. Springer- Verlag, Berlin
12. Fontigny A, Billen G, Vives-Rego J (1987) Some kinetic characteristics of exoproteolytic activity in coastal sea water. Est Coast Shelf Sci 25:127-133
13. Fuhrman JA, Azam F (1982) Thymidine incorporation as a measure of heterotrophic production in marine surface waters. Evaluation and field results. Mar Biol 66:109-120
14. Fukami K, Simidu U, Taga N (1981) Fluctuation of the communities of heterotrophic bacteria during the decomposition process of phytoplankton. J Exp Mar Biol Eco155:171-184
15. Halemejko GZ, Chrost RJ (1986) Enzymatic hydrolysis of proteinaceous particulate and dissolved material in an eutrophic lake. Arch Hydrobiol 107:1-21
16. Hansen L, Krog GF, Sondergaard M (1986) Decomposition of lake phytoplankton. 1. Dynamics of short-term decomposition. Oikos 46:37-44
17. Hashimoto S, Fujiwara K, Fiwa K, Saino T (1985) Distribution and characteristics of carboxypep- tidase activity in pond, river, and seawaters in the vicinity of Tokyo. Limnol Oceanogr 30:631- 645
Phytoplankton Decay Mode and Microbial Trophodynamics 157 18. Hoppe HG (1983) Significance of exoenzymatic activities in the ecology of brackish water:
measurements by means of methyl-umbelliferyl substrates. Mar Ec0! Prog Ser 11:299-308 19. Hoppe HG (1986) Relations between bacterial extracellular enzyme activities and heterotrophic
substrate uptake in a brackish water environment. In: GERBAM (ed) Actes de Colloques, 3, IFREMER-CNRS, 2~me Colloque International de BactEriologie Marine, Brest, pp 119-128 20. Hoppe HG, Kim S J, Gocke K (1988) Microbial decomposition in aquatic environments: combined
process of extracellular enzyme activity and substrate uptake. Appl Environ Microbio154:784-790 21. Johannes RE (1965) Influence of marine protozoa on nutrient regeneration. Lirnnol Oceanogr
10:434--442
22. Jumars PA, Penry DL, Baross JA, Perry MA, Frost BW (1989) Closing the microbial loop: dissolved carbon pathway to heterotrophic bacteria from incomplete ingestion, digestion, and absorption in animals. Deep Sea Res 36:483-495
23. Karner M, Fuks D, Herndl GJ (1992) Bacterial activity along atrophic gradient. Microb Ecol 24:243-257
24. Keller AA, Riebesell U (1989) Phytoplankton carbon dynamics during a winter-spring diatom bloom in an enclosed marine ecosystem: primary production, biomass, and loss rates. Mar Biol
103:131-142
25. Lawrence SG, Ahmad A, Azam F (1993) Fate of particle-bound bacteria ingested by Calanus
pacificus. Mar Ecol Prog Ser 97:299-307
26. Legendre L, Le F~vre J (1989) Hydrodynamical singularities as control of recycled versus export production in the oceans. In: Berger WH, Smetacek VS, Wefer G (eds) Dahlem workshop on productivity of the ocean, present and past. John Wiley & Son, Ltd., Berlin, pp 49--63
27. Lucas MI (1986) Decomposition in pelagic marine ecosystems. J Limnol Soc Sth Afr 12:99-122 28. Meyer Reil LA (1981) Enzymatic decomposition of proteins and carbohydrates in marine sedi-
ments. Methodology and field observations during spring. Kieler Meeresforsch, Sonderh 5:311- 317
29. Nagata T, Kirchman L (1991) Release of dissolved free and combined amino acids by bacteriv- orous marine flagellates. Limnol Oceanogr 36:433-443
30. Newell RC, Lucas ML, Linley EAS (1981) Rate of degradation and efficiency of conversion of phytoplankton debris by marine microorganisms. Mar Ecol Prog Ser 6:123-136
31. Newell RC, Linley EAS, Lucas ML (1983) Bacterial production and carbon conversion based on salt marsh plant debris. Est Coast Shelf Sci 17:405-419
32. Porter KG, Feig YS (1980) The use of DAPI for identifying and counting aquatic microflora. Limnol Oceanogr 25:943-948
33. Proctor LM, Fuhrman JA (1991 ) Role of viral infection in organic particle flux. Mar Ecol Prog Ser 69:133-142
34. Riemann B, Bj~rnsen PK, Newell S, Fallon R (1987) Calculation of cell production of coastal marine bacteria based on measured incorporation of [3H]thymidine. Limnol Oceanogr 32:471-476 35. Robinson JD, Mann KH, Novitsky JA (1982) Conversion of the particulate fraction of seaweed
detritus to bacterial biomass. Limnol Oceanogr 27:1072-1079
36. Rosso AL, Azam F (1987) Proteolytic activity in coastal oceanic waters: depth distribution and relationships to bacterial populations. Mar Ecol Prog Ser 41:231-240
37. Servais P, Billen G, Vives-Rego J (1985) Rate of bacterial mortality in aquatic environments. Appl Environ Microbio149:1448-1454
38. Sheldon RW, Rassoulzadegan F (1987) A method for measuring plankton production by particle counting. Mar Microb Food Webs 2:29--44
39. SherrEB (1988)Direct use of high molecular weight polysaccharides byheterotrophic flagellates. Nature 335:348-351
40. Sherr EB, Sherr BF (1983) Double staining epifiuorescence technique to assess FDC and bacteri- ovory in natural populations of heterotrophic microprotozoa. Appl Environ Microbiol 46:1388-- 1393
41. Simon M, Azam F (1989) Protein content and protein synthesis rates of planktonic marine bacteria. Mar Ecol Prog Ser 51:201-213
42. Sinclair JL, Alexander MA (1989) Effect of protozoan predation on relative abundance of fast- and slow-growing bacteria. Can J Microbio135:578-582
158 F. Van Wambeke 43. Smith DC, Simon M, Alldredge AL, Azam F (1992) Intense hydrolytic enzyme activity on marine
aggregates and implications for rapid dissolution, Nature 359:139-142
44. Somville M, Billen G (1983) A method for determining exoproteolytic activity in natural waters. Limnol Oceanogr 28:190-193
45. Suttle CA, Chan AM, Cottrel MT (1990) Infection of phytoplankton by viruses and reduction of primary productivity. Nature 347:467-469
46. Tranvik LJ, Sherr EB, Sherr BF (1993) Uptake and utilization of 'colloidal DOM' by hetero- trophic flagellates in seawater. Mar Ecol Prog Ser 92:301-309
47. Van Boekel WHM, Hansen FC, Riegman R, Bak RPM (1992) Lysis-induced decline of a
Phaeocystis spring bloom and coupling with the microbial food wed. Mar Ecol Prog Ser 81:269- 276
48. Van Wambeke F, Bianchi MA (1985) Dynamics of bacterial communities and qualitative evolu- tion of heterotrophic bacteria during the growth and decomposition processes of phytoplankton in an experimental marine ecosystem. J Exp Mar Biol Ecol 86:119-137
49. Vives-Rego J, Billen G, Fontigny A, Somville M (1985) Free and attached proteolytic activity in water environments. Mar Ecol Prog Set 21:245-249
50. Wright RT, Coffin RB (1984) Measuring microzooplankton grazing on planktonic marine bacteria by its impact on bacterial production. Microb Ecol 10:137-149