Determination of Acaricide Resistance in Rhipicephalus (Boophilus)
microplus (Acari: Ixodidae) Field Populations of Argentina, South
Africa, and Australia With the Larval Tarsal Test
L. LOVIS,1,2,3J. REGGI,4M. BERGGOETZ,1B. BETSCHART,1ANDH. SAGER2J. Med. Entomol. 50(2): 326Ð335 (2013); DOI: http://dx.doi.org/10.1603/ME12127
ABSTRACT Infestations with ticks have an important economic impact on the cattle industry worldwide and resistance to acaricides has become a widespread phenomenon. To optimize their treatment strategy, farmers need to know if and against which classes potential acaricide-resistance does occur. Bioassays are used to assess the resistance level and pattern of Rhipicephalus (Boophilus) microplus populations. The objective of the current study was to assess the susceptibility of Þeld populations originating from Argentina (8), South Africa (3), and Australia (2) using the Larval Tarsal Test. Nine acaricidal compounds from Þve major classes were tested: organosphosphates, synthetic pyrethroids (SP), macrocyclic lactones, phenylpyrazols, and amidines. The resistance ratios at concentrations inducing 50 and 90% mortality were used to detect established and emerging resistance. This study conÞrmed the newly reported presence of amitraz resistance in populations from Argentina. In addition, resistance to SP appeared to be widespread (88%) in the Argentinean farms, which had been selected based on the observation of lack of treatment efÞcacy by farmers. In South Africa one of the three populations was found to be resistant to SP and to a phenylpyrazol compound (pyriprol). Furthermore, resistance to organosphosphates and SP was observed in Australia. Finally, the Larval Tarsal Test proved to be a suitable test to evaluate the susceptibility of R. microplus Þeld populations to the most relevant acaricidal classes.
RESUMEN Las infestaciones por garrapatas tienen un importante impacto econo´mico en la industria del ganado de todo el mundo y la resistencia a los acaricidas se ha convertido en un feno´meno generalizado. Con el Þn de optimizar la estrategia de los tratamientos, los ganaderos necesitan saber en contra de cua´les clases de acaricidas ocurre esa potencial resistencia. Se utilizan bioensayos para evaluar el patro´n y nivel de resistencia de Rhipicephalus (Boophilus) microplus. El objetivo del presente estudio fue evaluar la suscep-tibilidad de poblaciones de campo procedentes de Argentina (8), Suda´frica (3) y Australia (2) usando la prueba del tarso de las larvas (LTT). Nueve compuestos acaricidas de cinco clases principales: organofos-forados (OP), piretroides sinte´ticos (SP), lactonas macrocõ´clicas (ML), fenilpirazoles (PYZ) y amidinas. Para detectar resistencia establecida y emergente, se calcularon niveles de resistencia basados en concentraciones que inducen mortalidad a 50% y 90%. Este estudio conÞrma la nueva denuncia de la presencia de resistencia al amitraz en las poblaciones de garrapatas de Argentina. Adema´s, la resistencia a SP parece estar muy difundida (88%) en los establecimientos argentinos, seleccionados sobre la base de la observacio´n de los ganaderos, de la falta de eÞcacia de los tratamientos. En Suda´frica, en una de las tres poblaciones, se encontro´ que era resistente a SP y a un compuesto PYZ (pyriprol). Adema´s, resistencia a OP y SP fue observada en Australia. Finalmente, la LTT ha demostrado ser un ensayo adecuado, para evaluar la susceptibilidad de poblaciones de campo de R. microplus a las clases acaricidas ma´s relevantes.
KEY WORDS Larval Tarsal Test, Rhipicephalus (Boophilus) microplus, Acaricide resistance, Argentina
Ticks are the major limiting factor to cattle husbandry in many tropical and sub-tropical areas and cause important economic losses (Graf et al. 2004). Among
them, the southern cattle tick Rhipicephalus
(Boophi-lus) microplus(Canestrini) has developed resistance to all the available classes of acaricides with the ex-ception of the growth regulators and the naturalytes (Kemp et al. 1998, FAO 2004, CastroÐJaner et al. 2011). North-Argentina is at the southern limit of its distri-bution in Latin America, and cattle ticks tend to spread toward south despite the current eradication program (dÕAgostino 2010). In 1992, nine million cattle were estimated to be infested with R. microplus ticks (Gug-lielmone 1992) and total losses were estimated to be This article is part of the Ph.D. of Leonore Lovis.
1University of Neuchaˆtel, Institute of Biology, Laboratory of Par-asitology, Rue EmileÐArgand 11, 2000 Neuchaˆtel, Switzerland.
2Novartis Animal Health Research Center, Chemin de la Petite Glaˆne, 1566 St-Aubin (FR), Switzerland.
3Corresponding author, e-mail: leonore.lovis@unine.ch. 4Novartis Animal Health, Ramallo 1851, Ciudad Auto´noma de Bue-nos Aires (C1429DUC), Argentina.
over 150 million United States dollars (Spa¨th et al. 1994). However, few reports of acaricide resistance in Argentina are available in the literature. Resistance to organophosphates (OP) was Þrst reported in the 1970s (Grillo Torrado and Gutie´rrez 1970, Grillo Torrado and Pe´rez Arrieta 1977) while synthetic pyrethroid (SP) resistance was Þrst identiÞed in 1996 in Argen-tina (Caracostanto´golo et al. 1996) and then repeat-edly reported in the 2000s (Mangold et al. 2004, Gug-lielmone et al. 2006). The Þrst case of amitraz resistance was very recently described in the province of Corrientes (Cutulle´ et al. 2013). There is also only little information available on acaricide-resistance of
R. microplusin South Africa. Its resistance to OP was Þrst reported in 1979 (Baker et al. 1979). Later, resis-tance to SP and to amitraz have also been identiÞed in
Boophilusspp., Þrstly without distinction of the spe-cies (Kemp et al. 1998, Strydom and Peter 1999, de Bruin 1999) and in 2008 in R. microplus (Ntondini et al. 2008). In Australia, R. microplus was introduced accidentally with imported cattle, probably before 1870 (Angus 1996, Graf et al. 2004) and spread since then to the northern and the eastern part of the coun-try (Cutulle´ et al. 2009). Acaricide resistance in Aus-tralia is well documented. Resistance to OP appeared in the mid-1960s (Shaw and Malcolm 1964, Shaw 1966, Roulston et al. 1968) and was widespread by the mid-1970s (Roulston et al. 1981). Resistance to SP ap-peared in the late 1980s (Nolan et al. 1989) and in-creased rapidly (Kemp et al. 1998, Jonsson et al. 2000). In comparison, amitraz resistance, which appeared in the early 1980s (Nolan 1981), spread in Australia much more slowly (Kemp et al. 1998, Jonsson et al. 2000, Jonsson and Hope 2007). To our knowledge, no re-sistance to macrocyclic lactones (ML) or phenylpyra-zol (PYZ) compounds has ever been reported in any of these three countries.
Various bioassays are used to evaluate tick suscep-tibility, such as the adult immersion test (AIT) (FAO 2004), the larval packet test (LPT) (FAO 2004) and the larval immersion test (LIT) (Shaw 1966, Sabatini et al. 2001). More recently a new bioassay, the larval tarsal test (LTT), was developed and compared with the LPT and was shown to be equally sensitive to detect resistance to coumaphos, SP and amitraz (Lovis et al. 2011). The advantage of the LTT is to allow testing a large number of compounds and doses in
little time and with a small number of engorged fe-males.
The objective of the current study was to apply the LTT to Þeld populations originating from Argentina, South Africa, and Australia to assess their susceptibil-ity to nine compounds from Þve major classes (OP, SP, ML, PYZ, and amidines).
Materials and Methods
Tick Strains. The Mun˜oz strain was used as the susceptible reference strain. This strain was collected during an outbreak in Zapata County, Texas, in 1999. It was then established and reared without acaricide selection at the Cattle Fever Tick Research Labora-tory (CFTRL), Edinburg, TX. Some larvae of the F48 generation were transferred to the Novartis Animal Health Research Center (CRA), St-Aubin, Switzer-land in 2010 to establish a colony. Ticks used for the bioassays were from F49 and F50 generations.
Engorged females were collected in Argentina, South Africa, and Australia and were shipped to Swit-zerland for in vitro testing at CRA. ARGENTINA: In November 2010, eight R. microplus samples were col-lected from seven beef cattle farms of the province of Corrientes, northÐ east Argentina where farmers were complaining about some lack of treatment efÞcacy. The samples contained 13Ð 41 engorged females col-lected from 6 to 15 infested cows and were originating from the following four municipalities: Loreto (ST27), Saladas (ST21, ST22), Santo Tome´ (ST24, ST26, ST29, and ST30), and Virasoro (ST25) (Fig. 1A). Ticks from ST21 and ST22 were considered as two separate pop-ulations although they were collected on the same farm. The cattle from which the ticks were collected were geographically remote and had been treated with compounds of distinct acaricidal classes. SOUTH AFRICA: In February and April 2010, three samples of 10 Ð 40 engorged females of R. microplus were ob-tained from South Africa. R. microplus was morpho-logically differentiated from Boophilus decoloratus (Koch) at collection using a stereomicroscope (Walker et al. 2003). Two samples were collected from cattle held on communal lands where cattle belong to several owners, as it is common in the local African traditions (Pleetenberg Bay area, Western Cape (ST11) and Eglington, Hluvukani area, Mpumalanga (ST15). The
Fig. 1. Locations of the populations collected in (A) Argentina (Province of Corrientes), (B) South Africa (Provinces of Western Cape and Mpumalanga), and (C) Australia (State of Queensland).
third population (ST12) originated from a commercial beef cattle farm located in Pleetenberg Bay, Western Cape (Fig. 1B). Populations originating from South Africa and Argentina were intended to be tested in vitro on arrival in Switzerland without being previ-ously maintained on calves. AUSTRALIA: In February 2009, engorged females of R. microplus were collected in two beef cattle farms from Mount-Urah and Curra municipalities, Queensland, Australia (Fig. 1C) and shipped to the CRA to establish a colony that was maintained without acaricide selection. F3 and F4 generations were used for in vitro testing of the Urah and Curra strain, respectively.
For the shipment, engorged females were placed in glass tubes with meshed lids hold in a soft structure and kept in a polystyrene box containing a piece of cloth soaked with distilled water to ensure sufÞcient humidity. The polystyrene box was placed in a foamed box protected by a cardboard. On arrival in the CRA, ticks were moved to larger containers and maintained at 28⫾ 1⬚C and 80% relative humidity (RH) to com-plete oviposition. Eggs were used for in vitro testing around a week before hatching (F1 generation). For two strains (ST11 and ST12), the use of perforated Falcon tubes instead of glass tubes negatively im-pacted the preservation of the eggs laid during ship-ment. On arrival in the CRA, the remaining healthy eggs were allowed to hatch and larvae were used to infest a calf. The resulting engorged females produced a sufÞcient number of healthy eggs (F2 generation) for in vitro testing.
Acaricides. Technical grade coumaphos (OP), di-azinon (OP), cypermethrin (SP), ßumethrin (SP), ivermectin (ML), moxidectin (ML), Þpronil (PYZ), pyriprol (PYZ), and amitraz were used in this study. Details on these compounds are available in Lovis et al. (2011). Technical grade compounds were dissolved in dimethyl sulfoxide (DMSO; Fluka, Switzerland) to prepare stock solutions at 20,000 parts per million (ppm).
Larval Tarsal Test (LTT). The LTT was carried out as described previously (Lovis et al. 2011). Brießy, 20 l of a coating solution containing 100% ethanol and 0.25% of olive oil (SigmaÐAldrich, Fluka, Switzerland) was dispensed into each well of ßat bottom 96-well plates (NUNC, Catalog No. 260836, Denmark) and ethanol was allowed to evaporate overnight under a fume hood. Then, a top dose of each acaricidal com-pound was prepared in DMSO from the stock solution and 12 two-fold dilutions were subsequently prepared. A volume of 5l of each dilution was dispensed on the bottom of the corresponding wells of the microtiter plates, that is, a concentration of 566 ppm corre-sponded to 100 mg/m2. The upper and lower rows as
well as one of the inner rows of the plates always contained 5l of DMSO only. This set-up allowed testing Þve compounds per plate and each concen-tration was tested in triplicates on three separate plates. The inner rows containing only DMSO were used as a control. DMSO was evaporated either by using an N2sampler concentrator (Techne DB-3
Dri-Block, Witec AG, Switzerland) or a centrifugal
vac-uum concentrator (SC21017 SpeedVac Plus, Thermo-Savant).
Plates were used for testing within 3 d after prep-aration. Around 50 eggs were distributed per well using a seed counter (elmor, Switzerland). Plates were incubated for 24 h at 28⫾ 1⬚C and ⬇95% RH before being sealed with a transparent sealing Þlm (VIEWseal, Greiner bio-one, Switzerland). Sealed plates were then placed at 28⫾ 1⬚C and 70Ð80% RH. Plates were removed from the environmental cham-ber around 2 wk after hatching and larval mortality was evaluated by counting dead or alive larvae using a stereomicroscope. Larval motility and global appear-ance were used as criteria to assess mortality.
The Argentinean populations were all tested with the nine selected compounds except ST30 that was tested with only one compound of each class because of a limited number of ticks available. The Australian and South African populations were tested with the same nine compounds except diazinon that was not tested. All the compounds were tested at the same concentration range (0.05Ð100 mg/m2) for the two
Australian strains. This range was adapted for the Argentinean and South African populations and the following concentrations were tested: Þpronil, ßu-methrin, pyriprol: 0.003Ð 6.25 mg/m2; moxidectin:
0.05Ð100 mg/m2; ivermectin: 0.05Ð100 or 0.2Ð 400
mg/m2; cypermethrin: 0.2Ð 400 mg/m2; amitraz: 0.1Ð
200 or 0.4 Ð 800 mg/m2; coumaphos, diazinon: 0.4 Ð
800 mg/m2.
Statistical Analysis. Data were entered in Excel soft-ware (Microsoft OfÞce 2003) and transferred to In-tercooled STATA release 11.0 (StataCorp, College Station, TX). All mortality values were normalized by the mortality of the DMSO control wells using Ab-bottÕs formula (Abbott 1987). Outer wells of the mi-croplates with increased mortality because of edge effects in plates were removed. The R software (ver-sion 2.12.0) was used for statistical analysis using the drc package (version 2.0 Ð1), speciÞc for modeling doseÐresponse curves (Ritz and Streibig 2005). Dose-mortality data were modeled using a Þve-parameter log-logistic function (drm command) with the lower and upper limits locked at 0 and 100, respectively. Doses inducing 50% mortality (LC50), LC90, and LC99
and their 95% CI were estimated with the ED com-mand using the delta option. Resistance ratios based on the LC50(RR50) and on the LC90(RR90) were
calculated in reference to the susceptible Mun˜oz strain using the SI command and the delta interval for their 95% CI. Resistance ratios were considered sig-niÞcant if their 95% CI did not include 1. Three classes based on RR values were created to emphasize the increasing resistance intensity. Populations were con-sidered susceptible to a speciÞc compound when the RR was smaller or equal to 4, moderately resistant for 4⬍ RR ⱕ10 and highly resistant for RR ⬎10. Potential discriminating doses (DD) were calculated as 2 ⫻ LC99of the susceptible reference strain (Jonsson et al.
2007). The survival rates of the Þeld strains at the DD were predicted using the PR command. Discriminat-ing doses were not generated for amitraz as the use of
a single DD is not recommended for this compound (FAO 2004, Jonsson et al. 2007, Lovis et al. 2011).
Results
Doses inducing 50 and 90% mortality as well as their 95% CI are displayed in Tables 1Ð5. The susceptible Mun˜oz strain was used as reference for comparison with the Þeld populations and RR50, RR90 as well as their 95% CI are also available (Tables 1Ð5). In addi-tion, Tables 1Ð 4 include the survival rates of the Þeld populations at the DD.
The 95% CI of LC90and of RR90 were wider than
those calculated for LC50and RR50. Resistance
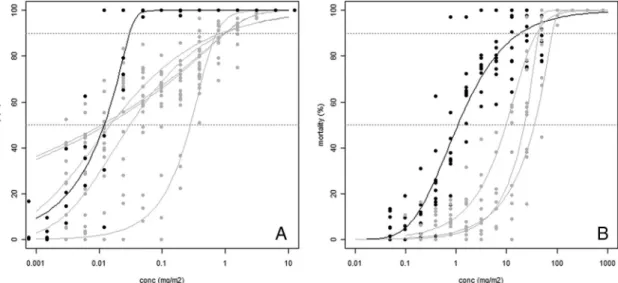
sta-tuses were, therefore, established based on RR50, and then compared in the discussion to those based on RR90. Some discrepancy was observed between the ability of the two estimates to detect resistance in case of absence of parallelism between the doseÐresponse curves of the Þeld populations and the reference strain as illustrated in Fig. 2 for ßumethrin and amitraz.
Resistance Status by Country Based on RR50. In Argentina, one case of moderate resistance to diazinon (RR50 ⫽ 5.4, 4.7Ð6.1) was recorded, while all the populations were susceptible to coumaphos. Resis-tance to SP was the most common. Cypermethrin resistance was detected in all the populations except one (88%) with RR50 ranging from 4.2 (2.5Ð5.9) to 57.0 (37.5Ð76.5). In addition, two of these populations also demonstrated resistance to ßumethrin based on RR50. Finally, all the Argentinean populations were shown to be susceptible to ML and PYZ, while resis-tance to amitraz was observed in three of the eight populations (38%) with RR50 ranging between 9.0 (5.9 Ð12.1) and 32.5 (24.1Ð 40.8). Analysis of the three populations originating from South Africa revealed that two of them (ST11, ST12) were susceptible to all compounds while the third one (ST15) was consid-ered as highly resistant to SP (RR50⫽ 101.5, 72.4Ð 130.6) and moderately resistant to pyriprol (RR50⫽ 9.9, 6.0 Ð13.9). Finally the two Australian populations showed similar resistance proÞles to the nine tested compounds, both being moderately resistant to cou-maphos and highly resistant to SP while they were susceptible to all other compounds.
Discriminating Doses. Survival rates at the DD of the resistant populations (based on RR50) were all ⬎10%, ranging from 16.1 to 87.1%. A single exception was observed with ST27 when tested with diazinon (5.2% survival at DD). Survival rates at the DD of the susceptible populations (based on RR50) were below 10% with the following Þve exceptions out of 108 tests: ST30 tested with coumaphos (15.2% survival at DD); ST22, ST25, ST26, and ST27 tested with ßumethrin (survival rates between 26.1 and 34.5% at DD).
Discussion
The concentrations of the acaricidal compounds that were tested in this study were suitable to calculate LC50and LC90of susceptible and resistant populations
in 97% of the tests. The remaining 3% consisted of :
Table 1. Lethal concentrations (LC 50 and LC 90 ) with their 95% CI obtained for the 8 Argentinean (ST21-ST30), 3 South African (ST11-ST15), and 2 Australian (Curra, Urah) field strains of R. microplus as well as their RR in comparison to the susceptible reference strain (Muñoz) and their survival rates at the DD when tested with coumaphos and diazinon Country Strain Coumaphos Diazinon LC 50 (95% CI) RR at LC 50 (95% CI) LC 90 (95% CI) RR at LC 90 (95% CI) PR a LC 50 (95% CI) RR at LC 50 (95% CI) LC 90 (95% CI) RR at LC 90 (95% CI) PR a Mun ˜oz 2.4 (2.2Ð2.6) 5.4 (3.9Ð6.9) 5.0 (4.6Ð5.5) 10.8 (8.6Ð13.1) ARG ST21 4.6 (3.6Ð5.5) 1.9 (1.5Ð2.4) 13.3 (5.1Ð21.5) 2.5 (0.8Ð4.1) 2.2 9.8 (8.7Ð10.9) 1.9 (1.7Ð2.2) 17.9 (13.6Ð22.2) 1.7 (1.2Ð2.1) 0.3 ST22 6.6 (5.1Ð8) 2.8 (2.2Ð3.3) 17.0 (5.3Ð28.7) 3.2 (1.2Ð5.1) 3.6 13.0 (11.8Ð14.2) 2.6 (2.3Ð2.9) 20.0 (11.1Ð29.0) 1.9 (1.1Ð2.7) 0.1 ST24 3.5 (2.7Ð4.4) 1.5 (1.1Ð1.9) 21.6 (8.3Ð35.0) 4.1 (1.3Ð6.8) 7.4 8.9 (7.9Ð9.9) 1.8 na 17.2 (13.8Ð20.6) 1.6 na 0.3 ST25 4.1 (3.4Ð4.8) 1.7 (1.3Ð2.1) 14.3 (7.7Ð20.9) 2.7 (1.1Ð4.3) 3.5 10.6 (10.2Ð11.0) 2.1 (1.7Ð2.4) 14.0 (12.2Ð15.7) 1.4 (0.8Ð1.9) 0.0 ST26 6.1 (4.5Ð7.7) 2.7 na 14.2 (5.2Ð23.1) 2.4 (2.1Ð2.8) 0.7 15.4 (13.8Ð17.1) 3.6 (3.1Ð4) 22.4 (16.7Ð28.1) 2.3 (1.8Ð2.7) 0.1 ST27 4.6 (3.6Ð5.6) 1.9 (1.4Ð2.4) 8.7 (4.1Ð13.2) 1.6 (0.6Ð2.7) 0.1 27.3 (24.8Ð30.0) 5.4 (4.7Ð6.1) 46.8 (35.1Ð58.5) 4.3 (2.9Ð5.8) 5.2 ST29 3.1 (2.6Ð3.7) 1.3 (1Ð1.6) 9.7 (5.0Ð14.4) 1.8 (0.7Ð2.9) 1.7 6.5 (5.7Ð7.3) 1.3 (1.1Ð1.4) 10.9 (6.2Ð15.6) 1.0 (0.6Ð1.4) 0.0 ST30 5.1 (4.0Ð6.2) 2.1 (1.5Ð2.7) 49.9 (18.6Ð81.2) 9.2 (1.6Ð16.8) 15.2 na na na na na na na na na SAFR ST11 4.7 (3.4Ð6.1) 2.0 (1.1Ð2.9) 9.4 (4.1Ð14.7) 1.7 (⫺ 0.4Ð3.8) 0.0 na na na na na na na na na ST12 5.6 (4.5Ð6.7) 2.3 (1.8Ð2.9) 9.7 (6.0Ð13.4) 1.8 (0.9Ð2.8) 0.0 na na na na na na na na na ST15 5.6 (4.0Ð7.3) 2.4 (1.8Ð3) 21.1 (4.8Ð37.4) 3.9 (1.3Ð6.5) 6.4 na na na na na na na na na AUS Curra 15.2 (9.4Ð21.1) 6.4 (4.3Ð8.5) 85.7 (⫺ 5.6Ð177) 16.0 (1.5Ð30.5) 29.7 na na na na na na na na na Urah 13.5 (9.7Ð17.2) 5.6 (3.9Ð7.3) 40.0 (25.9Ð54.2) 7.5 (4Ð10.9) 24.1 na na na na na na na na na Concentrations are expressed in mg/m 2. na, not available. aPredicted survival rates at the potential discriminating doses (2 ⫻ LC 99 of the susceptible reference Mun ˜oz strain).
Table 2. Lethal concentrations (LC 50 and LC 90 ) with their 95% CI obtained for the 8 Argentinean (ST21-ST30), 3 South African (ST11-ST15), and 2 Australian (Curra, Urah) field strains of R. microplus as well as their RR in comparison to the susceptible reference strain (Mun ˜oz) and their survival rates at the DD when tested with cypermethrin and flumethrin Country Strain Cypermethrin Flumethrin LC 50 (95% CI) RR at LC 50 (95% CI) LC 90 (95% CI) RR at LC 90 (95% CI) PR a LC 50 (95% CI) RR at LC 50 (95% CI) LC 90 (95% CI) RR at LC 90 (95% CI) PR a Mun ˜oz 0.51 (0.42Ð0.6) 2.2 (0Ð2.2) 0.01 (0.01Ð0.014) 0.030 (0.023Ð0.038) ARG ST21 0.87 (0.63Ð1.1) 1.7 (1Ð2.4) 4.7 (3.4Ð6) 2.1 (0.9Ð3.3) 0.0 ⬍ 0.003 b na ⬍ 1 n a 0.006 (0.004Ð0.009) 0.2 na 0.0 ST22 3.5 (2.1Ð4.9) 6.8 (3.7Ð10) 48.3 (10.4Ð86.1) 21.7 (2.5Ð40.9) 20.5 0.01 (0.001Ð0.025) 1.2 (0.3Ð2) 1.01 (0.27Ð1.76) 36.5 (2.7Ð70.3) 34.5 ST24 13.8 (8.6Ð18.9) 27.2 (15.4Ð39.1) 68.0 (28.3Ð108) 30.2 (8.8Ð51.6) 40.5 0.27 (0.186Ð0.35) 21.8 (14.3Ð29.2) 1.38 (0.67Ð2.1) 46.3 (19.5Ð73.1) 67 .2 ST25 3.4 (1.5Ð5.2) 6.6 (4Ð9.3) 36.6 (⫺ 2.7Ð75.9) 16.4 (3.2Ð29.5) 16.7 0.03 (0.019Ð0.043) 2.5 (1.7Ð3.4) 0.98 (⫺ 0.08Ð2.04) 31.3 (5Ð57.7) 31.9 ST26 2.9 (2.2Ð3.6) 5.6 (3.4Ð7.9) 51.0 (20.4Ð81.6) 23.2 (2.3Ð44.2) 18.2 0.02 (0.01Ð0.02) 1.3 (0.8Ð1.7) 0.85 (0.16Ð1.54) 27.8 (2.2Ð53.5) 26.1 ST27 2.2 (1.7Ð2.6) 4.2 (2.5Ð5.9) 43.4 (18.2Ð68.7) 19.4 (1.3Ð37.4) 16.1 0.01 (0.002Ð0.02) 0.9 (0.2Ð1.6) 0.97 (0.28Ð1.67) 32.2 (8.8Ð55.6) 33.4 ST29 29.1 (21Ð37.1) 57.0 (37.5Ð76.5) 68.7 (39.7Ð97.7) 30.8 (13.3Ð48.4) 67.4 0.28 (0.229Ð0.333) 23.0 (16.7Ð29.3) 0.73 (0.44Ð1.02) 24.0 (11.4Ð36.6 ) 83.1 ST30 10.6 (3.2Ð18) 21.5 (10.1Ð32.9) 274.1 (⫺ 146Ð694) 116.2 (⫺ 7.2Ð240) 41.2 na na na na na na na na na SAFR ST11 1.1 (0.66Ð1.62) 2.3 (1.2Ð3.3) 4.6 (1.6Ð7.7) 2.1 (0.5Ð3.6) 0.3 ⬍ 0.05 c na ⬍ 4n a ⬍ 0.05 c na ⬍ 1.6 na 0.0 ST12 0.85 (0.66Ð1.05) 1.7 (0.9Ð2.5) 3.0 (1.9Ð4.2) 1.4 (0.2Ð2.5) 0.1 ⬍ 0.05 c na ⬍ 4n a ⬍ 0.05 c na ⬍ 1.6 na 0.0 ST15 51.5 (42.6Ð60.4) 101.5 (72.4Ð131) 98.0 (83.8Ð112) 43.7 (24.8Ð62.5) 79.4 0.61 (0.496Ð0.729) 51.9 (36.9Ð66.8) 1.45 (1.11Ð1.783) 46.1 (29.9Ð62 .3) 87.1 AUS Curra 4.4 (3.6Ð5.3) 8.7 (5.3Ð12) 84.2 (38.4Ð130) 38.3 (⫺ 0.1Ð76.6) 23.7 0.27 (0.215Ð0.329) 23.0 (14.3Ð31.8) 1.63 (1.07Ð2.19) 51.5 (22Ð80.9) 67.2 Urah 17.2 (11.7Ð22.7) 33.9 (23.7Ð44.1) 109.8 d (62.9Ð157) 48.8 (24.6Ð73.1) 47.9 0.52 (0.418Ð0.613) 43.4 (32.1Ð54.6) 1.83 (1.34Ð2.32) 58.3 (38.2Ð78.5) 78.0 Concentrations are expressed in mg/m 2. na, not available. aPredicted survival rates at the potential discriminating doses (2 ⫻ LC 99 of the susceptible reference Mun ˜oz strain). bMortality of 77% at the lowest dose tested (0.003 mg/m 2). cNo survival at the lowest dose tested (0.05 mg/m 2). dEstimate based on extrapolation (highest dose tested 100 mg/m 2).
Table 3. Lethal concentrations (LC 50 and LC 90 ) with their 95% CI obtained for the 8 Argentinean (ST21-ST30), 3 South African (ST11-ST15), and 2 Australian (Curra, Urah) field strains of R. microplus as well as their RR in comparison to the susceptible reference strain (Mun ˜oz) and their survival rates at the DD when tested with ivermectin and moxidectin Country Strain Ivermectin Moxidectin LC 50 (95% CI) RR at LC 50 (95% CI) LC 90 (95% CI) RR at LC 90 (95% CI) PR a LC 50 (95% CI) RR at LC 50 (95% CI) LC 90 (95% CI) RR at LC 90 (95% CI) PR a Mun ˜oz 1.12 (0.84Ð1.4) 5.6 (1.6Ð9.7) 0.37 (0.29Ð0.45) 1.47 (0.75Ð2.19) ARG ST21 2.03 (0.98Ð3.07) 1.8 (0.8Ð2.9) 8.1 (⫺ 1.6Ð17.9) 1.4 (⫺ 0.9Ð3.7) 0.2 0.39 (0.19Ð0.6) 1.1 (0.6Ð1.6) 1.96 (0.75Ð3.18) 1.4 (0.5Ð2.3) 0.0 ST22 1.38 (0.88Ð1.88) 1.2 (0.6Ð1.9) 3.2 (2Ð4.3) 0.5 (⫺ 0.3Ð1.3) 0.0 0.89 (0.48Ð1.29) 2.4 (1.9Ð2.9) 10.08 (⫺ 0.78Ð20.95) 6.6 (3Ð10.2) 8.1 ST24 0.97 (0.81Ð1.13) 0.9 (0.4Ð1.4) 2.5 (1.5Ð3.6) 0.4 (⫺ 0.3Ð1.2) 0.0 1.25 (0.84Ð1.67) 3.4 (2.3Ð4.5) 3.35 (2.05Ð4.65) 2.3 (1.1Ð3.5) 0.0 ST25 0.38 (0.22Ð0.53) 0.3 (0.1Ð0.6) 2.4 (⫺ 0.6Ð5.5) 0.4 (⫺ 0.4Ð1.2) 0.2 0.32 (0.17Ð0.47) 0.9 (⫺ 0.1Ð1.9) 1.06 (0.28Ð1.85) 0.7 (⫺ 0.5Ð1.9) 0.0 ST26 0.78 (0.61Ð0.96) 0.7 (0.3Ð1.1) 1.8 (1.1Ð2.5) 0.3 (⫺ 0.2Ð0.8) 0.0 0.40 (0.34Ð0.46) 1.1 (0.7Ð1.5) 0.86 (0.65Ð1.07) 0.6 (0.2Ð1) 0.0 ST27 0.39 (0.3Ð0.49) 0.4 (0.2Ð0.6) 0.74 (0.6Ð0.9) 0.1 (⫺ 0.1Ð0.3) 0.0 0.17 (0.11Ð0.24) 0.5 (0.2Ð0.8) 1.25 (0.21Ð2.28) 0.8 (⫺ 0.4Ð1.9) 0.2 ST29 0.91 (0.68Ð1.14) 0.8 (0.4Ð1.3) 3.8 (1Ð6.6) 0.7 (⫺ 0.4Ð1.8) 0.2 0.29 (0.26Ð0.32) 0.8 (0.6Ð1) 0.58 (0.43Ð0.73) 0.4 (0.2Ð0.6) 0.0 ST30 0.77 (0.51Ð1.03) 0.7 (0.2Ð1.2) 5.4 (0.2Ð10.5) 0.9 (⫺ 0.9Ð2.8) 0.6 na na na na na na na na na SAFR ST11 2.14 (1.47Ð2.81) 1.9 (1.4Ð2.5) 4.0 (1Ð7) 0.7 na 0.0 0.81 (0.61Ð1) 2.2 (1.6Ð2.8) 1.49 (1.09Ð1.89) 1.0 (0.6Ð1.5) 0.0 ST12 1.15 (0.69Ð1.61) 1.0 (0.6Ð1.5) 4.7 (⫺ 1.1Ð10.4) 0.8 (⫺ 0.2Ð1.8) 0.2 0.67 (0.55Ð0.8) 1.8 (1.3Ð2.4) 1.61 (1.27Ð1.94) 1.1 (0.6Ð1.6) 0.0 ST15 2.82 (0.72Ð4.93) 2.5 (1.3Ð3.7) 39.4 (⫺ 36.6Ð115.5) 6.8 (⫺ 0.9Ð14.4) 6.2 0.25 (0.22Ð0.29) 0.7 (0.5Ð0.9) 0.52 (0.31Ð0.74) 0.4 (0.1Ð0.6) 0.0 AUS Curra 0.53 (⫺ 0.01Ð1.07) 0.5 (0Ð0.9) 17.5 (⫺ 4.7Ð39.8) 3.3 (⫺ 0.3Ð6.8) 0.9 0.09 (0.06Ð0.12) 0.3 (0.1Ð0.4) 0.84 (0.2Ð1.48) 0.6 (0Ð1.2) 0.8 Urah 0.49 (0.27Ð0.71) 0.4 (0.1Ð0.8) 5.0 (2.9Ð7.2) 0.9 (0.4Ð1.3) 0.0 0.16 (0.1Ð0.22) 0.4 (0.2Ð0.7) 0.72 (0.49Ð0.95) 0.5 (0.2Ð0.8) 0.0 Concentrations are expressed in mg/m 2. na, not available. aPredicted survival rates at the potential discriminating doses (2 ⫻ LC 99 of the susceptible reference Mun ˜oz strain). Table 4. Lethal concentrations (LC 50 and LC 90 ) with their 95% CI obtained for the 8 Argentinean (ST21-ST30), 3 South African (ST11-ST15), and 2 Australian (Curra, Urah) field strains of R. microplus as well as their RR in comparison to the susceptible reference strain (Mun ˜oz) and their survival rates at the DD when tested with fipronil and pyriprol Country Strain Fipronil Pyriprol LC 50 (95% CI) RR at LC 50 (95% CI) LC 90 (95% CI) RR at LC 90 (95% CI) PR a LC 50 (95% CI) RR at LC 50 (95% CI) LC 90 (95% CI) RR at LC 90 (95% CI) PR a Mun ˜oz 0.04 (0.032Ð0.04) 0.07 (0.051Ð0.092) 0.04 (0.039Ð0.049) 0.12 (0.09Ð0.15) ARG ST21 0.04 (0.034Ð0.053) 1.2 (1Ð1.5) 0.09 (0.049Ð0.128) 1.2 (0.7Ð1.8) 0.2 0.03 (0.023Ð0.038) 0.7 (0.5Ð0.9) 0.06 (0Ð0.12) 0.5 (0.1Ð1) 0.0 ST22 0.04 (0.026Ð0.059) 1.2 (0.9Ð1.5) 0.13 (0.037Ð0.219) 1.8 (0.9Ð2.7) 0.4 0.07 (0.05Ð0.086) 1.6 (1.1Ð2) 0.18 (0.09Ð0.27) 1.5 (0.8Ð2.3) 0.1 ST24 0.04 (0.032Ð0.038) 1.0 (0.8Ð1.1) 0.07 (0.052Ð0.077) 0.9 (0.5Ð1.3) 0.2 0.04 (0.02Ð0.054) 0.9 (0.4Ð1.3) 0.12 (0.04Ð0.21) 1.0 (0.3Ð1.8) 0.5 ST25 0.03 (0.021Ð0.03) 0.7 (0.5Ð0.9) 0.06 (0.041Ð0.079) 0.8 (0.5Ð1.2) 0.0 0.03 (0.023Ð0.043) 0.8 (0.5Ð1) 0.13 (0.06Ð0.2) 1.1 (0.5Ð1.7) 0.6 ST26 0.06 (0.048Ð0.062) 1.5 (1.2Ð1.9) 0.10 (0.088Ð0.118) 1.4 (1Ð1.9) 0.0 0.05 (0.043Ð0.056) 1.1 (0.9Ð1.4) 0.14 (0.09Ð0.18) 1.2 (0.5Ð1.8) 0.3 ST27 0.04 (0.025Ð0.044) 1.0 (0.7Ð1.3) 0.09 (0.052Ð0.136) 1.3 (0.6Ð2.1) 1.0 0.02 (0.018Ð0.027) 0.5 (0.4Ð0.6) 0.06 (0.03Ð0.09) 0.5 (0.2Ð0.8) 0.1 ST29 0.05 (0.042Ð0.061) 1.4 (1.1Ð1.8) 0.14 (0.087Ð0.201) 2.0 (0.9Ð3.1) 3.4 0.11 (0.088Ð0.129) 2.5 (1.8Ð3.1) 0.22 (0.15Ð0.3) 1.9 (1Ð2.8) 0.1 ST30 0.03 (0.027Ð0.042) 1.0 (0.7Ð1.2) 0.11 (0.079Ð0.14) 1.5 (0.9Ð2.1) 0.0 na na na na na na na na na SAFR ST11 0.06 (0.052Ð0.063) 1.6 (1.3Ð1.9) 0.10 (0.092Ð0.116) 1.5 (1.1Ð1.8) 0.0 0.1 (0.069Ð0.124) 2.2 (1.6Ð2.8) 0.22 (0.07Ð0.37) 2.0 (0.9Ð3) 0.0 ST12 0.03 (0.022Ð0.045) 1.0 (0.7Ð1.2) 0.08 (0.046Ð0.116) 1.2 (0.8Ð1.5) 0.0 0.05 (0.034Ð0.057) 1.0 (0.7Ð1.4) 0.15 (0.07Ð0.23) 1.3 (0.3Ð2.2) 0.6 ST15 0.14 (0.126Ð0.159) 3.9 (3.3Ð4.6) 0.21 (0.179Ð0.235) 2.9 (2.1Ð3.7) 0.8 0.44 (0.155Ð0.728) 9.9 (6Ð13.9) 2.45 (⫺ 0.81Ð5.72) 21.4 (3.5Ð39.3) 36.7 AUS Curra 0.05 (0.043Ð0.055) 1.4 (1.1Ð1.6) 0.12 (0.082Ð0.159) 1.7 (1Ð2.4) 2.3 0.11 (0.09Ð0.136) 2.5 (2Ð3) 0.15 (0.06Ð0.24) 1.3 (0.5Ð2) 0.0 Urah 0.03 (0.026Ð0.028) 0.7 (0.7Ð0.8) 0.06 (0.055Ð0.073) 0.8 (0.6Ð1.1) 0.5 0.03 (0.023Ð0.028) 0.6 (0.5Ð0.7) 0.06 (0.04Ð0.07) 0.6 (0.4Ð0.8) 0.0 Concentrations are expressed in mg/m 2. na, not available. aPredicted survival rates at the potential discriminating doses (2 ⫻ LC 99 of the susceptible reference Mun ˜oz strain).
ST11, ST12, and ST21, for which the tested doses of ßumethrin were not sufÞciently low to allow deter-mining the LC50and LC90and the estimates could not
be extrapolated from the model; Urah, for which the LC90to cypermethrin was slightly above the highest
tested dose and the estimate was therefore extrapo-lated from the model (Table 2).
In general, the RR50 was the method of choice to determine the resistance status because their 95% CI was smaller compared with RR90. However, RR90 is complementary to RR50 when the doseÐresponse curves of the Þeld populations and the reference strain are not parallel. A smaller slope of the Þeld population, which leads to RR90 greater than RR50, is an indicator that resistance is developing and that the population is heterogeneous, with susceptible and resistant indi-viduals (FAO 2004). Therefore, RR90 has to be con-sidered to detect emerging resistance. In the present
survey, the comparison of RR90 and RR50 to distin-guish susceptible from resistant Þeld populations re-veals that most of the differences would appear for ßumethrin. Indeed, because of the smaller slopes of the Þeld populations (Fig. 2a), four of the Þve Argen-tinean populations diagnosed susceptible to ßume-thrin based on RR50 were considered highly resistant based on RR90, with RR90 values between 27.8 (2.2Ð 53.5) and 36.5 (2.7Ð70.3), indicating emerging ßume-thrin resistance in these populations. Interestingly, these four populations would also have been consid-ered resistant based on their survival rate at the DD. According to the FAO guidelines (FAO 2004) the percentage of ticks surviving at the DD can be taken as the percentage of resistance to the acaricide in the population. Therefore, the interpretation of the re-sults based on the DD corroborates the observation of emerging resistance based on RR90.
Table 5. Lethal concentrations (LC50and LC90) with their 95% CI obtained for the 8 Argentinean (ST21-ST30), 3 South African
(ST11-ST15), and 2 Australian (Curra, Urah) field strains of R. microplus as well as their RR in comparison to the susceptible reference strain (Mun˜oz) when tested with amitraz
Country Strain Amitraz
LC50 (95% CI) RR at LC50 (95% CI) LC90 (95% CI) RR at LC90 (95% CI)
Mun˜oz 1.1 (0.9Ð1.3) 18.5 (9Ð28) ARG ST21 0.9 (0.7Ð1.1) 0.9 (0.7Ð1.1) 1.9 (1.1Ð2.7) 0.1 (0.1Ð0.1) ST22 1.7 (1.5Ð1.9) 1.6 (1.2Ð2) 4.1 (3.2Ð5) 0.2 (0.1Ð0.4) ST24 35.4 (27.2Ð43.6) 32.5 (24.1Ð40.8) 79.8 (50.3Ð109.3) 4.3 (2Ð6.6) ST25 9.8 (7.2Ð12.3) 9.0 (5.9Ð12.1) 39.0 (21.3Ð56.7) 2.1 (0.7Ð3.6) ST26 1.8 (1.5Ð2) 1.6 (1.2Ð2) 7.8 (5.1Ð10.5) 0.4 (0.2Ð0.7) ST27 1.0 (1Ð1.1) 1.0 (0.6Ð1.3) 3.9 (3.3Ð4.4) 0.2 (0.1Ð0.4) ST29 0.8 (0.4Ð1.1) 0.7 (0.5Ð0.9) 2.6 (0.4Ð4.9) 0.1 (0Ð0.2) ST30 22.4 (18Ð26.8) 20.5 (15.2Ð25.8) 42.5 (30.2Ð54.8) 2.3 (1.1Ð3.5) SAFR ST11 1.0 (0.8Ð1.1) 0.9 (0.6Ð1.2) 3.1 (2Ð4.3) 0.2 (0Ð0.3) ST12 1.2 (0.8Ð1.6) 1.1 (0.9Ð1.4) 6.9 (1Ð12.9) 0.4 (0.1Ð0.6) ST15 3.8 (2.7Ð4.8) 3.5 (2.4Ð4.6) 21.4 (6.3Ð36.6) 1.2 (0.2Ð2.1) AUS Curra 1.8 (1.1Ð3.5) 1.6 (0.9Ð2.4) 18.3 (8.1Ð85.8) 1.0 (0.3Ð1.7) Urah 2.3 (1.1Ð2.5) 2.1 (1Ð3.2) 46.9 (9.7Ð26.8) 2.7 (0.1Ð5.2)
Concentrations are expressed in mg/m2.
Fig. 2. DoseÐresponse curves of some Argentinean Þeld populations (gray) in comparison to the susceptible reference Mun˜oz strain (black) (A) ST22, ST25Ð29 when tested with ßumethrin. (B) ST24, ST25, and ST30 when tested with amitraz. The gray dotted horizontal lines indicate 50 and 90% mortalities.
Similarly to ßumethrin, one population appeared resistant to moxidectin in Argentina when using RR90 (ST22, RR90⫽ 6.6, 3.0Ð10.2) and another population appeared resistant to ivermectin in South Africa (ST15, RR90⫽ 6.8, ⫺0.9Ð14.4) although the latter case was not signiÞcant because of lack of replicates. Even though these last two cases are isolated, because all the other tick populations were susceptible to ML, they should be considered with care. Indeed, RR90 should help detecting emerging resistance and therefore sug-gest here that ML resistance might be appearing. However, no history of ML-treatment was reported in the farms from which these ticks were collected. Therefore, we are lacking a direct correlation between in vitro-Þnding and in vivo-situation and to our knowl-edge no resistance to ML has ever been reported in the literature in Argentina and South Africa.
Conversely, for amitraz, RR90 were much lower than RR50 and two of the three resistant populations based on RR50 would have been considered susceptible based on RR90. Unlike with ßumethrin, slopes of the response to amitraz were greater among the resistant populations compared with the reference strain (Fig. 2b). Therefore, amitraz resistance would have been missed considering RR90, indicating that RR90 are inadequate values to identify amitraz resistance.
In Argentina, resistance to SP was detected in seven out of eight populations (88%), contrasting with the SP resistance average rate of 23% obtained in populations from 11 Argentinean provinces reported by Gugliel-mone et al. (2006). Although farms in the current study were selected based on reports of lack of treatment efÞcacy, it indicates that SP resistance is widespread in Northeast Argentina (Province of Corrientes). The cur-rent use of SP for tick-treatments was reported in only three of these farms (ST22, ST29, and ST30). However, an earlier use of this class cannot be excluded in the other farms. In contrast, resistance to OP was found in a single Argentinean population (ST27). This class of com-pounds was not reported to be used for treatment by the farmers but OPs have been used in the province before SPs, and lack of efÞcacy was reported at that time (Grillo Torrado and Gutie´rrez 1970). The LTT identiÞed a high resistance to amitraz in ST24 and conÞrmed the lack of efÞcacy observed in vivo before tick collection. Resis-tance to amitraz was also observed in another farm with a history of amitraz treatment (ST25) and in a farm located in the close neighborhood of the above men-tioned farm and between which the animals are free to move (ST30, being close to ST24). This survey supports the very recent Þrst report of amitraz resistance in gentina (Cutulle´ et al. 2013). Amitraz resistance in Ar-gentina is worrying because this compound currently plays a major role in the eradication program of ticks in this country. In Argentina, tick control is regulated by the SENASA (Animal Health Authorities) through a law (12.566) and a decree (7623/54) that divide the northern part of the country (endemic area) in three areas (SE-NASA 1938): an infested area, where there is no obliga-tion of eradicaobliga-tion; a tick free area, where the percentage of infested Þelds should not exceed 1%; and between the two, an eradication area, where treatments are
compul-sory, aiming to reach eradication. This tick control pro-gram has been in progress for⬎70 yr and is based on treatments in dipping vats at a 21-d interval (resolution 27/1999) (SENASA 1999). This led to the development of resistance to most of the existing compounds used in dipping vats. Since 1999 injectable (ML) and pour-on (ßuazuron) compounds are allowed to be used in com-bination with plunge dipping or alone (J. Reggi, personal communication). However, amitraz is currently the main active ingredient used for treatment because of the lack of efÞcacy of the other compounds used for dipping vats, hence the important impact of the development of amitraz resistance.
In South Africa, resistance of Boophilus spp. to OP, SP, and amitraz is well known (Kemp et al. 1998, Strydom and Peter 1999), but ticks were not identiÞed at the species level in these previous studies. A na-tional survey carried out on randomly selected com-mercial farms showed resistance prevalence of 33, 22, and 7% to OP, SP, and amidines, respectively (Kemp et al. 1998). In the current study, one sample of ticks was collected from a commercial farm, while the two other samples originated from two herds grouping cattle of different owners and pasturing on communal lands, according to the local African traditions. In these herds the state veterinary authorities offer a weekly amitraz dip, and cattle owners are free to bring their animals for the treatments or to perform any other treatments. Therefore, we do not know exactly to which active ingredients the cattle from which the ticks were collected had been exposed. None of the three populations demonstrated resistance to OP or amitraz while one population (ST15) demonstrated resistance to SP and pyriprol and a suspicion of iver-mectin resistance. The observation of pyriprol resis-tance, reinforced by a RR50 to Þpronil very close to our cut-off value of 4.0 (RR50⫽ 3.9, 3.3Ð4.6) would suggest that some PYZ compounds have been used for treatments; however, pyriprol is not meant to be used for cattle but is exclusively recommended to treat tick infestations in dogs and the probability that these formulations have been used for cattle is very low. However, it cannot be excluded that other products of the PYZ class, such as phytosanitary products, have been used on animals or for plant protection.
In Queensland, Australia, prevalence of resistance to OP was reported to be between 12 and 96% de-pending on the regions in 1981 (Roulston et al. 1981). In the same state, prevalence of resistance to ßume-thrin and to amitraz was estimated to be 76 and 10%, respectively, in 2000 (Jonsson et al. 2000). The two Australian populations analyzed in the present survey also originated from Queensland and demonstrated the two most common resistance in their country, that is, OP and SP resistance, while they were susceptible to amitraz and all the other tested compounds.
Although some authors hypothesized that R.
micro-plusfrom Australia may be a different species from R.
microplusfrom Africa and Latin America (Labruna et al. 2009), this study indicate that acaricidal resistance was comparable between the three selected countries
and that resistance could be estimated comparing Aus-tralian Þeld populations to a Mexican reference strain. In the current study, the cut-off value of four was selected to distinguish resistant from susceptible ticks based on RR. Lower threshold values have been pre-viously used (Chevillon et al. 2007, Mendes et al. 2007) while in other studies, RR were separated into three classes among which RR of the intermediate class were considered as indicators of tolerance or of in-cipient resistance (Bianchi et al. 2003, CastroÐJaner et al. 2011, Klafke et al. 2012). The cut-off value of four should avoid over-diagnosing resistance. Conversely, one could argue that resistance may be missed. How-ever, if we had selected a threshold value of three instead of four, resistance statuses would have been identical in 96% of the cases and only four additional cases would have been considered resistant. There-fore, we are conÞdent that this threshold value offers a good compromise to differentiate susceptible from resistant populations.
The use of DD to determine whether resistance is present is widespread with adult tests such as the AIT, but has been criticized (Jonsson et al. 2007). It offers the beneÞt to reduce the number of engorged females required for testing and the amount of work since a single dose of each compound is tested. Although the beneÞt of testing a single dose per compound with the LTT is very much reduced, we were interested to see whether the use of DD would be suitable to detect resistance in the current study. A survival rate of ticks at the DD of 10% was used to differentiate resistant from susceptible tick populations. Resistance statuses based on DD using this cut-off value were in agreement with those based on RR50 or RR90 and the use of DD, there-fore, appeared to be adequate to diagnose established and emerging resistance in these Þeld populations.
To conclude, the LTT allowed the detection of resistance in Þeld populations of R. microplus ticks originating from Argentina, South Africa, and Austra-lia. Resistance statuses were based on RR50, using a cut-off value of four to differentiate susceptible from resistant populations. In addition, RR90 were also con-sidered to detect emerging resistance. Finally, survival rates at DD were compared with the resistance sta-tuses based on RR50 and RR90. Three cases of amitraz resistance in Argentina were identiÞed as well as the Þrst case of resistance to pyriprol in South Africa. In addition, emerging resistance to ML was suspected in an Argentinean and a South African farm. For this study, ticks were imported to Switzerland for testing. However, in the future, we would like the LTT to be performed in laboratories of the countries of collec-tion. To do so, a detailed description of the test using simpliÞed equipment has been published recently (Lovis et al. 2013).
Acknowledgments
We thank Peter Rolfe from Novartis Animal Health Aus-tralia for providing us with the AusAus-tralian tick samples, Bea-triz dÕAgostino from the SENASA, Argentina, for contribut-ing obtaincontribut-ing one of the Argentinean Þeld samples and
Robert Miller from the CFTRL of the U.S. Department of Agriculture for providing us with the susceptible Mun˜oz strain. We also thank Laure Muller for maintaining the Mu-n˜oz strain, ST11 and ST12 at CRA.
References Cited
Abbott, W. S. 1987. A method of computing the
effective-ness of an insecticide. J. Am. Mosq. Control Assoc. 3: 302Ð303.
Angus, B. M. 1996. The history of the cattle tick Boophilus
microplusin Australia and achievements in its control. Int. J. Parasitol. 26: 1341Ð1355.
Baker, J. A., J. O. Jordaan, and W. D. Robertson. 1979.
Ix-odicidal resistance in Boophilus microplus (Canestrini) in the Republic of South Africa and Transkei. J. S. Afr. Vet. Assoc. 50: 296 Ð301.
Bianchi, M. W., N. Barre´, and S. Messad. 2003. Factors
re-lated to cattle infestation level and resistance to acari-cides in Boophilus microplus tick populations in New Caledonia. Vet. Parasitol. 112: 75Ð 89.
Caracostanto´golo, J., M. E. Mun˜oz Coben˜as, C. Eddi, R. R. Ambru´stolo, G. M. Bulman, and L. Marangunich. 1996.
Primera determinacio´n en la Repu´blica Argentina de una poblacio´n de Boophilus microplus (Can.) resistente al piretroide sinte´tico alfacipermetrina caracterizada medi-ante pruebas preliminares. Vet. Arg. 13: 575Ð582.
Castro–Janer, E., L. Rifran, P. Gonzalez, C. Niell, J. Piaggio, A. Gil, and T. T. Schumaker. 2011. Determination of the
susceptibility of Rhipicephalus (Boophilus) microplus (Acari: Ixodidae) to ivermectin and Þpronil by Larval Immersion Test (LIT) in Uruguay. Vet. Parasitol. 178: 148 Ð155.
Chevillon, C., S. Ducornez, T. de Meeus, B. B. Koffi, H. Gaia, J. M. Delathiere, and N. Barre´. 2007. Accumulation of
ac-aricide resistance mechanisms in Rhipicephalus (Boophilus)
microplus(Acari: Ixodidae) populations from New Caledo-nia Island. Vet. Parasitol. 147: 276Ð288.
Cutulle´, C., N. N. Jonsson, and J. Seddon. 2009. Population
structure of Australian isolates of the cattle tick
Rhipiceph-alus (Boophilus) microplus.Vet Parasitol. 161: 283Ð291.
Cutulle´, C., L. Lovis, B. I. d’Agostino, G. G. Balbiani, G. Morici, D. Citrioni, J. Reggi, and J. L. Caracostanto´golo. 2013. In vitro diagnosis of the Þrst case of amitraz
resis-tance in Rhipicephalus microplus in Santo Tome´ (Corri-entes), Argentina. Vet. Parasitol. 192: 296 Ð300.
d’Agostino, B. 2010. Programa nacional de lucha contra la
garrapata comu´n del ganado bovino: Rhipicephalus
(Boophilus) microplus, pp. 22Ð23. In Memorias, XVIII Re´unio´n Cientõ´Þco Te´cnica, 3Ð5 November 2010, Mer-cedes, Corrientes, Argentina.
de Bruin, C. 1999. Acaricides and Boophilus spp. resistance
in South Africa, pp. 1. In Abstracts of Papers, 28th Annual Congress of the Parasitological Society of Southern Af-rica, 20 Ð21 October 1999 Augrabies Falls National Park, South Africa.
FAO. 2004. Resistance management and integrated parasite
control in ruminants: guidelines, pp. 25Ð77. Module 1. Ticks: Acaricide Resistance: Diagnosis, Management and Prevention. FAO, Rome, Italy.
Graf, J. F., R. Gogolewski, N. Leach–Bing, G. A. Sabatini, M. B. Molento, E. L. Bordin, and G. J. Arantes. 2004.
Tick control: an industry point of view. Parasitology 129: S427ÐS442.
Grillo Torrado, J. M., and R. O. Gutie´rrez. 1970.
Fo´sforo-resistencia de una cepa argentina de garrapata Boophilus
Grillo Torrado, J. M., and A. Pe´rez Arrieta. 1977. Nuevo tipo
de fo´sforo-resistencia en la garrapata comu´n del ganado bovino (Boophilus microplus) en la Repu´blica Argentina. Rev. Med. Vet. B. Aires 58: 101Ð105.
Guglielmone, A. A. 1992. The level of infestation with the
vector of cattle babaesiosis in Argentina. Mem. Inst. Os-waldo Cruz 87 (Suppl III): 133Ð137.
Guglielmone, A. A., A. J. Mangold, M. E. Castelli, V. H. Suarez, D. H. Aguirre, E. Alcaraz, M. M. Cafrune, B. Cetra, O. W. Fader, C. A. Luciani, P. D. Medus, and S. Nava. 2006. Toxicidad in vitro de la cipermetrina para
Rhipicephalus (Boophilus) microplus (Can.) y del di-azino´n para Haematobia irritans (L.) en la Argentina. Rev. Inv. Agropec. 35: 31Ð 41.
Jonsson, N. N., and M. Hope. 2007. Progress in the
epide-miology and diagnosis of amitraz resistance in the cattle tick Boophilus microplus. Vet. Parasitol. 146: 193Ð198.
Jonsson, N. N., D. G. Mayer, and P. E. Green. 2000. Possible
risk factors on Queensland dairy farms for acaricide re-sistance in cattle tick (Boophilus microplus). Vet. Parasi-tol. 88: 79 Ð92.
Jonsson, N. N., R. J. Miller, and J. L. Robertson. 2007.
Crit-ical evaluation of the modiÞed-adult immersion test with discriminating dose bioassay for Boophilus microplus us-ing American and Australian isolates. Vet. Parasitol. 146: 307Ð315.
Kemp, D. H., R. Thullner, K. R. Gale, A. Nari, and G. A. Sabatini. 1998. Acaricide resistance in the cattle-ticks
Boophilus microplusand B. decoloratus: review of resis-tance data; standardization of resisresis-tance tests and rec-ommendation for integrated parasite control to delay resistance. Report of the Animal Health Services, AGAH, FAO. CSIRO Tropical Agriculture, Long Pocket Labora-tories, Australia.
Klafke, G. M., E. Castro–Janer, M. C. Mendes, A. Namind-ome, and T. T. Schumaker. 2012. Applicability of in vitro
bioassays for the diagnosis of ivermectin resistance in
Rhipicephalus microplus(Acari: Ixodidae). Vet. Parasitol. 184: 212Ð220.
Labruna, M. B., V. Naranjo, A. J. Mangold, C. Thompson, A. Estrada–Pena, A. A. Guglielmone, F. Jongejan, and F. J. de la. 2009. Allopatric speciation in ticks: genetic and
reproductive divergence between geographic strains of
Rhipicephalus (Boophilus) microplus.BMC Evol. Biol. 9: 46.
Lovis, L., M. C. Mendes, J. L. Perret, J. R. Martins, J. Bouvier, B. Betschart, and H. Sager. 2013. Use of the Larval Tarsal
Test to determine acaricide resistance in Rhipicephalus
(Boophilus) microplus Brazilian Þeld populations. Vet. Parasitol. 191: 323Ð331.
Lovis, L., J. L. Perret, J. Bouvier, J. M. Fellay, R. Kaminsky, B. Betschart, and H. Sager. 2011. A new in vitro test to
evaluate the resistance level against acaricides of the cattle tick, Rhipicephalus (Boophilus) microplus. Vet. Parasitol. 182: 269 Ð280.
Mangold, A. J., M. E. Castelli, S. Nava, D. H. Aguirre, and A. A. Guglielmone. 2004. Poblaciones de la garrapata
Rhipi-cephalus (Boophilus) microplusresistentes a los piret-roides en Co´rdoba y Salta, Argentina. Rev. FAVE 3: 55Ð59.
Mendes, M. C., J. R. Pereira, and A. P. Prado. 2007.
Sensi-tivity of Boophilus microplus (Acari: ixodidae) to pyre-throids and organophosphate in farms in the Vale do Paraõ´ba region, Sa˜o Paulo, Brazil. Arq. Inst. Biol. 74: 81Ð85.
Nolan, J. 1981. Current developments in resistance to
ami-dine and pyrethroid tickicides in Australia, pp. 109 Ð114.
InG. B. Whitehead and J. D. Gibson (eds.), Proceedings
of Tick Biology and Control Conference. Tick Research Unit Rhodes University, Grahamstown, South Africa.
Nolan, J., J. T. Wilson, P. E. Green, and P. E. Bird. 1989.
Synthetic pyrethroid resistance in Þeld samples in the cattle tick (Boophilus microplus). Aust. Vet. J. 66: 179 Ð182.
Ntondini, Z., E. M. van Dalen, and I. G. Horak. 2008. The
extent of acaricide resistance in 1-, 2- and 3-host ticks on communally grazed cattle in the eastern region of the Eastern Cape Province, South Africa. J. S. Afr. Vet. Assoc. 79: 130 Ð135.
Ritz, C., and J. C. Streibig. 2005. Bioassay analysis using R. J.
Stat. Softw. 12: 1Ð22.
Roulston, W. J., B. F. Stone, J. T. Wilson, and L. I. White. 1968. Chemical control of an organophosphorus-and
car-bamate-resistant strain of Boophilus microplus (Can.) from Queensland. Bull. Entomol. Res. 58: 379 Ð392.
Roulston, W. J., R. H. Wharton, J. Nolan, J. D. Kerr, J. T. Wilson, P. G. Thompson, and M. Schotz. 1981. A survey
for resistance in cattle ticks to acaricides. Aust. Vet J. 57: 362Ð371.
Sabatini, G. A., D. H. Kemp, S. Hughes, A. Nari, and J. Hansen. 2001. Tests to determine LC50and discriminat-ing doses for macrocyclic lactones against the cattle tick,
Boophilus microplus.Vet. Parasitol. 95: 53Ð 62.
SENASA. 1938. Servicio Nacional de Sanidad Animal: Ley
12.566. Garrapata. (http://www.senasa.gov.ar/contenido.
php?to⫽n&in⫽981&ino⫽981&io⫽5876).
SENASA. 1999. Servicio Nacional de Sanidad Animal:
Resolu-cio´n 27/1999. Garrapata - Plan sanitario. (http://www.
senasa.gov.ar/contenido.php?to⫽n&in⫽1043&io⫽4588).
Shaw, R. D. 1966. Culture of an organophosphorus-resistant
strain of Boophilus microplus (Can.) and an assessment of its resistance spectrum. Bull. Entomol. Res. 56: 389 Ð 405.
Shaw, R. D., and H. A. Malcolm. 1964. Resistance of
Boophi-lus micropBoophi-lusto organophosphorus insecticides. Vet. Rec. 76: 210 Ð211.
Spa¨th, E.J.A., A. A. Guglielmone, A. R. Signorini, and A. J. Mangold. 1994. Estimacio´n de las pe´rdidas econo´micas
directas producidas por la garrapata Boophilus microplus y las enfermedades asociadas en la Argentina (3a. parte). Therios 23: 454 Ð 468.
Strydom, T., and Peter, D. 1999. Acaricidas y resistencia en
Boophilusspp en Sudafrica, pp. 35Ð 40. IV Seminario In-ternational de Parasitologia Animal Puerto Vallarta, Jalisco, Mexico.
Walker, A. R., A. Bouattour, J. L. Camicas, A. Estrada–Pena, I. G. Horak, A. A. Latif, R. G. Pegram, and P. M. Preston. 2003. Ticks of domestic animals in Africa: a guide to
identiÞcation of species. Bioscience Reports, Edinburgh, Scotland, United Kingdom.