Climate Policy Design:
Interactions among Carbon Dioxide, Methane, and Urban Air Pollution Constraints
by
Marcus C. Sarofim
B.S. Chemistry
Massachusetts Institute of Technology, 1996 M.S. Chemistry
California Institute of Technology, 2000
Submitted to the Engineering Systems Division in Partial Fulfillment of the Requirements of the Degree of Doctor of Philosophy in Engineering Systems
at the
Massachusetts Institute of Technology June 2007
© 2007 Massachusetts Institute of Technology All Rights Reserved
Signature of Author:________________________________________________________ Engineering Systems Division
March, 2007 Certified by:_______________________________________________________________
Kenneth A. Oye Associate Professor of Political Science and Engineering Systems Certified by:_______________________________________________________________
Henry D. Jacoby Co-Director, Joint Program on the Science and Policy of Global Change Certified by:_______________________________________________________________
Ronald G. Prinn TEPCO Professor of Atmospheric Chemistry Accepted by:______________________________________________________________
Richard de Neufville Professor of Engineering Systems Chair, ESD Education Committee
Climate Policy Design:
Interactions among Carbon Dioxide, Methane, and Urban Air Pollution Constraints
by
Marcus C. Sarofim
Submitted to the Engineering Systems Division on May 4th, 2007 in Partial Fulfillment of the Requirements of the Degree of Doctor of Philosophy in Engineering Systems
ABSTRACT
Limiting anthropogenic climate change over the next century will require controlling multiple substances. The Kyoto Protocol structure constrains the major greenhouse gases and allows trading among them, but there exist other possible regime architectures which may be more efficient. Tradeoffs between the market efficiency of all-inclusive policies and the benefits of policies targeted to the unique characteristics of each substance are investigated using an integrated assessment approach, using the MIT Emissions Prediction and Policy Analysis model, the Integrated Global Systems Model, and political analysis methods.
The thesis explores three cases. The first case addresses stabilization, the ultimate objective of Article 2 of the UN Framework Convention on Climate Change. We highlight the implications of imprecision in the definition of stabilization, the importance of non-CO2 substances, and the problems of excessive focus on long-term targets. The results of the stabilization analysis suggest that methane reduction will be especially valuable because of its importance in low-cost mitigation policies that are effective on timescales up to three centuries. Therefore in the second case we examine methane, demonstrating that methane constraints alone can account for a 15% reduction in temperature rise over the 21st century. In contrast to conventional wisdom, we show that Global Warming Potential based trading between methane reductions and fossil CO2 reductions is flawed because of the differences in their atmospheric characteristics, the uncertainty in methane inventories, the negative interactions of CO2 constraints with underlying taxes, and higher political barriers to constraining CO2. The third case examines the benefits of increased policy coordination between air pollution constraints and climate policies. We calculate the direct effects of air pollution constraints to be less than 8% of temperature rise over the century, but ancillary reductions of GHGs lead to an additional 17% decrease. Furthermore, current policies have not had success coordinating air pollution constraints and CO2 constraints, potentially leading to a 20% welfare cost penalty resulting from separate implementation.
Our results lead us to recommend enacting near term multinational CH4 constraints independently from CO2 policies as well as supporting air pollution policies in developing nations that include an emphasis on climate friendly projects.
Committee:
Kenneth A. Oye, Associate Professor of Political Science and Engineering Systems Henry D. Jacoby, Co-Director, Joint Program on the Science and Policy of Global Change Ronald G. Prinn, TEPCO Professor of Atmospheric Chemistry
Acknowledgments
There are so many people that have been important in my academic and personal development that it would be impossible to recognize all of their contributions. However, even if they are not mentioned here, I am grateful to all of them nonetheless.
I will start by thanking my thesis committee. Professors Ken Oye, Jake Jacoby, and Ron Prinn have been very patient with me over the years, serving as sounding boards throughout the thesis process. Their special challenge was in getting me to focus rather than following all the different problems in which I kept becoming interested. There were also times when I was not sure where my research was going, or if I would ever get there, but they were always full of encouragement. Each one of them also read my thesis chapters in depth, offering invaluable suggestions and corrections. In addition Professor Mario Molina served on my committee as I was just starting my research, and he kindly gave me very useful advice for the first steps of defining my thesis problem.
Many other MIT faculty and staff have also been helpful in advancing my research. John Reilly has worked very closely with me on many projects in the Joint Program for the Science and Policy of Global Change. Indeed, the first two chapters of this thesis grew out of discussions we had in his office. Andrei Sokolov, Chris Forest, and Chien Wang have always answered all of my earth systems modeling questions patiently and in detail. Sergey Paltsev, Mustafa Babiker, and Ian Sue Wing served a similar role in explaining the EPPA model. Therese Henderson deserves special thanks for all the tasks she does so that the rest of us do not have to worry about them, in addition to her constant support, and for the gift of a set of juggling balls. Jennifer Lambert and various others have helped Therese over the years in keeping everything moving smoothly. David Reiner provided unique political and human perspectives, and it is good to see him during his fortunately frequent visits from the other Cambridge. I enjoyed several fruitful collaborations with David Kicklighter, Ben Felzer, and the MBL folk at Woods Hole working on interactions with the TEM model. Travis Franck, Kira Matus, and many other students made the Joint Program a great place to work. Thanks go to my various officemates and cubicle mates, especially Angelo Gurgel for being a calm and friendly presence for the last year, and Alexandra Lempp who would feed me exquisite French cheeses while eating her totally artificial cheetos. I had useful discussions with Steve Connors about Mexico City and multi-attribute analysis, and he also provided me with useful contacts in the Mexico City Program. I have had many good conversations over the years with Jason West, who has parallel interests in methane, air pollution, and Mexico, and hope to collaborate more with him in the future. The computer support staff in E40 kept my PC in shape, and saved my data after the Christmas hacking incident, and the Tech Square staff kept the svante cluster up and running enabling all the IGSM calculations. Of course, I am grateful for the
scientists and politicians at EPA and in Mexico City who have discussed various climate policies with me. Finally, I would also like to thank my advisors from my days as a
chemist, Professors Dennis Dougherty and Greg Fu, whose teaching and support helped me reach the next steps on the academic ladder.
Outside of academics, I have many friends I would like to thank. Fellow TPP and TMP students, in particular Erica Fuchs, Rebecca Dodder, Ralph Hall, Natalia Ramirez, and Miriam Zuk. The square and contra dance communities that have kept me sane and in shape in the past couple years, notably Ingrid Ulbrich, Amy Gresser, and Dana Scott who
got me started with squares, Myfanwy Callahan and Anne Lightbody who helped expand my addiction to contras, Sarah McDougal and Jess Marder who started the tradition of dinner gatherings before dances, and Sola Grantham and Stephen Gildea who both gave me individual waltz lessons. I have had several roommates over the years at MIT, all of whom have been great to live with: Sarah Delaney, Kai Jiang, Ben Lane, and all my thetan undergrads. I still keep in touch with various of my friends from Caltech – especially Megan Nuñez, Ben Lane, their cats, adorable twin babies, and family, all of whom moved here from sunny California to keep me company (though it is possible they had other reasons as well), and Tim Johann and Cathy Sarisky who unfailingly send me care
packages and words of support every year. Even though my time in Utah has been limited, my friends there have welcomed me warmly every time I visit, especially Nicole Pershing and her fabulous Christmas Eve desserts. I am grateful that many of my friends from undergraduate still live in the area, though I miss the ones who have moved away, especially Matt Condell and Hannah Jang. I am fortunate to have many talented friends who act in plays, perform in concerts, dance in festivals, or do improv comedy, providing me with much needed culture and entertainment. I had several travel buddies: Marina Kishkovich, Olga Rostapshova, Marleigh Norton, and the Argentinians I met at a
conference in Italy. I am grateful to the writer’s cabal and Andrea Humez for providing me a space to write for fun, before this work drove all other writing out of my life. Erin
Panttaja and Eric Mumpower deserve special mention for all of our afternoon writing sessions in Diesel and elsewhere, without which my thesis would have taken even longer to finish. I would like to thank Rebecca McGowan for being a calming presence and a great dance partner, for beginning to teach me Arabic, and more. Then there are those who have been good friends since the days we were all at Milton Academy together, who have served as emotional anchors, partners in crime, and people with whom I always enjoy spending time. Therefore I am tremendously grateful to Andrew Shultz, Tom Giordano, Edgar Ngwenya, Megan Ringrose, and Rachel Peck for their friendships of many years.
I would like to highlight two special people: Mort Webster, for having taken me on when I was a first year student and being a truly amazing mentor, and Jim McFarland for his role as my fellow PhD student in the Joint Program for all these years, always one cubicle or office away.
Finally, I would like to end by thanking my parents for their unfailing love and support. Words cannot capture how much they have done for me.
Table of Contents
1 Stabilization in a Multi-Gas World………... 13 1.1 Introduction: An unresolved need for action……… 13 1.2 Article 2 philosophy and limitations: The stabilization question………. 16 1.2.1 The Role of Article 2 of the UNFCCC 16
1.2.2 The Definition of Stabilization 18
1.2.3 Avoiding Dangerous Anthropogenic Interference: The Ultimate Objective 22 1.3 Key Gases………. 29
1.3.1 The Emphasis on CO2 29
1.3.2 The Potential of Methane 34
1.3.3 The Question of Air Pollutants 36
1.3.4 Temporal Issues 36
1.3.5 A Cross Gas Comparison 38
1.3.6 Other Greenhouse Gases 40
1.4 Previous Efforts………. 40
1.4.1 Stabilization Calculations 40
1.4.2 CCSP Scenarios 47
1.5 Conclusions……… 55 2 Methane Policy: An Integrated Approach argues against GWP based trading.. 59
Introduction……….. 59
2.2 Modeling Costs and Benefits of Methane Policies……… 61
2.2.1 Modeling 61
2.2.2 Abatement Opportunities 63
2.2.3 Modeling Climate Impacts 65
2.2.4 Limitations of Market Trading 70
2.2.5 Uncertainty in Modeling 75
2.3 The Source Estimation Problem……… 78 2.4 Implications of uncertainty……… 83 2.5 Policy Analysis……….. 85 2.5.1 Historical policies and Methane to Markets 85
2.5.2 Unintended Consequences 91
2.5.3 Policy Design 92
2.6 Conclusions……… 94 3 Air pollution Constraints: Interactions with Climate Change and Policy……... 97 3.1 Introduction……… 97 3.2 The Direct Impact of Air Pollution on Climate………. 99 3.2.1 Scenarios of Air Pollution Reduction 103 3.2.2 Effects of pollution controls on concentrations of key atmospheric species 105 3.2.3 Effects of air pollution controls on temperature change and sea level rise 110 3.3 Air pollution constraints in the context of an economic model………. 113 3.3.1 Motivation for Inclusion of Economics 113
3.3.2 Model Development 114
3.3.2.2 Parameter Estimation 115 3.3.3 Pollution Control impact on GHG emissions 118 3.3.4 Climate control impact on air pollution 125 3.3.5 Complementarity: The policy interaction between air pollution control
and CO2 mitigation 126
3.3.6 GHG and Air Pollution Policy Interactions: The case of GWP Trading 131 3.4 Political Analysis of Air Pollution Policies and Climate………... 132 3.4.1 Motivation for Political and Geographic Analysis 132
3.4.2 Analysis of Mexico City 134
3.4.3 Analysis of China 136
3.4.4 Analysis of Los Angeles 138
3.4.5 US State and Regional Policies 138
3.4.6 International Cooperation 140
3.5 Conclusions……… 143 4 Conclusions……….. 145 Appendices
A The MIT Emissions Prediction and Policy Analysis (EPPA) Model 149 B The MIT Integrated Global Systems Model (IGSM) 152
C Kyoto gases other than CO2 and CH4 153
D Global Warming Potentials 156
E Methane properties 158
F Complementarity Literature Analysis 164
G Black Carbon 164
H Fictionistan 169
Glossary 173 Bibliography 175
List of Figures
Figure 1-1: The impact on radiative forcing (left panel) and emissions (right panel) of trading CH4 and CO2 by constant GWP values in a simplified analysis 21 Figure 1-2: The Stabilization Cause-Effect Chain 23
Figure 1-3: Global-average radiative forcing (RF) estimates 28
Figure 1-4: EPPA reference scenario emissions weighted by 100 year GWPs 30
Figure 1-5: EPPA reference scenario, forcing from preindustrial 30
Figure 1-6: EPPA reference projection 32
Figure 1-7: Components of carbon-cycle budget 41 Figure 1-8: Decadal global mean average temperature and sea level rise 44
Figure 1-9: CO2, CH4, and N2O concentrations and total forcing. Results from
MIT IGSM calculations using CCSP targets. 48
Figure 1-10: Relative Prices of CH4 and N2O to Carbon 50 Figure 1-11: Temperature Change to 2400 for MIT IGSM extensions to the
scenarios developed for CCSP Product 2.1. 52
Figure 1-12: Components of the carbon-cycle budget and CO2 concentrations for the MIT IGSM extension of the Level 2 scenario used in CCSP Product 2.1. 53 Figure 1-13: Sea level rise to 2400 for MIT IGSM extensions to the scenarios
developed for CCSP Product 2.1. 54
Figure 1-14: Temperature change from CO2 and non-CO2 scenarios 55 Figure 2-1: Global Marginal Abatement Curves derived from EPPA4 in 2010 for
CO2, N2O, and CH4 64
Figure 2-2: Impact on global mean temperature increase over the 21st Century in
three selected policies using IGSM1 67
Figure 2-3: Global marginal consumption loss in 2010 derived from EPPA4 for
CO2 and CH4 constraints. 72
Figure 2-4: Global CH4 and N2O Emissions Across Reference Scenarios 77 Figure 2-5: IPCC inventory methodology for livestock methane emissions (IPCC,
2006) 82
Figure 2-6: IPCC inventory methodology for rice cultivation methane emissions
(IPCC, 2006) 82
Figure 2-7: Global anthropogenic methane budget by sector in 2000. 87
Figure 3-1: EPPA4 emissions in 2000, weighted by 100 year GWPs, including best estimates for pollutant GWPs. Black carbon is included in the second
figure. 100
Figure 3-2: EPPA4 emissions in the year 2100, weighted by 100 year GWPs,
including best estimates for air pollutant GWPs. 102
Figure 3-3: Global, northern hemisphere (NH), and southern hemisphere (SH)
pollutant emissions. 105
Figure 3-4: Hemispheric concentrations of climatically and chemically important species.
Figure 3-5: Global concentrations of climatically and chemically important species.
108
Figure 3-6: Effects of air pollution caps on global, southern hemispheric and
Figure 3-7: Generalized production structure for including air pollutants in the
EPPA4 model 114
Figure 3-8: Sample marginal abatement curves derived from RAINS data 116
Figure 3-9: CO2 emissions under constant air pollution emission constraints given
different elasticities 119
Figure 3-10: CO2 concentrations resulting from air pollution constraint scenarios: 5 individual pollutant constraints, and three sensitivities for constraining
all pollutants 120
Figure 3-11: Energy production by technology in the reference scenario and an air pollution constraint scenario controlling all pollutants with the reference
value for pollutant elasticities. 121
Figure 3-12: Percent temperature reduction resulting from air pollution constraints as a percent of reference temperature increase, including all GHG
List of Tables
Table 1-1: A Cross Gas Comparison: How methane, CO2, and air pollutants differ in many characteristics that might have policy relevance. 39
Table 1-2: Results of different stabilization policies on temperature and costs 42
Table 1-3: GHG Concentrations in 2100 46
Table 2-1: Calculated costs using EPPA4 of near term methane reduction scenarios 65 Table 2-2: Temperature reductions resulting from near term climate policies 66
Table 2-3: Comparing GWP equivalent CH4 and CO2 policies in terms of impact on CO2 equivalent emissions reductions (sum over century), sulfate aerosol and black carbon emissions in 2100, ozone concentrations, and reduction in global mean temperature change over the 21st century. 68
Table 2-4: Consumption loss in Annex B vs. non-Annex B nations for the 25%
reduction CH4 constraint policy and the GWP equivalent CO2 policy 74 Table 2-5: Anthropogenic methane inventories using different methodologies 80
Table 3-1: Elasticities of substitution by substance and sector 117
Table 3-2: Energy Demand in Quadrillion Btu by Energy Source for different
control scenarios 122
Table 3-3: Sensitivity of Welfare Cost to elasticity 124
Table 3-4: Sensitivity of Welfare Cost to Pollutant Controlled 124
Table 3-5: Reduction of Urban Gas emissions in CCSP 550 ppm policy 125
Table 3-6: Net present consumption loss from the CCSP policy, the air pollution
constraint policy, and both policies enacted simultaneously. 129
Table 3-7: Average energy demand in quadrillion Btu from 2005 to 2100 by energy
source 130
Table 3-8: Temperature increase from 2000 to 2100 in four scenarios 130
Table A-1: Countries and Regions in the EPPA Model 149
Table A-2: Sectoral Breakdown and Resource Factors in the EPPA Mode 150
Table B-1: IGSM Model usage in this thesis 152
Table B-2: Climate parameters chosen for use in this thesis 153
Table D-1: GWPs by gas and integration time period from IPCC TAR
(Ramaswamy et al., 2001) and IPCC SAR (Schimel et al., 1995) 156
Table H-1: Optimal set of options for achieving constraints to CO2, black carbon,
or both simultaneously. 170
Table H-2: A comparison of the combination of all of the options necessary to meet the CO2 constraint and BC constraint individually to the minimum set of those options that is required to meet the two constraints. 171
Table H-3: Meeting constraints equal to the ancillary benefits of the original policy 171 Table H-4: Second iteration of setting constraints equal to ancillary benefits 171
Table H-5: Cost of original two policies and the cost of those policies after one and two iterations of the adjustment scheme described in this chapter 171
1 Stabilization in a Multi-Gas World
1.1 Introduction: An unresolved need for action
Anthropogenic climate change is likely to be one of the most important issues that humanity will need to address in the 21st century. While attribution is sometimes difficult, we are likely already seeing impacts of climate change in everything from the die off of Alaskan forests to increases in hurricane intensity to unprecedented European heat waves. As the planet continues to warm due to the radiative effects of greenhouse gases, more changes will be seen both on the short term (less than a century) and long term (multiple century) timescales. Addressing this issue will require both adaptation (as the Earth is already committed to some minimum amount of warming) and mitigation, and possibly even geo-engineering. This thesis concerns itself only with mitigation: adaptation is a worthy topic of study but outside the scope of this work, and geo-engineering should be considered a solution of last resort1. In terms of mitigation, we would ideally enact policies that will reduce both the short-term rate of change and the long-term temperature achieved. We especially would like to avoid any “tipping points” should they exist as such.
However, we would like to achieve this mitigation for as little expense as possible. Despite the growing recognition of the issue, there has been significant policy inertia in enacting mitigation strategies. The global nature of the climate change problem
dissuades action, as the atmosphere is a global commons and therefore free rider, collective action, and similar issues inhibit enacting stringent policies. The long time scale of the problem similarly retards movement: politicians think on a the timescale of the electoral cycle, the general populace rarely accept sacrifices today for improvements tomorrow, and unborn generations have no ability to influence current events. The uncertainty in impacts adds confusion to the determination of optimal measures, and furthermore serves as a lever useful to those who wish to delay the passage of any significant measures. The cost of
1 As in the tale of the old woman who swallowed the fly, to solve one crisis precipitated by what is in effect a global scale experiment by enacting another global scale experiment is a very risky notion, to be undertaken
reductions is similarly uncertain, and likely to be spread across most of the economy, and this uncertainty also adds to policy paralysis.
CO2 is individually the most significant of the anthropogenic greenhouse gases. However, it is also perhaps the most difficult to abate due to its relationship with energy production. Governments are leery of accepting constraints that they perceive will put them at a competitive disadvantage with other nations, which may slow down their economic growth, which will impede politically powerful industrial lobbies in the energy, transport, and energy intensive production sectors, or which will be unpopular with the electorate who would see increased prices at the pump and in monthly energy bills.
Due to these economic and political implications of non-voluntary constraints on CO2, emissions controls have been slow to be enacted, have not included some major players (such as the United States and China), and, according to some analyses, are not much more stringent than business as usual. The two most prominent such non-voluntary policies are the Kyoto Protocol and the European Union Emissions Trading System. Standard environmental economic wisdom dictates that efficient policies should be as comprehensive as possible in order to capture all low cost abatement opportunities, which in the case of greenhouse gases means as many nations as possible. In addition, given the existence of a metric such as Global Warming Potentials (GWPs) that allows direct comparison of greenhouse gases (GHGs) on a single axis, such efficient policies should also be comprehensive in terms of gas coverage. And indeed, the Kyoto Protocol was designed to cover the major gases and as many industrialized nations as possible. This theoretically enables the invisible hand of market forces to find the most efficient solutions to a given constraint. There are three major trading structures: trading between regions allows “where” flexibility, banking and borrowing (e.g., trading between time periods) allow “when” flexibility, and trading between gases allows “what” flexibility. Ceteris paribus, where, when, and what flexibility are all desirable features, and this fact has indeed been highlighted by research to which this author has contributed (Reilly et al., 2003a).
However, there are reasons to believe that some aspects of this flexibility may have negative consequences. First, gases with different lifetimes and source characteristics have properties that are sufficiently different that allowing reductions of one gas to compensate
for increases in another may be ill-advised. Second, the inclusion of CO2 in the comprehensive approach may be the primary issue that has slowed effective policy creation, and therefore a separate approach for individual gases might be politically more effective. We are not the first to note that there are issues with “what flexibility” (Goulder and Pizer, 2006), but we state it more firmly than we have previously seen. There are also substances that are not included in the Kyoto basket, and it is possible that these pollutants (namely ozone precursors and aerosols) deserve a more prominent role. We note that even inter-regional trading is not always optimal, both due to interaction effects between local taxes and reduction policies, and also because of differences between market equivalent prices and actual local purchasing power. In any case, there are tradeoffs between the benefits of coordination between abatement of multiple substances, and the benefits of crafting policy to optimally address the unique characteristics of each substance.
Therefore, this thesis uses multiple approaches to address the potential role of non-CO2 gas policies in a global context. We first examine the standard approaches to climate policy in this chapter. The role of Article 2 of the UNFCCC and the emphasis on
stabilization of greenhouse gases are important because of the lack of definition of
stabilization itself, and because this emphasis on stabilization leads to a focus on CO2 and long term targets. We then delve in more depth into methane policies in chapter two and air pollution policies in chapter three. Computational modeling plays a significant role in this thesis in order to determine the potential carried in reduction of these substances and the interaction between different policies. The capability of the MIT IGSM to handle the chemistry of the atmosphere is of vital importance for understanding the lifecycles of methane and ozone. The MIT Emissions Prediction and Policy Analysis model (EPPA, detailed in Appendix A) provides emissions scenarios for the 21st century, as well as the capability of determining economic costs of emission constraint policies in various configurations. We introduced new functionality into the EPPA model so that it could be used to analyze air pollution policies in a similar fashion to various GHG policies. These computations are then embedded in a deeper policy context in order to fully understand their implications.
This chapter demonstrates the importance of not being limited to addressing stabilization as a concept, and the necessity of looking beyond CO2 for low cost and
effective temperature change reduction on the century timescale. The conclusion of our work is that methane reduction in particular, and perhaps also black carbon reduction, should play important roles in future climate actions. However, in contrast to much other research in this area, this thesis suggests that greenhouse gas policies should not allow methane reductions to be traded for CO2 reductions for reasons political, economic, and chemical. This separate approach will enable policies to be designed in such a way as to be best suited to the characteristics of each substance, taking into account the appropriate uncertainties, source partitioning between OECD and developing nations, and other aspects. We believe that the advantages in this separation outweigh the loss of “what flexibility”.
However, there do exist advantages of coordination, even in the absence of actual trading. This coordination potential is especially prevalent in air pollution reductions, because fossil fuel combustion is a major source of both CO2 and air pollutants and therefore reductions or modifications of the fossil fuel combustion process can lead to improvements in climate and air quality. So while we show that NOx, CO, and VOC reductions will play little role in direct climate impacts (though inclusion of ozone impact on agriculture may change this conclusion slightly), we can also show the magnitude of the the interaction of climate and air pollution policy. Therefore we see that the same analysis methodology leads to a suggestion of policy fragmentation in the case of methane, but policy coordination in the case of air pollution.
1.2 Article 2 philosophy and limitations: The stabilization question
1.2.1 The Role of Article 2 of the UNFCCC
Article 2 of the UN Framework Convention on Climate Change:
The ultimate objective of this Convention and any related legal instruments that the Conference of the Parties may adopt is to achieve, in accordance with the relevant provisions of the Convention, stabilization of greenhouse gas concentrations in the atmosphere at a level that would prevent dangerous anthropogenic interference with the
climate system. Such a level should be achieved within a time-frame sufficient to allow ecosystems to adapt naturally to climate change, to ensure that food production is not threatened, and to enable economic development to proceed in a sustainable manner.
Any discussion of climate change policy needs to address the centerpiece of international cooperation for addressing global climate change: the UN Framework Convention on Climate Change. Signed by heads of state in 1992 at the UN Conference for the Environment and Development summit in Rio de Janeiro the Convention entered into force in 1994. The UNFCCC coordinates various international climate change actions such as national inventories, and partners with other organizations such as the Global Environmental Facility and the IPCC to further research and create policy. While the Convention itself has no binding reduction commitments it is meant to serve as a
framework for further climate treaties such as the Kyoto Protocol. As such, the text of the UNFCCC has significant influence on the framing of worldwide goals, studies, and actions in the climate change realm. Article 2, as the Ultimate Objective of the Convention, is therefore extremely important in considerations of global climate policy.
The language of Article 2 (perhaps deliberately) leaves significant room for interpretation. Specifically, the goal of stabilizing greenhouse gases does not specify a partitioning between gases or a timetable of reductions. Rhetoric and academic studies have concentrated in large part on carbon dioxide, and on long term solutions. Actual policies have mostly followed the suggestions of environmental economists in including all GHGs and as many nations as possible in a single comprehensive policy with trading both between gases and between regions in order to allow the market to take advantage of the lowest marginal cost solutions. However implementation of these policies has moved slowly, and fourteen years after the Framework Convention was negotiated only two such policies (the EU ETS and the Kyoto Protocol) have taken effect, and neither policy includes the US, China, nor India, nor, by many estimates, does either policy impose significant constraints2.
1.2.2 The Definition of Stabilization
There is disagreement about what stabilization actually entails, but despite attempts to put other gases on the agenda the discussion of stabilization tends to trend towards carbon dioxide. The 1997 Technical Paper III of the Intergovernmental Panel on Climate Change (IPCC) attempted to clarify the Convention’s stabilization goal (Schimel et al., 1997). Sensitivity to small deviations in other GHG emissions was evaluated and the study revealed that in the short term these deviations could have significant impact. The
Technical Paper also noted that since pre-industrial times, the contribution of these ‘other’ substances to radiative forcing is comparable to that of CO2. But in academic papers, control of other gases is at best usually relegated to footnotes or asides (Arnell et al., 2002; Dai et al., 2001a; Hoffert et al., 2002; Nordhaus, 2001; O'Neill and Oppenheimer, 2002). Question 6 of the Synthesis Report to the IPCC Third Assessment Report (TAR) asks what the consequences are of stabilizing concentrations in carbon dioxide equivalents, but the text then only addresses CO2, and the stabilization scenarios are analyzed with only one projection of other greenhouse gases, namely the unconstrained SRES A1B scenario (Watson and Core Writing Team, 2001). The U.S. National Assessment Report on Climate Change Impacts relies heavily on the CGCM1 and HADCM2 models, both of which use CO2 as a surrogate for other greenhouse gases (National Assessment Synthesis Team, 2001). The fact that forcing changes are often measured in CO2 equivalents rather than a more precise term such as W/m2 is yet another piece of evidence that points towards the importance of CO2 in academic studies and in political rhetoric.3
Other studies, such as a Hadley Centre analysis (Mitchell et al., 2000), equate a CO2 stabilization level with a forcing value. These studies model varying CO2 concentrations and assume the concentrations of all other gases stay constant, but acknowledge that, in reality, society might choose a different allocation between other GHGs and CO2 that add up to the same total forcing level. For a given CO2 equivalent stabilization target, the actual level at which CO2 will need to be stabilized is therefore likely to be significantly lower than the target concentration and, moreover, such studies provide no direct guidance
3 W/m2, or watts per meter squared, are used as a measure of the average global radiative forcing change at the tropopause resulting from an increase in the concentration of a given greenhouse gas from some baseline (usually present concentrations, or preindustrial concentrations).
on the emissions paths that would be consistent with stabilization of radiative forcing. The question of stabilization of multiple greenhouse gases is inevitably linked to how to
compare greenhouse gases, and thus the inadequacy of GWPs (Reilly et al., 1999). GWPs are defined and discussed at more length in Appendix D. One approach is to set a specific climate or radiative forcing target and endogenously estimate the optimal control path of different gases (Manne and Richels, 2001a) . Work in this vein has relied on unrealistically simplified climate and atmospheric chemistry relationships, so it does not provide
assurance that a single optimal path exists and that it is numerically feasible to solve for it. Absent in these efforts are important relationships among methane, the hydroxyl radical, tropospheric ozone and its precursors, nonlinearities and thresholds in climate dynamics, and issues involving aerosols and other climatically important substances. In addition, if the constraint is limited to stabilization rather than including additional tolerable rates of radiative forcing change constraints, the model will yield solutions that have little methane control until the decade prior to the constraint taking effect. In early periods, only the long lived gases – and mainly carbon dioxide – are expected to be controlled. Recently, more academic work has begun to have more emphasis on these other gases: they are especially prominent in the EMF-21 special issue of the Energy Journal (Weyant et al., 2006).
On the political side, we note that Kyoto’s ratification was dependent on the signatures of 55 Annex I Parties accounting for 55% of total carbon dioxide emissions – not GHG emissions – from those parties. Similarly, though the European Union has set a target of 2° C above preindustrial, in several documents they have gone on to state that the target can be met by achieving a 550 ppm CO2 target (European Parliament and the
Council, 2002). The Ministerial Declaration of the UNFCCC COP in 1996 stated a goal of “stabilization of atmospheric concentrations at twice pre-industrial levels”. It is likely that they set that goal with a doubling of CO2 in mind. And of course, emissions of gases are often measured in carbon equivalent by multiplying by their GWPs. Finally, the European ETS is indeed a CO2 only policy.
Despite the big picture emphasis on stabilization and CO2, shorter term climate policies do often include the possibility of trading among greenhouse gases by using the global warming potentials (GWPs) established by the IPCC in order to reach more economically efficient solutions than relying on CO2 reduction alone. Indeed, the Kyoto
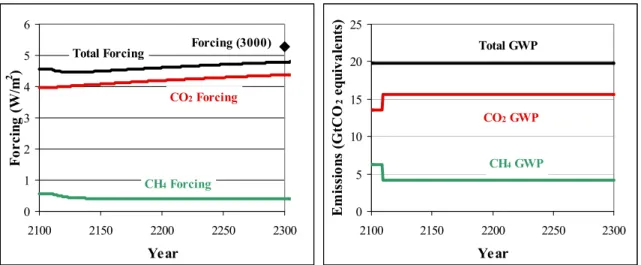
Protocol allows for precisely this sort of trading across greenhouse gases, using a 100-year GWP as the ‘exchange rate’. However, there is an inconsistency between the concept of stabilization and the use of these trading schemes. We note that trading schemes that rely on constant GWPs will not generate stabilization of concentrations or radiative forcing, because trading a reduction of a gas with a short lifetime for an increase of a long-lived gas will inherently lead to reductions in radiative forcing in the near term and increases in radiative forcing in the long term (and vice versa). Stabilizing radiative forcing would require trading concentration levels of one GHG for another, which would imply that in terms of emissions, emissions paths for each GHG be specified over at least the lifetime of the longest lived of the two. This can be seen logically if we consider the case where we allow a trade between a one time increase in CO2 emissions and a corresponding decrease in CH4 emissions. A one time trade based on GWP weighting would lead to an initial decrease in forcing, as the radiative forcing effects of a given mass of methane is larger than that of the GWP equivalent mass of CO2. However, within a few decades, methane concentrations would have returned to their equilibrium concentrations while CO2
Alternatively, we demonstrate the effects of a sustained change in emissions levels in Figure 1-1, using a highly simplified system where methane and CO2 are assumed to decay in the atmosphere with a constant lifetime. The simulation starts in 2100 with CO2 and CH4 concentrations both stable at 550 ppm and 1.8 ppm respectively. In 2110 methane emissions are decreased and CO2 emissions are increased. Again, the decrease in methane leads to a short term decrease in forcing. In this case, methane concentrations quickly stabilize at a lower level. CO2 concentrations, however, take hundreds of years to reach a higher concentration, and this increase in CO2 concentration will eventually lead to a net increase in forcing in the system, despite the GWP weighted sum of emissions remaining constant during the entire simulation. In the simulated case shown in the figure, the point at which the total forcing in the trading case exceeds the original forcing is reached within 70 years, and by the time CO2 concentrations finally stabilize, there has been an increase in total radiative forcing of more than 0.7 W/m2 (the diamond represents the total forcing reached in the year 3000).
0 5 10 15 20 25 2100 2150 2200 2250 2300 Year E m issi on s ( G tC O 2 e qui va le nt s) Total GWP CO2 GWP CH4 GWP 0 1 2 3 4 5 6 2100 2150 2200 2250 2300 Year F or cin g ( W /m 2 )
Total Forcing Forcing (3000)
CO2 Forcing
CH4 Forcing
Figure 1-1: The impact on radiative forcing (left panel) and emissions (right panel) of trading CH4 and
CO2 by constant GWP values in a simplified analysis
An interesting question can be raised as to what interests led the negotiators to adopt the precise language of the Article. Oppenheimer and Petsonk (2005) cite Reinstein, one of the US negotiators, as saying that some negotiators lobbied for language that would have defined danger in economic terms, which would have naturally led to a consideration of economic costs of policies being considered simultaneously with damages. We can hypothesize that it might have been in the interests of some negotiators to word a policy
that these hypothetical negotiators might have found natural allies with ecologists who often think naturally about long time scales. In addition to the issue that Article 2 does not encourage short term action, it also limits some approaches to long-term solutions. In Oppenheimer and Petsonk’s analysis of the historical origin of Article 2 they note that there exist alternative frameworks for long-term objectives “that are not consistent with the language of Article 2” such as technology-based approaches (Metz et al., 2002; Oppenheimer and Petsonk, 2005).
1.2.3 Avoiding Dangerous Anthropogenic Interference: The Ultimate Objective
Stabilization of greenhouse gases may be the means enshrined in Article 2, but the ultimate objective is prevention of dangerous anthropogenic interference in the climate system. Article 2 raises the question of temporal issues by noting that stabilization levels should be achieved within a time frame that allows adaptation by ecosystems. In a way, this is an implicit acknowledgment that stabilization by itself is not sufficient: that the path taken to achieve stabilization matters. One question is whether in fact this concept of a “path” which avoids dangerous anthropogenic interference might have been a more appropriate goal than stabilization.
Article 2 also makes a nod to economic realities by stating that the stabilization levels should be achieved in a manner consistent with sustainable economic development. It does not give any guidelines for resolving a potential conflict where stabilization cannot be achieved without impeding economic development, or considering possible tradeoffs between interference and development. It might be the case that the authors of Article 2 felt that economic costs would be taken into account regardless of inclusion in this statement – certainly economic interests have trumped environmental interests in the climate debate until now.
In any case, avoidance of dangerous anthropogenic interference in general refers to avoiding negative impacts on both human activities and ecosystems. These impacts
presumably scale with the magnitude of climate changes, and these climate changes should be related in some way to global mean temperature rise. Temperature rise itself is a
nonlinear function of radiative forcing in the atmosphere, and radiative forcing is a function of greenhouse gas concentrations. Therefore the idea that it is possible to limit
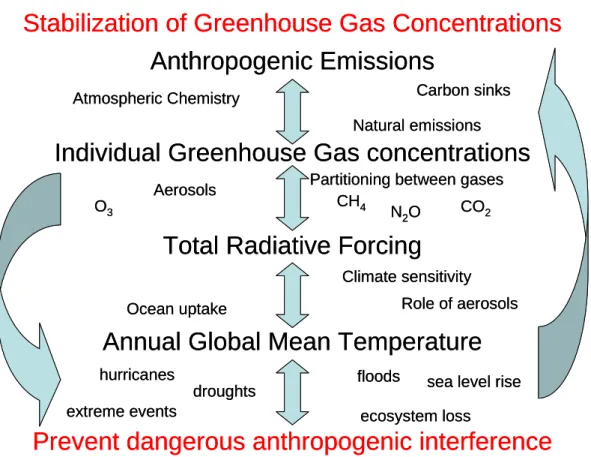
anthropogenic interference by controlling greenhouse gas concentrations does have validity. Figure 1-2 demonstrates one way to think about the stabilization cause-effect chain4. It is possible to design polices and/or goals attempting to control any one of the points on this chain: emissions, concentrations, forcings, temperature, or impacts, and there have been suggestions addressing all these possibilities. Economists tend to
concentrate on emissions, where there exists the most immediate link between policy and effect. Scientists usually use radiative forcing as a measure of choice, as a natural metric that is easily adapted for use in climate modeling.
Stabilization of Greenhouse Gas Concentrations
Prevent dangerous anthropogenic interference
Annual Global Mean Temperature
Total Radiative Forcing
Individual Greenhouse Gas concentrations
hurricanes sea level rise
droughts floods
ecosystem loss extreme events
Climate sensitivity
Ocean uptake Role of aerosols
Partitioning between gases Natural emissions
Anthropogenic Emissions
Atmospheric Chemistry Carbon sinks
CH4 CO
2
N2O
O3
Aerosols
Stabilization of Greenhouse Gas Concentrations
Prevent dangerous anthropogenic interference
Annual Global Mean Temperature
Total Radiative Forcing
Individual Greenhouse Gas concentrations
hurricanes sea level rise
droughts floods
ecosystem loss extreme events
Climate sensitivity
Ocean uptake Role of aerosols
Partitioning between gases Natural emissions
Anthropogenic Emissions
Atmospheric Chemistry Carbon sinks
CH4 CO
2
N2O
O3
Aerosols
Figure 1-2: The Stabilization Cause-Effect Chain
The concept of stabilization clearly targets concentrations as a goal. There are some advantages to addressing concentration for the purposes of making policy rather than impacts or temperature. First is that there is significantly less uncertainty in what
concentration will be achieved with a given emissions pathway than in what temperature will be achieved with the same pathway – most of the uncertainty in the climate system comes in terms of what temperature change results from a given forcing change, with this uncertainty mainly being a result of uncertainty in the magnitudes (or sometimes even signs) of various feedbacks and the rate of oceanic heat uptake. Second is that due to the inertia of the climate system there is a lag between reaching a given concentration and realizing the full impact of that concentration. Of course, one could use the same argument to imply that emissions should be the target rather than concentrations, especially given that regulations can more directly effect emissions. In general, moving up this cause-effect chain increases the ability to design policies to reach a given target with certainty, and therefore to understand the economic impacts of the policy.
The argument for moving down the chain is that if the final goal of policy is to actually reduce impacts, would impacts be a more relevant target? This is important not only because we care about the impacts specifically, but also to allow greater flexibility in how we achieve the goal. If we take emissions or concentrations as a goal, we need to determine an appropriate partitioning between gases (or an appropriate trading measure). Well-mixed gases in the atmosphere are effectively interchangeable as far as a climate model is concerned, and therefore the use of radiative forcing as a measure allows flexibility in determining gas concentrations. Targeting temperature or actual welfare impacts in unfortunately not only difficult for reasons of uncertainty mentioned above, but also because the variety in types of impacts and regions where the impacts occur make it difficult to even agree on a given target.
However there are, of course, some substances which have both climate and non-climate effects. Ozone, black carbon, NOx, and SOx all have direct health and ecosystem impacts as well as radiative forcing effects. Some substances change climate in complex ways that may not result in mean temperature change - black carbon can effect the hydrological cycle by warming the air column at high altitudes, and even in cases where this does not impact temperature it may change rainfall, cloud cover, and other important climatic attributes. It can be difficult to project concentrations from emissions due to uncertainties in atmospheric chemistry, natural emissions, or carbon sinks. Local
compare the global mean temperature impact of a given mean radiative forcing to that of well-mixed gases. There can be impacts on temperature due to albedo changes from land use change or urban expansion. CO2 itself has direct impacts, both positive in terms of increased agricultural yields and plant growth, and negative such as increased ocean acidity (Ruttimann, 2006) and increased growth of C3 weeds in competition with C4 crops such as maize and sugarcane. There are also feedbacks in the other direction, as climate changes impact the carbon cycle, atmospheric chemistry, the hydrologic cycle, and the economy. These, and a host of other potential complications, make the link between stabilization and dangerous interference less straightforward than might be hoped.
Examples of the kinds of dangerous interference that are to be avoided can include global sea level rise, increases in hurricane intensity or frequency (Emanuel, 2005; Webster et al., 2005), changes in precipitation patterns impacting agriculture, melting of permafrost, increases in heat wave frequency, loss of especially fragile ecosystems that have limited migration capabilities such as coral reefs, alpine ecosystems, and tundra, change of surface insolation impacting plant growth, changes of air quality, or a host of other impacts. It is unlikely that there could ever be an agreement as to what combination of these impacts might constitute the threshold of “dangerous anthropogenic interference”. There are some possible events, such as the total melting of the Greenland ice sheet leading to 7 meters of sea level rise or collapse of the thermohaline circulation leading to likely disruption of weather patterns around the North Atlantic and the loss of a major sink for heat and carbon, that are outcomes widely considered to be avoided at any cost.
However, given the ability of ecosystems and economies to adapt, it is an open question whether even such drastic events would be a problem given a long enough time scale. The current climate is not inherently superior to a world several degrees warmer or cooler. However, there is significant human and ecological capital invested under the current system which might need to shift for any new climate, and it is not obvious what a safe rate would be to allow such shifts to occur without excess disruption – indeed, current rates of change may already exceed this “safe rate” for the most sensitive ecosystems. In fact, before Article 2 was written, the WMO in 1988 produced a report with a rate of warming target (a “tolerable rate”) that was proposed as a long term objective that would have led to a very different emphasis in thinking (Oppenheimer and Petsonk, 2005), in a
similar fashion to UNEP and the AGGG in the 1980s (Corfee-Morlot and Hohne, 2003). The original proposed rate was 1/10th degree C per decade. The Dutch and US
governments apparently were proponents of the long term stabilization approach that became the UNFCCC objective, rather than, for example, the Enquete Commission goal of a reduction of fossil fuel use by 2050 to avoid 1 to 2 degrees C rise in that time frame (Enquete Commission, 1989).
A potential problem is that even with a fairly slow rate of change, there may be tipping points where a rapid change is triggered. Is there a critical temperature at which the interior of the Greenland ice sheet will start melting, leading to total loss of the ice sheet on the time scale of decades? Or a threshold that will cause methane release from tundra or clathrates at a scale that will cause further rapid temperature increase? Is the Amazonian rainforest in danger of entering a dangerous cycle where, rather than “rain following the plow” as in the hopes of Western settlers in the 19th century, drought will follow the loss of vegetation yielding a rapid transformation from rainforest to savannah or desert? If we should pass any of these poorly understood thresholds it will become impossible to turn back without resorting to geo-engineering solutions which may prove as dangerous as the problem which they were meant to solve.
Not only is there no agreement on what constitutes dangerous anthropogenic interference, but global warming will certainly have very different impacts on different regions, and for some temperature changes some sectors in some regions may be positively effected by climate change. Vulnerability comes into play here, with developed nations more able to adapt by shifting infrastructure and using technologically (and often energy) intensive solutions to weather changes. Examples include air conditioning for heat waves, irrigation for droughts, dikes and levees for sea level rise, and so forth. However, recent events such as hurricane Katrina and the 2006 heatwave in California in the US, and the 2003 heatwave in Europe, show that even in very rich nations these potential solutions are not always well implemented. Less developed nations have less ability to adapt, and will therefore suffer more from climatic change. This implies that, perversely, those nations which are the most vulnerable are often those with the weakest economies, and therefore the fewest emissions. Meanwhile, the nations with the most emissions and therefore greatest impact on climate change have less incentive to reduce future warming and would
bear more of the cost of reducing emissions, and therefore would be likely to set a threshold for dangerous anthropogenic interference at a much higher level than the vulnerable, poorer nations.
But the most important question for any ultimate objective is the impact that the goal has on near term policy. And all the uncertainty and complications involved in defining “dangerous anthropogenic interference” may serve to only delay action rather than promote actual solutions.
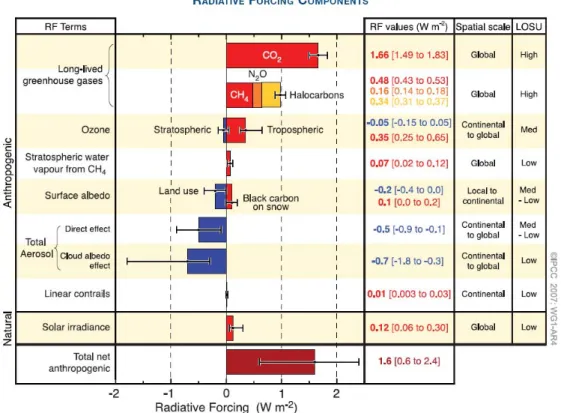
Figure 1-3: Global average radiative forcing (RF) estimates and ranges in 2005 for anthropogenic carbon dioxide (CO2), methane (CH4), nitrous oxide (N2O) and other important agents and
mechanisms, together with the typical geographical extent (spatial scale) of the forcing and the assessed level of scientific understanding (LOSU). The net anthropogenic radiative forcing and its range are also shown. These require summing asymmetric uncertainty estimates from the component terms, and cannot be obtained by simple addition. Additional forcing factors not included here are considered to have a very low LOSU. Volcanic aerosols contribute an additional natural forcing but are not included in this figure due to their episodic nature. The range for linear contrails does not include other possible effects of aviation on cloudiness. Figure SPM-2 in the AR4 Summary for Policymakers (Alley et al., 2007)
1.3 Key Gases
1.3.1 The Emphasis on CO2
Carbon dioxide is widely acknowledged to be the largest anthropogenic contributor to greenhouse forcing. CO2 has been recognized as a GHG since the times of Tyndall and Arrhenius. The recognition of the primacy of CO25 is demonstrated by Arrhenius’s statement that the absorption of the atmosphere was “not exerted by the chief mass of the air, but in a high degree by aqueous vapour and carbonic acid, which are present in the air in small quantities.” (Arrhenius, 1896) He even calculated the temperature change that would result from increases in carbon dioxide concentrations, estimating that a doubling of CO2 would yield about 5° Celsius warming. And today climate sensitivity, a common metric for the equilibrium temperature response to a forcing change, is in fact defined based on forcing resulting from doubled CO2 concentrations – despite the fact that the concept “climate sensitivity to forcings” exists (Hansen and Sato, 2004). The IPCC Fourth Assessment Report Summary for Policymakers (Alley et al., 2007) shows forcing
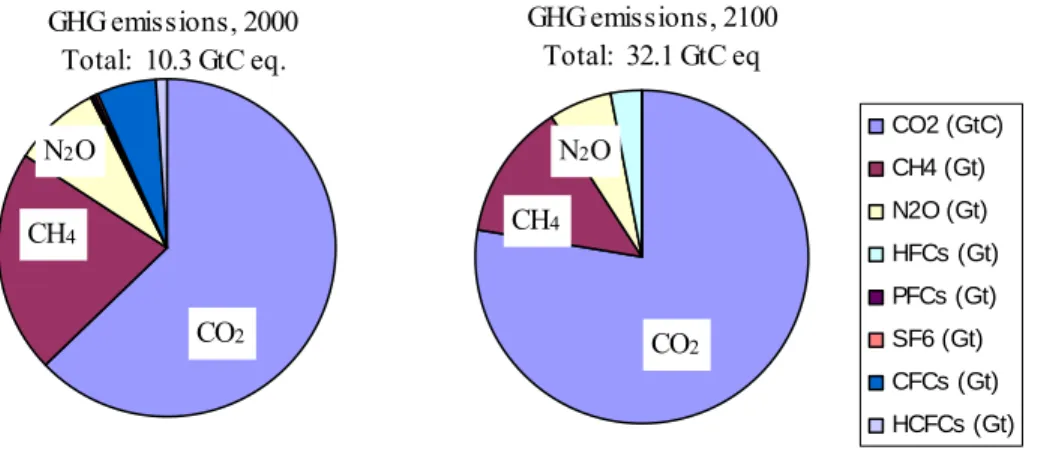
contributions of increases in greenhouse gases beyond their preindustrial levels in their standard chart (Figure 1-3), with CO2 contributing 60% of well-mixed gas forcing. This matches estimates from the MIT Integrated Global Systems Model (IGSM, discussed in more detail in the Appendix B). Similarly, using 100-year GWP weighted emissions6 (Figure 1-4) from EPPA in 2000, CO2 accounts for more than 60% of anthropogenic greenhouse gas emissions. Fossil carbon dioxide emissions are estimated in the AR4 Summary for Policmakers to be 6.0 to 6.8 GtC (Alley et al., 2007). And given a reference forecast of emissions, by 2100 CO2 may contribute 75% of GWP weighted emissions and almost 75% of forcing increase from preindustrial times (Figure 1-4 and Figure 1-5).
5 Along with water vapor, but as the quantity of water in the atmosphere is a function of the climate system and not direct emissions, water vapor is always treated as a feedback rather than as a direct GHG. 6
GWP weighting is still perhaps the best simple way to compare emissions of different gases, for all the limitations of the methodology. It is certainly the most widespread and widely accepted. Therefore, while we will attempt to include more direct measures such as radiative forcing or temperature impacts where possible,
GHG emissions, 2000 Total: 10.3 GtC eq. CO2 CH4 N2O GHG emissions, 2100 Total: 32.1 GtC eq CO2 (GtC) CH4 (Gt) N2O (Gt) HFCs (Gt) PFCs (Gt) SF6 (Gt) CFCs (Gt) HCFCs (Gt) CO2 CH4 N2O
Figure 1-4: EPPA reference scenario emissions weighted by 100 year GWPs
2000 Forcing from Preindustrial Total Forcing: 2.4 W/m2
CH4
CO2 N2O
Halocarbons
2100 Forcing from Preindustrial Total Forcing: 8.6 W/m2
CH4
CO2 N2O
Halocarbons
Figure 1-5: EPPA reference scenario, forcing from preindustrial
As has been pointed out by (Hansen et al., 2000), much of the forcing resulting from historical CO2 emissions has been partially balanced by the sulfate aerosols that were produced concurrently – however, with the advent of pollution control equipment, the ratio of CO2 to sulfate emissions has increased greatly, and in any case the century scale lifetime of CO2 means that carbon dioxide is a stock problem whereas aerosols have a lifetime measured in weeks (Andreae et al., 2005; Novakov et al., 2003).
Carbon dioxide concentrations have risen from approximately 278 ppm preindustrial (Ramaswamy et al., 2001) to 377 ppm in 2004 (Keeling and Whorf, 2005). Atmospheric increases during the 1990s averaged 3.2 PgC/yr (IPCC) or about 1.5 ppm/year. Because increases in CO2 concentrations are responsible for 60% of well-mixed gas forcing
increases from preindustrial, it can be argued that CO2 has been historically been the most important of the greenhouse gases. CO2 is an inherent product of fossil fuel combustion,
and emissions are likely to grow significantly because in the absence of strong policy action fossil fuels are likely to provide the majority of worldwide energy for the
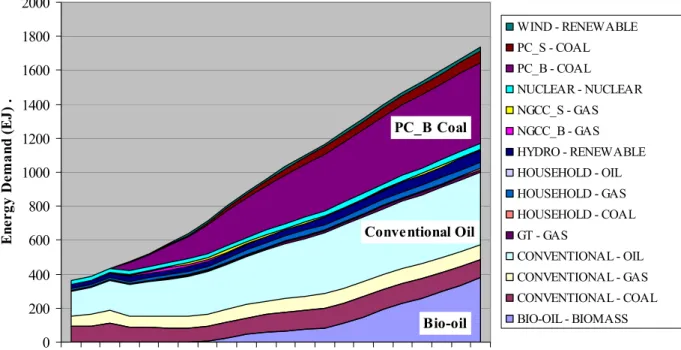
foreseeable future, and energy use is projected to continue to grow as economies grow. Therefore, CO2 is likely to continue to be the largest contributor to anthropogenic greenhouse gas forcing in the future. Unlike other pollutants, CO2 is very difficult to eliminate with the use of pipe technologies. The closest approximations to end-of-pipe control involve controversial7, expensive, and energy intensive solutions such as capturing CO2 and depositing it into oceanic or geological reservoirs, or novel but largely untested approaches such as using flue gases to grow algae (Schwartz, 2004). This lack of accepted end-of-pipe measures means that CO2 may also be the most difficult of the greenhouse gases to abate. 86% of energy production in 2004 came from fossil fuel sources (U.S. Department of Energy, 2004), and energy use is projected to continue rising rapidly. The US DOE and EPPA both project a 50% increase in global energy use in the next 20 years (U.S. Department of Energy, 2006), and EPPA furthermore projects a fourfold increase in energy production by the end of the century (Figure 1-6).
Implementation of international greenhouse gas reduction policies such as the Kyoto Protocol has been slow, and was only ratified after last minute concessions and the
withdrawal of the United States and Australia. Analysis suggests that the Protocol may now be non-binding if full use is made of available “hot air”. The pace of the Kyoto Protocol’s implementation is a contrast to the implementation of chlorofluorocarbon controls in the Montreal Protocol. This difference is likely due in large part to the difficulty of reducing CO2 emissions. Because of the linkage between CO2 intensive energy production and economic growth there is a fear that CO2 constraints will lead to an economic competitive disadvantage between nations adopting CO2 emissions restraints and unconstrained nations. In addition, the fossil fuel industry is politically powerful. The influence of the fossil industry is especially strong in the US, which accounted for 22% of global CO2 emissions in 2004 (U.S. Department of Energy, 2004). While there are many factors involved in why the US was one of two nations to withdraw from the Kyoto process, the power of the local fossil fuel lobby is likely one of them.
7 CO
A counterpoint is that the European Trading System (ETS) only covers carbon dioxide emissions, and yet was implemented fairly rapidly. Oddly, initial trading in the ETS for the first time period yielded very high carbon dioxide prices up to 30 euros, implying that most of the industrial participants expected the constraints to be binding and difficult to meet. On the other hand, academic analyses (Reilly and Paltsev, 2005)
predicted very low prices more in line with current prices of a euro per ton CO2. It is not clear whether the national negotiators had beliefs more in line with the academics or with the industries that held onto their permits until the first inventories demonstrated that the initial carbon allocations were in fact quite generous. However, regardless of the
perception of the difficulty of meeting the ETS constraints, an initiative entirely within the boundaries of the European Union will have very different barriers to implementation than a more international policy.
0 200 400 600 800 1000 1200 1400 1600 1800 2000 1997 2005 2015 2025 2035 2045 2055 2065 2075 2085 2095 Year E ne rgy D eman d ( E J) . WIND - RENEWABLE PC_S - COAL PC_B - COAL NUCLEAR - NUCLEAR NGCC_S - GAS NGCC_B - GAS HYDRO - RENEWABLE HOUSEHOLD - OIL HOUSEHOLD - GAS HOUSEHOLD - COAL GT - GAS CONVENTIONAL - OIL CONVENTIONAL - GAS CONVENTIONAL - COAL BIO-OIL - BIOMASS PC_B Coal Conventional Oil Bio-oil
Figure 1-6: EPPA reference projection of Energy Use by Technology and Fuel
CO2 is also unique among the greenhouse gases in terms of its lifecycle. N2O
degrades mainly through photodissociation, CH4 and the hydrofluorocarbons react with the hydroxyl radical, CFCs are destroyed in the stratosphere, and perfluorocarbons and sulfur hexafluoride (SF6) degrade through photolysis in the mesosphere, but CO2 has a very
different pathway. Because carbon in the atmosphere eventually oxidizes to CO2, it is often more relevant to track overall carbon than CO2 itself. Elemental carbon is of course never destroyed. Rather, in the short term CO2 in the atmosphere can be transformed into carbon compounds in the biosphere through biochemical plant photosynthesis pathways, or into carbonates in the ocean by exchange into the surface layer followed by a slow process carrying carbon down into the deep ocean until the ocean and atmosphere reach
equilibrium. Therefore, burning fossil fuels effectively moves carbon from geological storage into the ocean/ecosystem/atmosphere stock permanently, in the absence of
technologies such as carbon sequestration. There are geological processes that eventually bury carbonates in the deep ocean sediments, bury surface organic matter sufficiently deeply to take it out of the available carbon pool, or capture CO2 through chemical weathering, but these mechanisms are all slow enough that they can be ignored on human timescales.
One difficulty in predicting future CO2 concentrations is uncertainty about the behavior of various components of the carbon cycle. We cannot even accurately allocate current fluxes with significant certainty between these components. Sabine et al. (2004) provide a summary of recent estimates of global fluxes in the carbon cycle, showing a range of uncertainty for the different components. The increase of CO2 in the atmosphere can be measured precisely, and anthropogenic CO2 sources from fossil fuels are fairly well understood. There is greater uncertainty in partitioning the remainder of the carbon cycle between the ocean sink and the terrestrial sink, and within the net land-atmosphere flux there is further uncertainty in partitioning between emissions from land-use change and uptake. Median estimates of the net sink (ocean uptake plus net terrestrial flux) center around -2.6 PgC yr-1 from various studies for the 1980s and 90s, but with significant uncertainty. There is less agreement about the land use change component of the total terrestrial sink, ranging from a median estimate of a carbon source of +0.9 PgC yr-1 (DeFries et al., 2002) to +2.2 PgC yr-1 (Houghton, 2003), and the IPCC AR4 estimates a source of 1.6 GtC from land use change with a range from 0.5 to 2.7 GtC for the 1990s (Alley et al., 2007). This historical uncertainty leads to even greater uncertainty in future projections. The response of the ocean to saturation of the upper layers, or temperature impacts on circulation, is poorly understood, but may lead to a significant decrease in
ocean uptake in the future. The role of land-use change is clearly very important, but the accuracy of current models is limited. Another issue resulting from the complications of the carbon cycle is the difficulty of assigning CO2 a single “lifetime”. The IPCC Technical Summary of Working Group I (Albritton et al., 2001) lists a lifetime of “5 to 200 yr”. Indeed, given the length of time that a ton of fossil carbon once burned will remain in the ocean/atmosphere/ecological system, lifetime may not even be the appropriate concept to use (Tans, 1997). Of course, because CO2 is the gas against which all other greenhouse gases are measured, changes in how the carbon cycle is calculated will then lead to changes in the GWP weightings of every other gas.
Distribution issues are also worth noting. CO2 emissions also form a higher percentage of emissions from developed economies. In 2000 80% of GWP weighted Annex B emissions were from CO2, compared to only 57% of non-Annex B emissions (EPPA calculations). By 2100, in the reference EPPA scenario, the share of CO2 in total global emissions grows. In Annex B nations, the share of CO2 emissions reaches 88%, but even in the non-Annex B nations it grows to 71%. These values do not include
deforestation emissions, which would obviously contribute to the CO2 share in non-Annex B nations in early periods, but the inclusion of deforestation emissions (or of agriculture and forest sinks) in policies remains a complicated issue. As the Byrd-Hagel resolution (Sen Byrd, 1997) and the recent Methane to Markets Initiative (US Environmental Protection Agency, 2006b) and the Asia-Pacific Partnership on Clean Development and Climate (Office of the Press Secretary, 2005) show, the inclusion of non-Annex B countries – especially China and India – is important politically at the federal level for US policy. Given that these non-Annex B nations have a large share of non-CO2 emissions with cheap abatement potential, inclusion of these nations in global climate policy could perhaps concentrate on these substances.
1.3.2 The Potential of Methane
CO2 is the past and present and projected future largest contributor to anthropogenic well-mixed greenhouse gas forcing. However, the 2nd largest contributor is worth
level of 700 ppb to a current concentration of about 1775 ppb has led to an increase of 0.5 W/m2, nearly a third of the contribution from CO2. We project a continued increase in methane concentrations over the century, though not to the same extent that CO2 concentrations increase. We have a more detailed analysis of methane in the second chapter of this thesis, as well as in Appendix E, but there are some attributes of methane that are worth mentioning here.
The first attribute is that methane has a much shorter lifetime than CO2. We discussed one of the implications of this when we showed that two “GWP equivalent” scenarios will have different outcomes in terms of radiative forcing over time. However, the lifetime of methane actually depends on the oxidative capacity of the atmosphere, whereas the “lifetime” of CO2 as discussed above is a reflection of the carbon cycle. This means that the lifetime of methane will change depending on what other substances are being emitted in large quantities, including emissions of methane itself. Indeed, if
emissions of methane increase substantially, this will lead to an increase in the lifetime of the gas, and therefore in a positive feedback loop even higher concentrations than would otherwise be expected. Additionally, increased methane emissions also lead to increased ozone concentrations through the interaction with the ozone cycle, and ozone has both health impacts and additional forcing impacts.
While 75% to 90% of carbon is emitted by fossil fuel combustion (Alley et al., 2007), only about 10% of methane comes from the fossil fuel sector, and that mainly in the form of leakage during exploration, production, transport, and utilization (Chen and Prinn, 2006). Most of the remaining anthropogenic methane emissions are produced as a result of anaerobic processes in the agriculture and waste disposal sectors. There are many
inexpensive abatement options available in these sectors, some of which carry the
additional benefit of capturing the methane for use as an energy source thereby potentially displacing additional greenhouse gas emissions. Due to the inexpensive abatement options and significant contribution to forcing, we felt that methane was worth individual
consideration rather than just being included among a host of other gases. However, it is important to note that the nature of methane sources makes them difficult to quantify. As we demonstrate in the next chapter, our results show that methane is not only worthy of