Publisher’s version / Version de l'éditeur:
Vous avez des questions? Nous pouvons vous aider. Pour communiquer directement avec un auteur, consultez la première page de la revue dans laquelle son article a été publié afin de trouver ses coordonnées. Si vous n’arrivez pas à les repérer, communiquez avec nous à PublicationsArchive-ArchivesPublications@nrc-cnrc.gc.ca.
Questions? Contact the NRC Publications Archive team at
PublicationsArchive-ArchivesPublications@nrc-cnrc.gc.ca. If you wish to email the authors directly, please see the first page of the publication for their contact information.
https://publications-cnrc.canada.ca/fra/droits
L’accès à ce site Web et l’utilisation de son contenu sont assujettis aux conditions présentées dans le site LISEZ CES CONDITIONS ATTENTIVEMENT AVANT D’UTILISER CE SITE WEB.
Journal of the Acoustical Society of America, 73, 6, pp. 2051-2058, 1983-06
READ THESE TERMS AND CONDITIONS CAREFULLY BEFORE USING THIS WEBSITE. https://nrc-publications.canada.ca/eng/copyright
NRC Publications Archive Record / Notice des Archives des publications du CNRC :
https://nrc-publications.canada.ca/eng/view/object/?id=986e6ace-2cb0-4431-973a-2e03ad7fbfb1 https://publications-cnrc.canada.ca/fra/voir/objet/?id=986e6ace-2cb0-4431-973a-2e03ad7fbfb1
NRC Publications Archive
Archives des publications du CNRC
This publication could be one of several versions: author’s original, accepted manuscript or the publisher’s version. / La version de cette publication peut être l’une des suivantes : la version prépublication de l’auteur, la version acceptée du manuscrit ou la version de l’éditeur.
Access and use of this website and the material on it are subject to the Terms and Conditions set forth at
Experience with new auditorium acoustic measurements
Ser
TK1
National Research
Conseil national
N21d
l*
Council Canada
de recherches Canada
1.
1116
c . 2EXPERIENCE WITH NEW AUDITORIUM ACOUSTIC MEASUREMENTS
by J.S. Bradley
Reprinted from
Journal of Acoustical Society of America Vol. 73, No. 6, June 1983
p. 2051
-
2058DBR Paper No. 11 16
Division of Building Research
Comme l e temps de r'everb'eration e s t un paramstre inad'equat pour d'eterminer l a q u a l i t ' e d'un auditorium, beaucoup de nouveaux param'etres o n t gt'e propos'es. Parmi ceux-ci
les
r a p p o r t s s o n s e n avance-
sons e n r e t a r d e t l a c o r r ' e l a t i o n i n t e r a u r a l e s o n t d e s paramstres gendralement accept& pout q u a n t i f i e r les deux p r i n c i p a u x c r i t s r e s de q u a l i t ' e acoustique. La pr'esente Etude comprend un grand nombre de mesures d e c e s param'etres dans d e s s a l l e s de 200 Zi 2 500 si'eges. Le b u t d e l ' g t u d e e s t de r e n d r e p l u s f a m i l i e r s l e s nouveaux paramstres, de p u b l i e r p l u s de donnges e t d ' a n a l y s e r l'interd'ependance d e ces paramstres avecles a u t r e s . Les v a r i a t i o n s d e s nouveaw param'etres o n t Et'e examin'ees
2
l ' i n t ' e r i e u r d e s s a l l e s . Des s a l l e s q u i o n t un temps de r'everb'eration semblable montrent d e s diff'erences n e t t e s l o r s q u e l ' o n u t i l i s e comme parametre l e r a p p o r t sons e n avance-
sons en r e t a r d .Experience with new auditorium acoustic measureme
(Rece As th t---.
Bradley
,n of Build rh, Nation a1 Research Council Canada. Ottawa, Canada KIA
:ived 19 August 1982; accepted for publication 7 March 1983)
3f auditor
.
..
e inadequacy of reverberation time as a predictor of the acoustical quality (
oeen recognized, many new measures have been proposed. Of these, early-to-late souna ratlos ana interaural cross correlations are generally accepted as correlates of two major aspects of acoustical quality. Accordingly, the present work includes a large number of measurements of these quantities in halls ranging from 200 to 2500 seats. The purpose of the work was to improve familiarity with the newer measures, to provide more published data, and to explore the dependence of these measures on other quantities. Variations of thenew measures were examined within and among halls. Halls that are apparently similar in terms of reverberation times showed clearly identifiable differences when early,to-late sound ratios were considered.
PACS numbers: 43.55.Gx, 43.55.Fw, 43.55.Br INTRODUCTION
Reverberation time was for a long time regarded as the principal objective quantity in the acoustical design of halls and auditoria. It is now generally accepted that it is not the sole design quantity, and Jordan,' for example, has referred to
". .
.
the utter insufficiency of RT as an acoustical crite- rion for large halls. .
.
."
In the last two or three decades a large number of new measures have been proposed, with the result that there is now a confusing array of acoustical mea- sures with quite varied degrees of support in the literature. Some have merely been proposed as "good ideas," while oth- ers have been tested in subjective studies. Although one can certainly not claim that the acoustical design of auditoria is completely understood, there does appear to be a developing consensus regarding the types of acoustical measures that should be made.There are probably four important types of measure. First, those of clarity or definition that relate to the concept of speech intelligibility for speech sounds and can be consid- ered as monaural effects. Acceptable clarity, definition, or speech intelligibility relate to sufficient early sound energy. Too much early sound leads to a lack of fullness and blend in music sounds; too little early sound creates a muddy sound. Second, there are measures of what Barron2 has termed spa- tial impression that relate to binaural hearing phenomena, including a sense of envelopment in the sound, and subjec- tively perceived source broadening. This is the feeling of be- ing immersed in the sound and not just "looking" at it, and can be compared with the difference between listening to monaural and stereophonic sound reproduction. Adequate
i a has
contributing to the intelligibility of speech sounds and t o the clarity or definition of musical sounds. Shortly after Haas' work, Thiele5 proposed the quantity Deutlichkeit
(P
\-- -
measure of clarity:D
=,r
p2(t )d{lm p2(t )dr.As defined, Deutlichkeit is the ratio of the early sound ener- gy in the first 50 ms after the arrival of the direct sound to the total sound energy. Thiele reported extensive measurements of De~tlichkeit'.~ in a number of rooms nearly 30 years ago. Schultz7 published measurements of a quantity R that he referred to as a reverberant-to-early sound ratio:
R = l o log(f p2(t )d{rp2(t )dl).
0.05 (2)
Reverberant energy in this context has not the conventional meaning, but actually refers to late-arriving sound energy following after the early sound. Assuming that the sound arriving after the first 0.5 s contributes a negligible amount of sound energy, it is readily shown that R is related to Deut- lichkeit by the following expression:
Schultz refers to his reverberant-to-early sound ratio as a measure of the balance between definition and blend. A number of other ratios of early-to-late-arriving sounds have been considered, including Reichardt's8 measure of clarity that incorporates an 80-ms limit for early sound:
spatial impression relates to sufficient early lateral sound This early sound limit was intended to be more suitable for energy. As third and fourth types of measures, the overall music than the 50-ms limit. There is evidence that a variety strength of the sound in the room and the tone color impart- of measures are similarly indicative of the relative strength of ed by the room seem to be i m p ~ r t a n t , ~ but these are less early reflections and are inter~orrelated.'.~ These include clearly defined. The first two of the four types of measure measurements of rise time, early decay times, and various have received the most attention, and it is these that are ratios of early- and late-arriving sounds. In this paper mea- considered in this paper. surements were made in terms of Schultz' reverberant-to-
A. Monaural, measures early ratio because it seemed the most appropriate for overall comparison of rooms in which both sveech and mur After the pioneering work of H a a ~ , ~ the subjective im- performed, and because it allowed easy cornparisor portance of early reflected sound has been appreciated as published data from both Schultz and Thiele.
;ic are I with
level or Lochne~ between - 1 - - -
sures
sus. Aft1 " in 19 npression.
.
er earlie 168 demc L and app.
. .
Consideration of the binaural phenomena associ
with spatial impression due to adequate early lateral sc
has developed more recently and has not reached the t
f consen r related work
r,I0 Keet mstrated the rel;
spatial i~ arent source width
also snowed that me snort-term inreraural cross correlation
between signals at the two ears during the first 50 ms after the arrival of the direct sound is linearly related to spatial
impression. At about the same time West,'' and later P o - -
shall,I3 suggested that the ratio of height to width of a contributes to'an appropriate spatial impression. Mor
cently
and^'^.'^
has continued the investigation of iilte~-aural cross correlations (IACC) and demonstrated with syn- thesized sounds that IACC values are related to the subjective preference for sound fields. In a large subjective comparison of a number of European halls, Gottlob9 found IACC values to be of particularly high subjective relevance independent of reverberation times. Although Barron's re- sults' again demonstrated that the IACC related to subjec- tively perceived spatial impression, in more recent work16 he
has preferred to consider lateral energy fraction
Lf
the ratioof early lateral energy (over the first 80 ms) to total early energy. Similarly, Reichardt and Lehman8 have used a mea- sure of room impression that involves early- and late-arriv- in$ sound measurements, using directional microphones. In the present work short-term IACC values were measured since this seemed to be the best-established measure of spa- tial impression. In addition, directional microphone arrays were used to obtain early-to-late sound ratios in the lateral and medial planes that would allow examination of the inter- relation of such measures of spatial impression and IACC values.
In reviewing the literature it was concluded that mea- sures of clarity or definition and measures of spatial impres- sion are generally important correlates of at least two of the major dimensions of the acoustical quality of halls and audi- toria. Further, it was assumed that although a variety of physical measures have been proposed, most are closely re- lated to each other in one of the two groups. In short, there was a sort of consensus, but in a number of areas practical information is lacking. Most published work has been in the form of research studies and practical measurement proce- dures have not always been established. There are generally very few published data for any type of measured early-to- late sound ratios in actual halls, and measurements relating to spatial impression are even more difficult to find. As these quantities are all relatively new, there is no evidence of an understanding of how they are related to other physical and acoustical properties of rooms, and there is not the general appreciation of these quantities that exists among acousti- cians for reverberation time data. Finally, there appears to have been no consideration as yet of how to design a new hall so as to achieve the desired values of these quantities.
The present work is an attempt to provide more infor- mation in a number of these areas. Reverberant-to-early sound ratios (R ) were measured with omnidirectional and directional microphones, and interaural cross correlations
2052 J. Acoust. Soc. Am., Vol. 73, No. 6. June 1983
iated ~ u n d same with ition
I.
He ..
V L 4 1 - hall e re- .-*--~ A L L ~ were also measurea. 1 nese were made at a numix positions in halls of a very large range of sizes,
2500 seats. It was intended to provide more a range of data than has previously existed. It w;
that it would be possible to ( improved understa
ing of the physical relations ~ e s e and various ot
geometrical and acoustical I Ultimately it was
ticipated that this type of intormarion would enable qua
tive design procedi ures to be develope
among tl measures.
c. --- .L:.
I. MEASUREMENTS AND PROCEDURES
,
from 20( nd a broa B also ho ; and ninc..
.
:her an-. .
: re- vcr- isurements were made at between sixcelver positions in each of 1 1 rooms. Omnidirecalona~ re. ,-
berant-to-early sound ratios (R values) were measured as
well as reverberant-to-early ratios in the lateral and medial planes. In addition, interaural cross correlations (IACC) were measured at each position. Measurement proced~ were as much as possible a practical compromise, incoq
ating common acoustical equipment where possible. '
included the tape recording of pistol shots and the us octave band filters. Although the data were processec
computer, the calculations could have been performed 1
small microcomputer.
A 0.38 caliber blank pistol was used as the sol source. Each measurement at each position was an aver of the results of three pistol shots, which were recorded u! inexpensive 1-cm electret microphones that had a flat-
quency response
+
2 dB over the range of interest (fromHz to 10 kHz). The response was only slightly irregula the highest octave band of interest, the 8-kHz band. As be seen, little use was made of the measurements in tht kHz band. A line array of five microphones with a 6.3. spacing between microphones was used to record lateral and medial plane results. The lateral plane was considered to be the one parallel to the floor through the listener's ears. The medial plane was considered to be that perpendicular to it, bisecting the plane of symmetry of the head of a listener facing the center of the stage or the front of the room. The beam widths of the line array were measured at 1000, 2Cnn and 4000 Hz to be 49", 26", and 15", respectively, between
- 3-dB points. In the worst case, at 4000 Hz, side lobes M
no greater than - 14 dB relative to the mainlobe.
The tape-recorded pistol shots were processed by cc puter by digitizing the parallel outputs of the seven oct filters from 125 Hz to 8 kHz. Thus all early-to-late sol ratios and reverberation times were calculated numeric; in octave bands. Early sounds were those arriving in the f
50 ms after the direct sound. Late-arriving sounds N
those arriving in the period 50-500 ms after the direct sou Reverberation times were calculated from least-squares to the late-sound energy decay envelope, considered in tel of the logarithm of the rms pressure versus time.
IACC's were calculated from dual-channel pistol shot recordings obtained with microphones positioned at the ear canal entrances of a live subject. The A-weighted pistol shot recordings were low-pass filtered with an upper limit of 4000 Hz. The signals were again processed by computer and the autocorrelation functions for each signal were produced as ures !' or- rhis und 'age
...-.
Yl116 fre- 1'80 r in NU, the rere >m- ave ~ n d ally irst 'ere nd. fits m s,E I. Detail: s of eleven f can cc msider the vanarion or rnese omniairecrionzu I ratios
within and among 1
-
-
Hall -2000 Hz) both F
I. Wih
Vol (m3) No. of Seats
hin-hall variations
'able I1 gives the measured n range of seat-to- ariation, in each octave bar 11 halls, of the lirectional reverberant-to-eal (R ). Hall 9 quite consistently had the largest within-hall ranges for all I
octave band. For all halls the ranges were larger in the two octave bands. In all but one hall the within-hall were largest in the 125-Hz octave. Even in the 1000-HZ oc- tave band within-hall variations of up to 8.2 (
in Table 11.
In attempting to determine the cause of v v 1 C i l l u - 1 1 a 1 1 V a l
-
iations the spatial standard deviations were correlated with various quantities for the lp00-and 2000-Hz results. These quantities were volume, mean width, and mean height. In addition, the 2000-Hz spatial standard deviations were cor- related with the 2000-Hz R values and the 2000-Hz rever- beration times. None of these correlations produced statisti- cally significant results. One can expect that both small and large halls may exhibit similar seat-to-seat variations. For example, hall 1 1, with the largest volume, had a range of R values at 1000 Hz of only 1.8 dB, while halls 6 and i approximately 1/10 the volume of hall 11, had much within-hall variations (4.8 and 5.2 dB, respectively).Figure 1 plots R values versus frequency for the nine measurement positions in hall 8. In this form the data serve only to illustrate the general pattern and overall magnitude of the within-hall variations for this auditorium; the 2000- Hz R values for it are plotted on the floor plan in Fig. 2. As in many other cases, there is a tendency for R values to be greatest at positions near the center and towards the rear of the room owing to lack of early reflected sounds at these positions. Positions 7, 8, and 9, for which data are presented in Fig. 1, were in the balcony above positions 6, 5, and 3, respectively.
In an attempt to present the data in a less confusing form, Fig. 3 shows the R values in a manner that permits one to infer seat-to-seat variations in spectral balance. Here the R values were averaged over two ldw-frequency octave bands (250 and 500 Hz) and over two high-frequency octave bands (2000 and 4000 Hz) and plotted as a function of receiv-
1 seat v, omnid mean and ~d for all rly ratios I )ut orie lowest ranges
--
dB are inc '",;+I.;.. h. licated .ll . m r well as the crc n-I-. ...&Isignals at the two
UUJ. UIIIY LUG a l l y s u u ~ ~ u , rrlar IS, me sound arriving in the first 50 ms after the direct sound, was considered, and the maximum time shift used was f 1.0 ms. The maximum val- ue of the cross correlation function within this range was the
IACl sely followed that of Gott-
~ s s correle
--..I--
ween the I
- LL - - - - -
C value.
:
edure clo!II. RESULTS 1, with
larger A. Basic data
Table I giVGa uaalb information for the 11 halls, includ-
ing volume, number of seats, and mid frequency reverbera- tion time. The reverberation times are overall averages from all receiver positions and are averages of the results obtained .ee octave bands, 500,1000, and 2000 Hz. All measure- s were made in unoccupied halls, and they were not at :presentative of the acoustical conditions of occupied halls. Accordingly, the individual halls are not identified, but were located in London, Hamilton, and Toronto, Can- ada. Four were used strictly for speech, while the remaining seven were to some extent multipurpose. They were selected to provide the widest possible range of hall sizes.
in t h ~ ment
' all re
. ..
B. Monaural effects
The omnidirectional reverberant-to-early ratios were considered to be related to the monaural subjective effects of speech intelligibility and to music clarity and definition. One
TABLE 11. Mean (M) and range ( R ) of octave band reverberant-to-early sound ratios.
Hall 125 250 500 lo00 2000 4000 8000 M R M R M R M R M R M R M R 1 2.1 5.7 3.4 6.3 3.2 2.6 3.3 3.0 3.1 2.5 1.9 1.6 0.4 2.8 2 - 3.0 7.1 - 0.1 4.7 - 1.6 2.7 - 1.1 2.5 - 0.9 0.9 - 0.4 2.6 - 2.9 2.5 3 1.5 5.3 4.7 3.8 2.9 4.9 2.6 1.5 3.2 1.0 3.1 1.4 0.7 1.4 4 1.6 5.7 1.8 3.4 0.5 4.2 1.1 2.9 1.2 1.9 1.4 1.3 - 1.6 1.1 5 3.3 6.0 3.4 6.5 2.5 2.8 2.5 1.6 2.5 1.5 3.0 1.3 -0.4 1.5 6 1.1 7.0 - 0.3 5.8 0.4 4.6 0.2 4.8 1.2 5.0 2.0 3.4 - 0.8 4.4 7 0.9 8.7 - 0.6 6.8 - 1.0 6.4 - 0.6 5.2 0.3 5.1 1.5 3.1 - 1.0 3.0 8 3.3 12.5 3.2 5.8 2.9 5.7 3.3 4.8 4.0 4.8 3.6 4.5 1.2 3.2 1.4 9.0 1.9 7.3 3.3 7.4 3.0 8.2 3.6 6.1 2.8 6.4 1.8 7.0 6.0 6.6 3.6 3.3 4.3 5.0 4.3 1.5 5.4 2.4 4.5 1.5 0.5 1.8 2.2 10.5 0.4 4.3 0.7 3.9 0.6 1.8 2.0 3.0 1.0 2.2 - 1.4 2.6
2053 J. Acoust. Soc. Am., Vol. 73. No. 6, June 1983 J. S. Bradley: New auditorium acoustic measurements 2053
O C T A V E B A N D C E N T E R F R E Q U E N C Y . H z
FIG. 1 . R values versus octave band center frequency for nine positions in hall 8.
er position. One can see two types of effect: overall general seat-to-seat variations, where low- and high-frequency R values behave similarly, and changes in spectral balance where low- and high-frequency R values behave quite differ- ently. One can interpret the overall variations as deleterious in that one would prefer some constant optimum R value throughout the hall. Hall 10, in particular, illustrates such undesirable overall general seat-to-seat variations. One can also interpret changes in spectral balance as unwanted, again
0 2 . 9 a1.0
u
SCALL m FIG. 2. R values at 2000 Hz in hall 8.
2054 J. Acoust. Soc. Am., Vol. 73, No. 6, June 1983
1 2 3 4 6
R E C E I V E R P O S I T I O N
FIG. 3. Low (250 and 500 Hz) and high (2000 and 4000 Hz) R values ve1 position, (a) hall 8, (b) hall 10, and (c) hall 1 1 .
'SUS
imum va: rmed opt
1
because one would prefer some presl
throughout the hall. Position 6 in hall 1 I, aIlu pusitions 7 a__- 8 in hall 8 are examples where the spectral balance seems to change when compared with other seats in the hall. At these three positions the high-frequency R values are higher than the low-frequency values. This was thought to be due to re- duced, early high-frequency energy that caused the R values to increase. Although it may be premature to rate auditoria accurately by these criteria, the amount of overall variability and the variability in the spectral balance of R values may be related to the overall acoustical quality of the hall. Minimiz- ing these variations in existing halls could presumably lead to improved subjective ratings if an appropriate mean value could be approached.
Comparisons of present within-hall variations can be made with Thiele's and Schultz' results. Schultz7 reported within-hall ranges in R values of 2 and 3 dB at 1000 and 2000 Hz, respectively. These measurements were limited, how- ever, to the centerline of one hall. Thiele5 reported within- hall ranges of Deutlichkeit that correspond to R values of 2.9 to 5.3 dB in several auditoria and 7.7 dB in a large church. Thiele made broadband measurements with a spark source. In a second paper1' he reported detailed measurements of Deutlichkeit at large numbers of positions in five different halls. The ranges of measured Deutlichkeit values corre- spond to ranges in R values between 5.5 and 6.8 dB. From Table I1 it may be seen that at 1000 Hz within-hall ranges varied from 1.5 to 8.2 dB and at 2000 Hz from 0.9 to 6.1 dB. The greater within-hall variations in the present work prob- ably result from the fact that Thiele selected a smaller range of more nearly similar, well liked halls. Certainly, much lue
nd
lalger wl~~~lrl-hall variations than those reported by Schultz
do occur.
- It is als e to investigate the effect of varied
source positi~ orm of within-hall variation. In the
present study this was only done for hall 10 in which the effect of varied source positions was investigated at one cen- tral receiver position and for five different source positions
distributed over half the stage area. At 1000 Hz R values
varied by a maximum of 1.8 dB at the one receiver position. Thiele5 reported the effect of varied source positions in two halls. Over many receiver positions at which measurements were made the maximum change in Deutlichkeit corre-
sponded to a change in R of 3.5 dB. Averaged over 12-18
receiver positions, the hall mean Deutlichkeit varied by amounts equivalent to R value changes of 0.2 and 0.8 dB in the two halls. Although there are quite limited data to con- sider, both Thiele's data and the present results suggest that the influence of source position is quite small, particularly when averaged over a number of receiver positions.
2. Between-hall variations
From Table 11 one can see how the mean R values var-
ied between halls: at 1000 Hz, from - 1.1 to 4.3 dB, a range
of 5.4 dB. At 2000 Hz the range of between-hall mean R values was 6.3 dB. At the same frequencies Schultz7 reported variations of up to 6.8 dB among four unoccupied halls. Thiele6 reported differences in hall average Deutlichkeit val- ues that correspond to a range of R values of 8.7 dB. Thus all three studies suggest relatively similar variations among halls. It should be pointed out that the maximum within-hall variations discussed in the previous section were approxi- mately the same as the between-hall variations in average R values.
Thiele6 attempted, unsuccessfully, to relate Deutlich- keit to room volume. In the present work, in attempting to relate R values to a number of geometrical and acoustical quantities, some success was achieved in relating R values to the logarithm of the reverberation time. Figure 4 plots mean R values at 2000 Hz versus the logarithm of RT values for
0 . 5 1. G 2.0
R E V E R B E R A T I O N T I M E , s
FIG. 4. Mean hall R values at 2000 Hz versus log(RT), 0 0 0, measured,
, Eq. ( 5 ) , -
- - - -
- , ideal exponential theory.the 1 1 halls. Also shown ~y tne aasnea line is tne theoretical result for an ideal continuous exponential decay. It is readily approximated by a straight line in the range 0.5-2.5 s RT with an error of less than 0.2 dB. The equation of this
straight line approxima Fig. 4, is
R = 12.8 log(RT)
-
(5) tion, also-
0.1. .-I--.- .,- - shown in --.
.IThe measured mean R values snown in me figure are rough-
ly parallel to the above straight line, but about 2 dB above it. Thus for real rooms where the early sound is not continuous the early energies were lower and the resulting ratios, on average, were about 2 dB larger than the ideal case. There
were clearly exceptions; for example, for one hall the mean R
value was lower than the ideal case, indicating stronger ear- ly-sound components. One should realize that although the
mean R values were approximately related to the logarithm
of RT, this would not necessarily be true for the complete data, which included large within-hall variations.
3. Comparison with other ratios
Although 50 ms was taken as the division between ear- ly- and late-arriving sound, other division points have been proposed. Noteworthy among these was Reichardt's early-
to-late energy ratio C,,
[Eq.
(4)], which incorporates an 80-ms early-sound limit. It is clearly desirable to be able to con- vert, at least approximately, from one set of ratios to another. Equation (3) permits direct conversion from Deut- lichkeit to R values. Approximate conversions to other ra- tios were obtained from the measured data.
Unfortunately, 80-ms early-to-late energy ratios were not calculated in the original processing of the present data. Late-to-early ratios were calculated for 3 5 , 58-, 7 5 , and 100-ms early-sound energy time limits. Regression analyses were performed by plotting each of these other ratios versus
the 50-ms R values. Figure 5 illustrates the results for the 75-
ms late-to-early ratios. The slope of the regression line is
extremely close to 1.0 and the intercept is - 2.9 dB. The
other regression analyses similarly resulted in regression lines with slopes very close to 1.0. It was therefore possible to
- 7 - 4 - 1 2 5 8
5 0 m s R E V E R B E R A N T - T O - E A R L Y R A T I O , d B
FIG. 5.75-ms reverberant-to-early ratios versus 50-ms reverberant-to-early ratios for measured values at 1000 Hz and regression line.
3
3 R L Y SOUN
U
D LIMIT, rn! 0
ther
-
,
".
WII-IIVII LU vz added to 5L-...a MIIJ-LU-IaLG IaLIUJ to obtain 01~nction of early time limit. ratios as a f~
zonvert, approximately, between the different ratio values by adding or subtracting a constant given by the intercept of the regression lines. Figure 6 plots the value of this constant as a function of the time limit for early sound. It may be seen, for example, that to make an approximate conversion from 50-ms early-to-late ratios to an 80-ms ratio a value of 3.4 dB must be added. To obtain a quantity equivalent to Rei- chardt's CEO from R values one would also have to change the sign because this ratio is an early-to-late energy ratio, not a late-to-early one. As the various ratios considered here were quite strongly correlated, one would expect them to be somewhat equivalent predictors of subjective judgments. This is supported by GottlobY9 who found that the 50-ms early time limit was not very critical.
.L NO.
-..
.
FIG. 7. Comparison of mean and wlthm-ha11 ranges or K values tor naus 8. 9, 10, and 11 with Reichardt's acceptable clarity region.
-a- D ..*I.
The other three halls tend to uavc lalasl n valu~a a only partly within the acceptable region. Hall 9 and, to lesser extent, hall 8 seem to exhibit excessive within-hall va iations of R values. Thus it seems possible to differentia among the four halls on the basis of this criterion. This is n apparent from the expected occupied reverberation timc which were all reasonable compromises for multipurpo halls of these volumes. One would normally consider suc reverberation times to be a little short for music, usual relating to insufficient late-arriving energy. It is clear fro Fig. 7 that this is not at all the case. For three of the four halls the R values seem to be too large. One must therefore con- clude that in each of the three halls there is less early sound energy than would be ideal. Where conventional reverbera- tion times suggest comparable acceptable conditions, R val- ues show distinct differences with respect to both the mean R values and the within-hall range of R values.
4. Interpretation of reverberant-to-early ratios
From subjective studies using synthesized sound fields Reichardt determined a range of CEO values that relate to an acceptable degree of clarity. Using the approximate conver- sions shown in the previous section it is possible to arrive at an acceptable range of R values based on Reichardt's work. It is first necessary, however, to modify the measured values to make them representative of occupied conditions. This was achieved by using S c h u l t ~ " ~ regression equations for relating occupied and unoccupied RT values. For 1000 Hz his relation for the change in RT is
A (RT) = 0.6959 RT(unocc) - 0.9354. (6) The estimated occupied 1000-Hz RT values for halls 8 to 11 were calculated to be 1.4, 1.4, 1.5, and 1.5 s from the unoccu- pied RT values of 1.37, 1.64, 1.96, and 1.77 s, respectively. The approximate relation of Eq. (5) was used to adjust mea- sured R values to be representative of expected occupied conditions. These expected R values are shown on Fig. 7 along with Reichardt's acceptable clarity region. For each hall the mean occupied R value of 1000 Hz is shown, as is the range of values within each hall.
Only for hall 11 do the R values fall into a relatively narrow range close to the center of the acceptable region.
TABLE 111. Mean IACC values and within-hall ranges. IACC
Hall Mcan Range
1 0.18 0.12 2
...
..*
3 0.17 0.09 5 4...
..+ 5...
*.. 6...
...
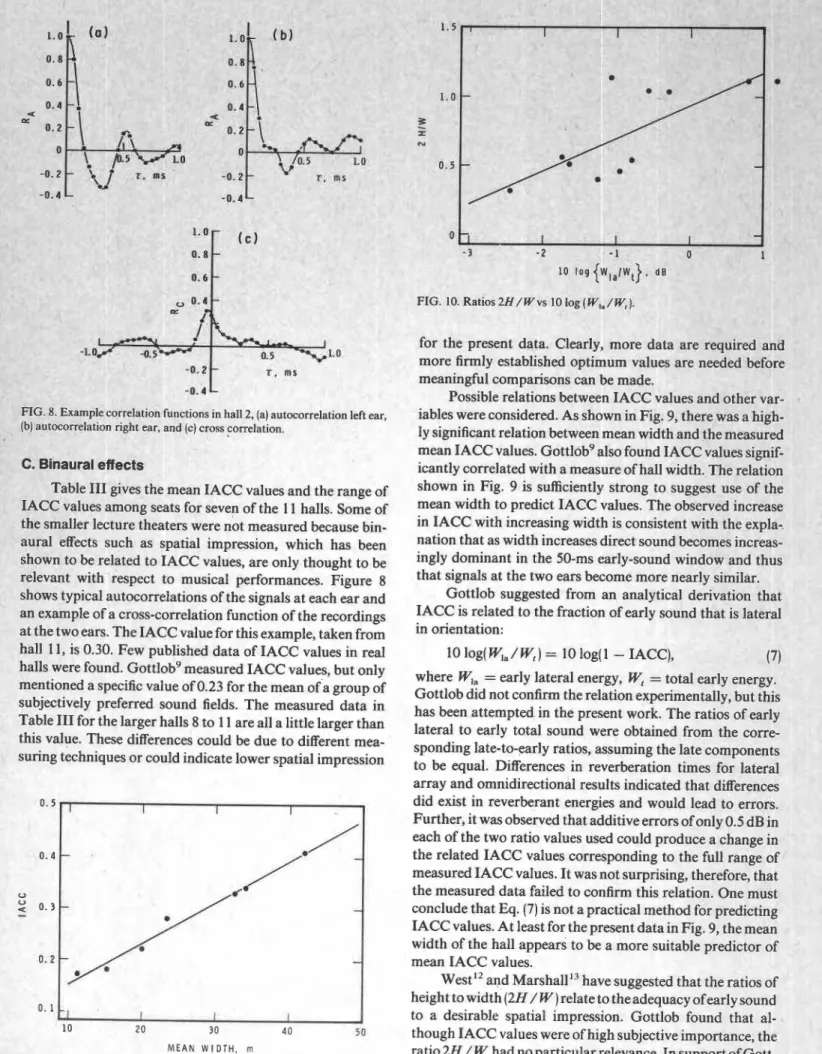
7 0.22 . 0.23 8 0.28 0.22 9 0.34 0.22 10 0.41 0.24 11 0.33 0.23FIG. 10. Ratios :
for the present data. Clearly, more data are required and more firmly established optimum values are needed before meaningful comparisons can be made.
Possible relations between IACC values and c iables were considered. As shown in Fig. 9, there w;
ly significant relation between mean width and the measureu
mean IACC values. Gottlob9 also found IACC values signif- icantly correlated with a measure of hall width. The relation shown in Fig. 9 is sufficiently strong to suggest use of the mean width to predict IACC values. The observed increase in IACC with increasing width is consistent with the expla- nation that as width increases direct sound becomes increas- ingly dominant in the 50-ms early-sound window and thus that signals at the two ears become more nearly similar.
Gottlob suggested from an analytical derivation that IACC is related to the fraction of early sound that is lateral in orientation:
10 log( W,, / W,) = 10 log(1
-
IACC), (7)~ther var-
as a high- >
n functions r, and (c) cn
in hall 2, (a) autocorrelation left ear, ~ s s correlation.
Binaural effects
Table I11 gives the mean rACC values and the range of IACC values among seats for seven of the 11 halls. Some of the smaller lecture theaters were not measured because bin- aural effects such as spatial impression, which has been >wn to be related to IACC values, are only thought to be evant with respect to musical performances. Figure 8 >ws typical autocorrelations of the signals at each ear and
a11 example of a cross-correlation function of the recordings
at the two ears. The IACC value for this example, taken from hall 11, is 0.30. Few published data of IACC values in real halls were found. Gottlob9 measured IACC values, but only intioned a specific value of 0.23 for the mean of a group of jectively preferred sound fields. The measured data in
ble I11 for the larger halls 8 to 1 1 are all a little larger than
this value. These differences could be due to different mea- suring techniques or could indicate lower spatial impression
where W,, = early lateral energy, W, = total early energy.
Gottlob did not confirm the relation experimentally, but this has been attempted in the present work. The ratios of early lateral to early total sound were obtained from the corre- sponding late-to-early ratios, assuming the late components to be equal. Differences in reverberation times for lateral array and omnidirectional results indicated that differences did exist in reverberant energies and would lead to errors. Further, it was observed that additive errors of only 0.5 dB in each of the two ratio values used could produce a change in the related IACC values corresponding to the full range of measured IACC values. It was not surprising, therefore, that the measured data failed to confirm this relation. One must conclude that Eq. (7) is not a practical method for predicting IACC values. At least for the present data in Fig. 9, the mean width of the hall appears to be a more suitable predictor of mean IACC values.
West12 and Marshall13 have suggested that the ratios of height to width (2H / W) relate to the adequacy of early sound to a desirable spatial impression. Gottlob found that al- though IACC values were of high subjective importance, the
ratio 2H / W had no particular relevance. In support of Gott-
lob's results, no relation was found between IACC values
10 20 30 4 0 5 0
MEAN W I D T H , m i. 9. Mean hall IACC values versus mean hall width. FIC
Win the were, however, found to be s: of early lateral to tl Fig. 10. otal early la1 reverb
".
ignificant. sound enatios
W ,
rl Design of ntres (Appli ied ~ r k . The rly related to the ratios lergy, as illustrated in
Ill. CONCLUSION
Omnidirectior :arly sound ratios, R, measured in a wide range or naus nave been observed to vary approximately as much within some halls as the hall aver- ages vary among halls. Such large within-hall variations have been presumed to degrade acoustical quality because optimum R values were clearly not approached at all points. In some cases such variations depended on frequency and would cause variations in the spectral balance from seat to seat. It was demonstrated for four of the larger halls that although reverberation times suggested they were similarly suitable for multipurpose use, the R values indicated differ- ences among halls as well as acoustical flaws not suggested by RT data.
To a first approximation, hall average reverberant-to- early ratios can be expected to relate to the logarithm of the reverberation times. Mean IACC values, which have in the past been shown to correlate with subjective ratings of spa- tial impression, are now shown to relate strongly to the mean width of the hall. Relations between IACC values and ratios of early lateral to early total sound were investigated but not clearly established.
The present work provides expanded insight of a practi- cal nature as well as representative values of new auditorium acoustic measures established by other researchers.
ACKNOWLEDGMENT
This paper is a contribution from the Division of Build- ing Research, National Research Council Canada, and is published with the approval of the Director of the Division.
: der Schall~ ects of Soun of Height 366). c..-*:A- ert .68 V. L. Jordan, Acousticr, Concert Halls and The
Science, London, 1980).
'M. Barron, "The Subjective Effects of First Reflectio~ Halls-The Need for Lateral Reflections," J. Sound Vib (1980).
'P. Lehman and H. Wilkens, "Zusammenhang Subjectiver u=u,rcn*ung
von Konzertsalen mit Raumakustichen Kriterien," Acustic (1980).
4H. Hass, "The Influence of a Single Echo on the Audibility Aud. Eng. Soc. 20(2), 146-159 (1972).
5R. Thiele, "Richtungsverteilung und Zeitfolge Raumen," Acustica 3, 291-302 (1953). 6E. G. Richardson and E. Meyer, TechnicalAsp
sevier, Amsterdam, 1962).
'T. J. Schultz, "Acoustics of the Concert Hall," IEEE Spc (June 1965).
'W. Reichardt and U. Lehman, "Optimierung von Raurr
Durchsichtigkeit von Musikdarbietungen durch Auswertung von 1.
pulsschalltests," Acustica 48, 174-185 (1981).
9D. Gottlob, "Comparison of Objective Acoustic Parameters in Conc, Halls with Results of Subjective Experiments," British Building Resear Establishment, Library Translation 1895 (German thesis, Gottingc 1973).
1°J. P. A. Lochner and W. de V. Keet, "Stereophonic and Quasi-sterf phonic Reproduction," J. Acoust. Soc. Am. 32, 393401 (1960). "W. de V. Keet, ''Influence of Early Lateral Reflections on the S ~ a t
Impression," Sixth ICA, Tokyo, Paper E-2-4 (1968).
IZJ. E. West, "Possible Subjective Significance of the Ratic to Width of Concert Halls," J. Acoust. Soc. Am. 40, 1245 (I!
I3A. H. Marshall, "A Note on the Importance of Room C ~ c \ s - o c ~ u u ~ ~ in Concert Halls," J. Sound Vib. 5, 100-1 12 (1967).
14Y. Ando and K. Kageyama, "Subjective Preference of Sound with a Sin, Early Reflection," Acustica 37, 11 1-1 17 (1977).
I5Y. Ando and M. Imamura, "Subjective Preference Tests for Sound Fie in Concert Halls Simulated by the Aid of a Computer," J. Sound V 65(2), 229-239 (1979).
16B. Barron and A. H. Marshall, "Spatial Impression Due to Early Late Reflections in Concert Halls: The Derivation of a Physical Measure," Sound Vib. 77(2), 21 1-232 (1981).
17E. Meyer and R. Thiele, "Raumakustische Untersuchungen in Zahlrei- chen Konzertsalen und Rundfunkstudios unter Anwendung Neuer Mes- verfahren," Acustica 6,425444 (1956).
lST. J. Schultz, "Reverberation Time Data for Some North American Halls, Unoccupied," TIR 98, Bolt Beranek and Newman, Cambridge, MA (1980). :a 15,256-2 of Speech," ruck Wurfe d, Vol. 111 (I nd r n - ert ch m- ial gle Ids ib. ral ' J.
This publication is being distributed by the Divieion of
Building R e s e a r c h of the National R e s e a r c h Council of Canada. I t should not be reproduced in whole o r in p a r t without p e r m i s s i o n of the original publisher. The Di- vision would be glad to b e of a s s i s t a n c e in obtaining such permission.
Publications of the Divieion may be obtained by m a i l - ing the appropriate remittance (a Bank, Express, o r P o s t Office Money Order, o r a cheque, m a d e payable to the Receiver General of Canada, c r e d i t NRC) to the National R e s e a r c h Council of Canada, Ottawa. KIA OR6. Stamps a r e not acceptable.
A l i s t of allpublications of the Division i s available and may be obtained f r o m the Publications Section, Division of Building Research, National R e s e a r c h Council of Canada, Ottawa. KIA OR6.