HAL Id: hal-02175269
https://hal.archives-ouvertes.fr/hal-02175269
Submitted on 8 Jul 2019
HAL is a multi-disciplinary open access
archive for the deposit and dissemination of
sci-entific research documents, whether they are
pub-lished or not. The documents may come from
teaching and research institutions in France or
L’archive ouverte pluridisciplinaire HAL, est
destinée au dépôt et à la diffusion de documents
scientifiques de niveau recherche, publiés ou non,
émanant des établissements d’enseignement et de
recherche français ou étrangers, des laboratoires
To cite this version:
Mathieu Bonte, Françoise Thellier, Bérangère Lartigue. Impact of occupant’s actions on energy
building performance and thermal sensation. Energy and Buildings, Elsevier, 2014, 76, pp.219-227.
�10.1016/j.enbuild.2014.02.068�. �hal-02175269�
Title: Impact of occupant's actions on energy building performance and thermal sensation Article Type: Full Length Article
Keywords: occupant's behavior; building simulation; human thermal sensation; energy demand; design of experiment
Corresponding Author: Mr. Mathieu Bonte,
Corresponding Author's Institution: Universite Toulouse III - Paul Sabatier - Laboratoire PHASE - Toulouse, France
First Author: Mathieu Bonte
Order of Authors: Mathieu Bonte; Francoise Thellier; Berangere Lartigue
Abstract: In this study, the impact of behavioral actions of a building occupant on energy performance and thermal sensation are investigated. The study focuses on the six following actions: use of blinds, lighting system, windows, fan, thermostat and clothing adjustments. Eight types of buildings, classified among three criteria (air-conditioning, thermal inertia and climate), are studied. Simulation of the occupant's actions, building performance and thermal sensation have been carried out by using TRNSYS 17.
Impact on energy demand and thermal sensation of each action has been investigated with a Design Of Experiments methodology coupled with the use of Yate's algorithm. This study shows that for a given building, the occupant's actions have a significant impact on energy demand. Building simulation in literature typically does not model human activity in energy consumption, yet our study demonstrate a strong correlation.
Results from the design of experiments methodology are compared to conventional French design strategy. It appears that conventional French design strategy, which does not take into account occupants' actions, tends to strongly underestimate building energy demand.
Suggested Reviewers: Radu Zmeureanu radu.zmeureanu@concordia.ca
Laurent ZALEWSKI
laurent.zalewski@univ-artois.fr Da YAN
September 10, 2013
Dear Editor,
Please find enclosed our article entitled “Impact of occupant's actions on energy
building performance and thermal sensation” that we would like to submit to Energy and
Buildings.
No part of the manuscript has been published in any other form and is intended for
publication elsewhere.
I remain at your disposal for any comment.
Best regards,
Mathieu Bonte
5 6 7 8 9 10 11 12 13 14 15 16 17 18 19 20 21 22 23 24 25 26 27 28 29 30 31 32 33 34 35 36 37 38 39 40 41 42 43 44 45 46 47 48 49 50 51 52 53 54 55 56 57
Impact of occupant’s actions on energy building
performance and thermal sensation
Mathieu Bonte, Francoise Thellier∗, Berangere Lartigue
Universite Toulouse III - Paul Sabatier, Laboratoire PHASE, 118 route de Narbonne, 31062 Toulouse, France
Abstract
In this study, the impact of behavioral actions of a building occupant on energy performance and thermal sensation are investigated. The study focuses on the six following actions: use of blinds, lighting system, windows, fan, thermostat and clothing adjustments. Eight types of buildings, classified among three cri-teria (air-conditioning, thermal inertia and climate), are studied. Simulation of the occupant’s actions, building performance and thermal sensation have been carried out by using TRNSYS 17.
Impact on energy demand and thermal sensation of each action has been in-vestigated with a Design Of Experiments methodology coupled with the use of Yate’s algorithm. This study shows that for a given building, the occupant’s actions have a significant impact on energy demand. Building simulation in literature typically does not model human activity in energy consumption, yet our study demonstrate a strong correlation.
Results from the design of experiments methodology are compared to conven-tional French design strategy. It appears that convenconven-tional French design strat-egy, which does not take into account occupants’ actions, tends to strongly underestimate building energy demand.
Keywords: occupant’s behavior, building simulation, human thermal
∗Corresponding author
8 9 10 11 12 13 14 15 16 17 18 19 20 21 22 23 24 25 26 27 28 29 30 31 32 33 34 35 36 37 38 39 40 41 42 43 44 45 46 47 48 49 50 51 52 53 54 55 56 57 58
sensation, energy demand, design of experiments
Nomenclature Latin letters
a Estimated factor effects
EF Error Factor
M E Mean Main Effect
n number of factors
Q Energy demand (kWh/m2.yr)
r number of responses
R Mean of a response from design of experiment RM M E Relative Mean Main Effect
RSD Relative Relative Standard Deviation SGT Positive thermal sensation indicator SLT Negative thermal sensation indicator
ST Thermal sensation
t Time (h)
U Thermal transfer coefficient (W/m2.K)
X Factor of experiments Y Response of experiments Greek symbols µ Mean σ Standard deviation Subscripts cool Cooling heat Heating light Lighting
D Results from DOE
tot Total
8 9 10 11 12 13 14 15 16 17 18 19 20 21 22 23 24 25 26 27 28 29 30 31 32 33 34 35 36 37 38 39 40 41 42 43 44 45 46 47 48 49 50 51 52 53 54 55 56 57 1. Introduction
Field surveys have shown the impact of occupant presence and behavior on building energy consumption.
Human behavior is mainly based on two groups of actions. The first consists of universal reactions that are ingrained in human nature. The second group con-sists of actions that are conditioned by personal background and experiences. Thus, they could be very different depending on the individual.
Actions influencing energy building performance are part of the second group. Indeed, subjected to the same environmental conditions in buildings, occupants will react differently according to their personal characteristics. Those indi-vidual differences could lead to large discrepancies between buildings energy performances depending on how people interact with their environment. Such differences have been shown since the 1970’s thanks to Princeton’s experiments at Twin Rivers on 248 dwellings [1]. Based on these experiments, Sonderegger [2] found that 71% of energy demand variation was due to occupants. Recently, Maier et al. [3] investigated 22 identical houses over 2 years. Their results showed differences between houses equipped with the same ventilation systems. They found a discrepancy in heating consumption of a factor of two between the least and the most energy efficient house of the investigated set. Since the houses were identical, the discrepancy were due to occupants’ behavior. Energy related occupants actions depends on their comfort, and particularly, on their thermal comfort. That is why thermal comfort has to be investigated when occupants behavior is studied.
Since human psychology is a complex process, researchers employed statis-tical analysis of field study data. The experimental methodology (duration, quantity of data etc.) varies from one study to another, but the purpose re-mains the same: finding the drivers of these actions. Many field studies have highlighted which drivers take part in different actions processes such as blind operations [4–6] lighting systems controls [7–10], temperature regulation [11],
8 9 10 11 12 13 14 15 16 17 18 19 20 21 22 23 24 25 26 27 28 29 30 31 32 33 34 35 36 37 38 39 40 41 42 43 44 45 46 47 48 49 50 51 52 53 54 55 56 57 58
window operation [12], use of fans [13], and clothing adjustments [14]. Oc-cupancy has also been investigated [15–17] since the occupant’s presence is a necessary condition for an action to occur.
During the previous decades, researchers have focused on the development of physical models in building simulation. Thus, many physical phenomena such as heat transfers through walls, solar radiation through windows, thermal bridges, and fluid dynamics have been modeled. However, and despite the accuracy of these models, many studies have shown that the actual energy consumption may differ substantially from the modeled energy use [18–20]. Several sources of physical uncertainties are identified such as infiltration rate, thermal properties of walls, internal loads, etc. [21]. However, a more significant source of uncer-tainty is the occupants behavior. Indeed, Clevenger and Haymaker [22] show that the occupant might be responsible for a difference of over 150% among simulation results depending on assumptions about occupant behavior.
Current design tools model occupants in a passive way. In these simulations, occupants do not really act on their environment, they are taken into account according to static schedules. For example, the lights are switched on from 8 am to 7 pm. Hoes et al. [23] state that current numerical tools, intended for energy performance design, are inadequate for buildings where occupants have a close interaction with their environment. Two years later, Mahdavi [15] showed that models of occupants presence and behaviors remain too simplistic.
Therefore, in order to increase the accuracy of building performance tools, re-searchers have recently begun creating models of human behavior in buildings. Different actions have been modeled for specific cases such as blinds use [24], artificial light [25], temperature regulation and clothing adjustments [26–28] or interactions with windows [29].
Physical models for building simulation are nowadays accurate, but discrep-ancies between actual and modeled energy use has been observed over the past decade with the advent of energy efficient buildings [30]. Occupant behavior
8 9 10 11 12 13 14 15 16 17 18 19 20 21 22 23 24 25 26 27 28 29 30 31 32 33 34 35 36 37 38 39 40 41 42 43 44 45 46 47 48 49 50 51 52 53 54 55 56 57
has been recently identified as the main cause of discrepancy but its underlying causes are not yet well known. Indeed, only very recent studies [31] measure the individual impact of various occupants actions on energy use.
The problem of quantifying the impact of variables on systems outputs is widespread and well-known. Originally, this problem has been motivated by applications in agriculture [32]. The principle lies on the variation of input vari-ables and their impact on system’s outputs in order to find the most significant variables.
This practice has lead to the birth of a full-fledged statistical field called Design Of Experiments (DOE) with pioneering studies of Fisher [33] and Yates [34]. This methodology has been adopted in the 1950s by the chemical industry in order to improve industrial processes. More recently, DOE has become popular in computer science and in particular in metamodelling and optimization prob-lems [35]. The reason for such popularity in computer experiments comes from the low-computational time and power requirements of DOE methods which limit the combinatorial explosion. Indeed, some methods evaluate the influence of variables on system’s outputs with a very limited number of experiments.
In this paper we investigate six occupants actions, and we estimate their impact on thermal sensation and energy building performance.
The six following actions have been considered as influencing energy demand and human thermal comfort:
• blind operations, • lighting operations, • windows operations,
• set point temperature regulation, • fans operations,
8 9 10 11 12 13 14 15 16 17 18 19 20 21 22 23 24 25 26 27 28 29 30 31 32 33 34 35 36 37 38 39 40 41 42 43 44 45 46 47 48 49 50 51 52 53 54 55 56 57 58 • clothing adjustments.
In order to quantify the impact of each action cited above, we propose a Design Of Experiments method called ”factorial experiment” based on Yates’ algorithm [34].
2. Building-occupant system modeling
Modeling has been performed with the energy building simulation software TRNSYS 17 [36]. A relevant number of case studies has been investigated with the aim of comparing the occupant’s influence on different types of office buildings.
2.1. Building model
The building under investigation is a room, corresponding to a conventional office. We chose not to simulate an entire building since this paper focuses only on actions of one occupant. The room geometry is given in Figure 1. The ceiling, the floor and the 3 inner walls (north, east and west) are assumed adiabatic. The south facade is the only wall in contact with the exterior. It is composed of a concrete layer and an insulating layer. The insulating layer location depends on the considered case study.
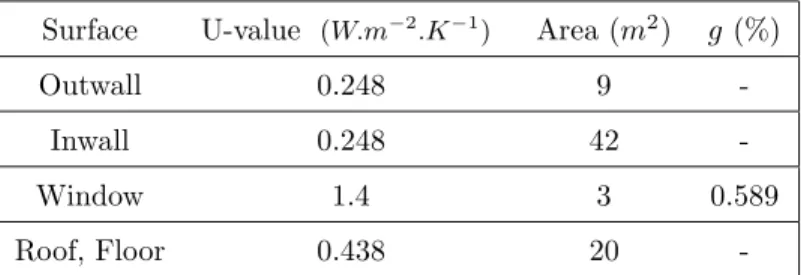
Physical characteristics of the walls and window are given in Table 1. Internal gains from lighting and occupation are added depending on a week-long working schedule. The following assessments are taken:
• blinds: when blinds are closed, 10% of incident solar radiations are trans-mitted to the window and no additional thermal resistance is taken into account.
• lighting system: internal gains due to artificial lighting system are equal to 9 W/m2 of floor area.
Electric energy demand calculation for lighting system is based on a ratio of 11 W/m2 of floor area.
8 9 10 11 12 13 14 15 16 17 18 19 20 21 22 23 24 25 26 27 28 29 30 31 32 33 34 35 36 37 38 39 40 41 42 43 44 45 46 47 48 49 50 51 52 53 54 55 56 57
• infiltration flow rate: a flow rate of 0.3 vol/h is assumed
• heating system: heating starts on November 1st and ends on April 30th.
The set point temperature depends on the considered case study and the heating power is assumed unlimited.
• cooling system: cooling starts on 1stMay and ends on 31stof October. Set
point temperature depends on the considered case study and the cooling power is assumed unlimited.
2.2. Occupant thermal modeling
Heat transfer between the environment and the occupant’s body with all physiological reactions are calculated with a 2-node model representing the human body with an added layer for clothing. The mean skin temperature and heat transfer are calculated by taking into account physical variables (air temperature and velocity, mean radiant temperature, and vapor pressure) and parameters depending on the body (metabolic heat production and clothing in-sulation).
Thermo-physiological unconscious reactions are computed such as vasoconstric-tion, vasodilatavasoconstric-tion, shivering and sweating. The thermal balance of human body is calculated at a time step of one minute, whereas the thermal balance of the building is calculated at a time step of one hour. The time step of the thermophysiological model is independent of the time step of the building sim-ulation, as it is internal to the routine of the thermophysiology model.
Thermal sensations (ST ) are then calculated on the ASHRAE seven-point scale from -3 (very cold) to +3 (very hot) thanks to regression relationships with skin temperature [37].
Usually it is considered that there is no main discomfort for a thermal sensation close to 0 (neutral). Thus thermal comfort could be reached. This is one of the strongest assumptions that is currently made in this field. In all simulations, the occupant is seated at rest. His metabolism is fixed to 1 met, close to 105 W. The clothing insulation varies according to actions and/or season.
8 9 10 11 12 13 14 15 16 17 18 19 20 21 22 23 24 25 26 27 28 29 30 31 32 33 34 35 36 37 38 39 40 41 42 43 44 45 46 47 48 49 50 51 52 53 54 55 56 57 58
2.3. Modeling of occupants behavioral actions
The aim of this study is to understand the impact of human behavioral actions on his/her thermal sensation and energy demand. Each of the 6 actions given in introduction has an impact either on the building or the human thermal balance or both.
Each action has been modeled in TRNSYS 17 with the following assumptions: • window: when open, air velocity on the body is equal to 0.5 m/s and
infiltration flowrate is increased by 5 m3
/h.
• fan: when ”on”, air velocity on the body is equal to 0.6 m/s. The energy demand of the fan is not taken into account in total energy demand. • If the window is open and the fan is ”on” at the same time, air velocity
on the body is equal to 0.8 m/s. 2.4. Case studies
We investigate several case studies through three variant parameters: cli-mate, thermal inertia and air conditioning during summer.
• The location parameter takes two values, oceanic and Mediterranean. In the first case, the building is situated in Agen (France), and in the second case, the building is situated in Nice (France).
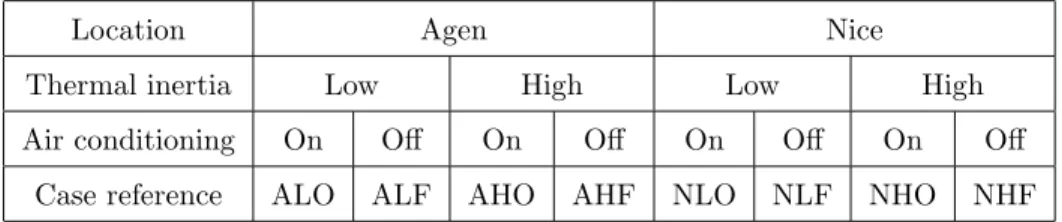
• The thermal inertia parameter takes two values depending on the location of the insulation in the outer wall. If the insulating material is located on the outer side, the thermal inertia is characterized as high and vice versa. • The air conditioning parameter also takes two values, on and off. If on, it means that the building is equipped with air conditioning during summer. Since there are two possible values for each of the three parameters, eight case studies are needed to perform all combinations. They are presented in Table 2.
8 9 10 11 12 13 14 15 16 17 18 19 20 21 22 23 24 25 26 27 28 29 30 31 32 33 34 35 36 37 38 39 40 41 42 43 44 45 46 47 48 49 50 51 52 53 54 55 56 57
3. Design of experiments methodology
Typically, design of experiments (DOE) methods are used for of industrial process optimization. They identify the most influencing factors on the effi-ciency of a process, and find improvement levers. When several variables are involved in an experimental design, the traditional one-factor-at-a-time method (OFAT) becomes a weighty and time-consuming task.
In our case, the purpose is to determine the quantitative influence of occupants’ actions on energy building performance and thermal sensation. Thus, six ex-perimental factors have to be investigated. A classical OFAT method would need a large number of runs, so a 2n full fractional design is preferred because
of its favorable accuracy/time compromise. It consists of assigning two levels (low and high) to n factors and evaluating responses for the 2n combinations.
In this study, n = 6 factors (or actions) are evaluated on two levels, thus 64 simulations have to be achieved for each response. Based on these results, a post-treatment is performed thanks to the Yates algorithm which gives a linear regression relationship between considered responses and factors (Equation 1).
Y = a0+Pni=1ai·Xi+Pni,j=1aij·Xi·Xj+Pni,j,k=1aijk·Xi·Xj·Xk+ ... (1)
Where Y is the response, Xiare the factors, n is the number of factors, and
aij...are the estimated factor effects.
3.1. Factors
Factors of an experiment are the parameters that are supposed to influence the responses. In this paper, the factors are the occupant’s actions. Each action is assigned two levels. These are called ”low level” and ”high level”, respectively -1 and +1.
Table 3 gives the assumptions for the states -1 and +1 for each action (i.e. fac-tor). The conventional methodology in design of experiments is to take extreme values in the range of variability of each actions. All the assumptions given in Table 3 have been taken in that way.
8 9 10 11 12 13 14 15 16 17 18 19 20 21 22 23 24 25 26 27 28 29 30 31 32 33 34 35 36 37 38 39 40 41 42 43 44 45 46 47 48 49 50 51 52 53 54 55 56 57 58
For each action, the low and high levels have been chosen to correspond to lower and upper typical values. For example the low level for clothing corresponds to light clothing insulation for a given season.
3.2. Responses
Responses are the outputs of the experiments or simulations. These are the values on which factors have influence, and that the experimental designer chooses to analyze. The following responses are considered:
• Qheat(kWh/m2.yr): energy demand for heating
• Qtot(kWh/m2
.yr): total energy demand for heating, cooling and lighting. • SLT : negative thermal sensation defined in equation 2:
SLT = −
8760
X
t=1
ST (t)∆t, ∀ ST (t) ∈ R−∗ (2)
• SGT : positive thermal sensation defined in equation 3:
SGT =
8760X
t=1
ST (t)∆t, ∀ ST (t) ∈ R+∗ (3)
Where ST (t) is the thermal sensation of an occupant calculated by the ther-mophysiology model at time t, ∆t is the time step of the simulation, 1 hour in this study.
3.3. Yates algorithm
Yates algorithm is used in order to exploit results of the Design Of Exper-iments methodology and thus quantify the impact of each action taken sepa-rately. It takes as input a matrix called “design matrix” to compute the impact, called main effect, of factors on different responses (energy demand, thermal sen-sation, etc.).
8 9 10 11 12 13 14 15 16 17 18 19 20 21 22 23 24 25 26 27 28 29 30 31 32 33 34 35 36 37 38 39 40 41 42 43 44 45 46 47 48 49 50 51 52 53 54 55 56 57
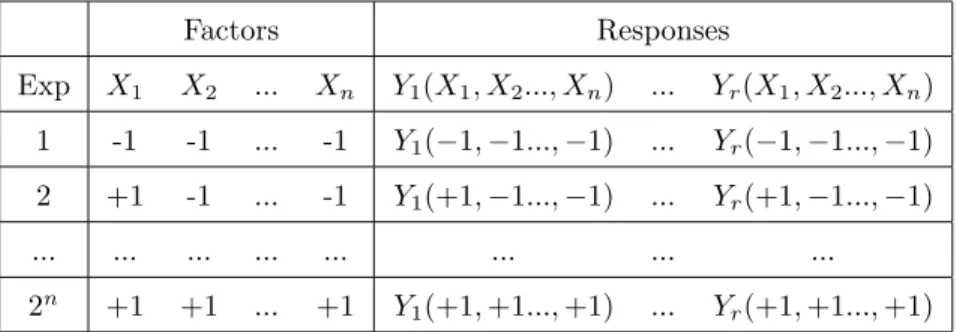
A design matrix is a table collecting all experiments that are performed. Each experiment is characterized by a unique combination of six factors on low level or high level. The design matrix contains n + r columns (where n is the number of factors and r the number of responses), and 2n rows since factors
vary on two levels. The n first columns are filled with combinations of -1 and +1. Yates algorithm needs the combinations to be in the Yates order which is defined by:
• first row is filled with -1
• -1 and +1 values switch on the rows 2n−1 in column n
Experimental results Yk are written in columns n + k (1 ≤ k ≤ r). The
structure of a generic matrix design for a 2n full fractional design is given in
table 4.
Once the design matrix is established, estimated factor effects (a in Equation 1) are evaluated with the Yates algorithm [34]. They give the individual impact of each factor on the various responses.
4. Results and Discussion
For each of the 8 case studies, 64 simulations have been performed with TRNSYS 17 to estimate the main effect of the n = 6 actions on the r = 4 responses. That makes 512 simulations over one year.
After presenting some preliminary results from the building simulation, we in-vestigate discrepancy over energy demand and thermal sensation. The variation range of energy performance regarding the occupant actions, building charac-teristics, and climate typology are studied.
Then, the impact of actions, taken individually, on energy demand and thermal sensation is discussed.
8 9 10 11 12 13 14 15 16 17 18 19 20 21 22 23 24 25 26 27 28 29 30 31 32 33 34 35 36 37 38 39 40 41 42 43 44 45 46 47 48 49 50 51 52 53 54 55 56 57 58 4.1. Preliminary results
The energy performance results from these simulations are shown in Figure 2. Results have been averaged over the 64 simulations for each case study. They categorized into 3 energy demands as follows:
• Qheat, is the heating energy demand (one of the responses)
• Qlightis the energy demand for lighting,
• Qcool is the cooling energy demand.(Qcool = 0 when air conditioning is
off)
The sum of these 3 results represent Qtot, the total energy demand, which is
one of the responses investigated in the DOE. The estimated demand appears high, but this apparent overrating comes from the consideration of occupant’s actions as will be seen in the next part.
It is worth noting on Figure 2 that the ocean climate is the coldest as Qheat is higher. In all cases, Qcoolis quite low and Qlight represents between 10 and
15% of the total energy demand.
The evolution of indoor temperature and heating power demand over the time is plotted on Figure 3. The building is in Agen and has low inertia. The time correspond to the last week of January. The plot shows results from energy simulation for two cases from the DOE:
• a minimal scenario where the combination of the different factors mini-mizes the energy demands (B = −1, E = −1, T = −1, F = +1, ALF). Qtot= 14 kWh/m2.yr
• a maximal scenario where the combination of the different factors mini-mizes the energy demands (B = +1, E = +1, T = +1, F = −1, ALO). Qtot= 120 kWh/m2.yr
They are the two extreme scenarii regarding the total energy demand (Qtot).
8 9 10 11 12 13 14 15 16 17 18 19 20 21 22 23 24 25 26 27 28 29 30 31 32 33 34 35 36 37 38 39 40 41 42 43 44 45 46 47 48 49 50 51 52 53 54 55 56 57
which differ only in the occupant’s actions. This wide discrepancy shows mag-nitude of the impact of occupant on the building energy performance, even though the results have to be nuanced because of the low probability of such combinations of actions.
4.2. Energy demand and thermal sensation discrepancy
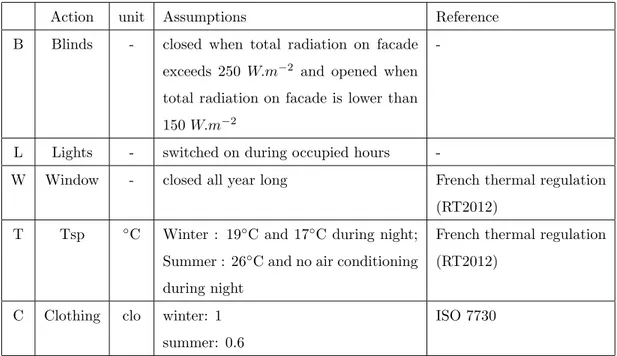
Eight other simulations have been performed taking conventional design strategies used in France. The assumptions are presented in Table 5. Assump-tions on blinds operaAssump-tions are based on [38, 39].
The aim is to compare classical design results to those from the DOE method-ology which takes into account various occupant actions.
Figure 4 shows for the 8 cases the mean value and standard deviation of Qtot
from the 64 simulations and show a significant discrepancy among 8 sets of sim-ulations. These are due to the varying actions and show that different behaviors could lead to very different energy performances. It has to be noticed that the results for conventional design are always lower than the mean value of the 64 simulations. Discrepancies remain approximately constant regardless of the cli-mate or the inertia of the building in terms of absolute value.
The Relative Standard Deviation (RSD) is calculated using Equation 4:
RSD = σQD/µQD (4)
Where σQD is the standard deviation of the results from DOE simulations for
Qtot and µQD is the mean.
On Figure 5, RSD has been plotted for each case. The figure shows that: • Occupant’s actions have a more significant impact on buildings under
warmer climate
8 9 10 11 12 13 14 15 16 17 18 19 20 21 22 23 24 25 26 27 28 29 30 31 32 33 34 35 36 37 38 39 40 41 42 43 44 45 46 47 48 49 50 51 52 53 54 55 56 57 58
The Error Factor (EF) is calculated using Equation 5:
EF = µQD/QC (5)
Where µQD is the mean of the results from DOE simulations for Qtot, and
QC is the results from conventional design simulation for Qtot.
Results on Figure 6 show that the EF between a conventional design process and a design process taking into account the occupant actions is between 1.5 and 2. These differences are consistent with the feedback from the field, which often brings out a two-to-one discrepancy between predicted and measured building energy performance [18].
In addition, Figure 5 and 6 show that the relative impact of thr occupant varies from the building type and climate. Indeed, the impact is more important for a building with higher thermal inertia and located in a warmer climate. The same building might have very different energy demands (±54% in average on Figure 5) depending on the behavioral profile of its occupants.
Current building design processes do not take into account this behavior suffi-ciently. At the same time, buildings have become more efficient and the impact of the occupant behavior in the energy balance has increased. That is why in-creasingly wide discrepancies have been observed in the past decade.
Regarding the thermal sensation, Figure 7 shows that there is a significant gap between SLT from DOE design strategy and the conventional design strat-egy. This difference might be very prejudicial to future building energy perfor-mance. Indeed, if occupants are in a situation of discomfort, they will react by interacting with their environment and, might degrade energy performance. That is why thermal comfort has to be considered in design strategies in order to reduce future discrepancies between field measurements and simulation results in terms of energy performance.
8 9 10 11 12 13 14 15 16 17 18 19 20 21 22 23 24 25 26 27 28 29 30 31 32 33 34 35 36 37 38 39 40 41 42 43 44 45 46 47 48 49 50 51 52 53 54 55 56 57
4.3. Impact of actions on building energy demand
The impact of global occupant behavior has been discussed above. It is the result of combinations of different single actions (i.e. blind operations, light op-erations, etc.). Therefore, it is essential to quantify individually the effect of each action on the energy building performance. It would allow to bring out which actions building designers should pay attention to predict more precisely future energy performance. The impact of each actions has been calculated thanks to the Yates algorithm and the 64 × 8 simulations results on 4 responses.
The Yates algorithm estimates the main effect of each input factor on the re-sponses. The main effect is the mean impact of a factor on a considered response when it goes from state -1 to +1. For example, if the main effect of a response’s factor is 100, it means that this response increase by 100 on average when this factor is activated (state +1).
For convenience in analyzing the results, we introduce in Equation 6 the Rel-ative Mean Main Effect (RMME). This indicator is intended to quantify the average percentage of variation that a factor would be induce on a particular response.
RM M E = M E
R (6)
Where M E is the mean of the main effects of a factor for the 8 case studies, and R is the mean of a response for the same 8 case studies.
Figure 8 shows the absolute value of the RMME of the 6 actions on the response Qtot, and Figure 9 shows the absolute value of the RMME of the same
6 actions on the response Qheat. A positive main effect means that the action
leads to increased energy demand. On the contrary, a negative value means that the action is beneficial for the building’s energy performance.
8 9 10 11 12 13 14 15 16 17 18 19 20 21 22 23 24 25 26 27 28 29 30 31 32 33 34 35 36 37 38 39 40 41 42 43 44 45 46 47 48 49 50 51 52 53 54 55 56 57 58
influential factor. A difference of 4◦C in the temperature set point during
oc-cupied hours is responsible for an increase of 35 to 55% in the total energy demand (Figure 8). In the same way, the action T leads to an increase of 50 to 70% in heating energy demand (Figure 9). That is why it is essential either to design efficient regulation systems, or to forecast accurately the occupant “comfort temperature”, whether or not he has control on the heating systems. Blinds (B) play also a major role in building performance. It turns out that blind operation might increase total energy demand by about 20% and heating energy demand by about 35%. Here again, actions on blinds have to be care-fully considered during the design process. Conventional modeling considers that blinds are fully open during winter (Table 5). However, field studies show a completely different reality. Indeed, Foster [40] shows that blinds could be closed up to 60% in average in winter. Significant errors might be made on solar gains and thus on building performance of modern buildings for which the energy balance is profoundly affected by solar gains.
Regarding operations on the lighting system (L), Figure 8 shows that light influ-ences significantly the total energy demand. Current models of lighting system are based on occupied schedules, which is a wrong assumption if the controls are operable by the occupants. Occupants do not systematically switch on lights when they arrive to their office or switch off when they leave it [8, 10]. Figure 9 shows that lights have a negative effect on the heating energy demand, which is due to the heat produced by the lighting systems. Eventually, wrong as-sumptions regarding lights operations could lead to an underevaluation of total energy demand, and thus bring an uncertainty of several percents to building energy performance.
Results also show that the operation of windows decreases the total energy demand, albeit to a lesser extent than the actions above. It decreases indoor temperature and thus the air conditioning demand.
Figure 8 shows that the other investigated actions (fan and clothing) do not affect building’s energy performance directly. They are related to the thermal sensation of occupants.
8 9 10 11 12 13 14 15 16 17 18 19 20 21 22 23 24 25 26 27 28 29 30 31 32 33 34 35 36 37 38 39 40 41 42 43 44 45 46 47 48 49 50 51 52 53 54 55 56 57
4.4. Impact of actions on thermal sensation
The Design Of Experiments method used in the present paper does not take into account interactions between thermal or visual comfort and actions. Ac-tions such as fan operaAc-tions or clothing adjustments have a null RMME on building performance (Figures 8 and 9).
However, actions of occupants are often the manifestation of a certain discom-fort. For example, an occupant with a negative thermal sensation will tend to increase the temperature set point and thus increase the heating energy demand. Occupants thermal comfort is an important factor in building performance be-cause of its close connection to occupants behavior.
Figure 10 and 11 show the RMME of the 6 actions on SLT (Eq. 2) and SGT (Eq. 3). Results evaluate the impact of actions on thermal sensation. Not surprisingly, the most influential factor on thermal comfort is the temperature setpoint (T). A difference of 4◦C in temperature set point causes a reduction of
cold discomfort of about 35 to 50%, assuming comfort is reached for a neutral thermal sensation.
Figures 10 and 11 show that clothing (C) is a major factor in thermal sensation. Indeed, it is responsible for wide variations on SLT and SGT. Since thermal discomfort might be a source of degradation of energy performance, thermal clothing insulation must not be treated as a trivial consideration. The famous “Cool Biz” campaign [41] of the Japanese ministry of the environment, where office employees were asked not to wear ties and jackets, permitted the saving of hundred thousands of tons in CO2 emission, thus demonstrating the crucial
role of the clothing.
The third most important action on thermal sensation is the operation on blinds. Blinds prevent solar radiation from passing through windows and thus increas-ing the gain. It has to be underlined here that even if the sun enters the room, the occupant is not in the sunspot. Otherwise, the effect on warm sensation would be largely increase.
Figure 10 shows that the closing of external shading devices causes an important rise of cold discomfort. This can be explained by a negative thermal balance
8 9 10 11 12 13 14 15 16 17 18 19 20 21 22 23 24 25 26 27 28 29 30 31 32 33 34 35 36 37 38 39 40 41 42 43 44 45 46 47 48 49 50 51 52 53 54 55 56 57 58
during mid-season periods when the heating system is turned off. On the other hand, Figure 11 shows that blinds are able to decrease significantly (between -15 to -28%) the occupant discomfort during summer season.
5. Conclusion
Currently, building simulation models consider occupants in simplistic ways. Yet, many studies tend to show this leads to large discrepancies between sim-ulated and measured energy demands. Indeed, very few studies quantify the impact occupants have on building energy performance.
In this paper, we propose a new method to quantify this impact and the re-lated discrepancies caused by occupants actions. To do this, we use the Design Of Experiments methodology, based on the modeling of various combinations of extreme behaviors (-1 and +1 levels) in a building simulation model. We study 6 actions an occupant could do: operations on blinds, lights, windows, setpoint temperatures, fans, and personal clothing insulation. We have chosen as responses to these 6 actions the energy use and the thermal comfort. The building studied is an office room. Eight cases are investigated according to 3 parameters which are climate, inertia and air conditioning system. Our ob-jective is to quantify and range the impact of each action on the responses. In addition, results are compared to the ones of a conventional reference case which does not take into account the occupant’s actions.
Our study permits to bring out the following conclusions:
• for a given case study energy use can be very different according to the occupant actions. The impact of the actions leads to a variation of the RSD higher than 45% (Figure 5).
• conventional design methodology undervalues the energy demand (two-to-one factor) because they do not consider occupants behavior (Figure 6).
8 9 10 11 12 13 14 15 16 17 18 19 20 21 22 23 24 25 26 27 28 29 30 31 32 33 34 35 36 37 38 39 40 41 42 43 44 45 46 47 48 49 50 51 52 53 54 55 56 57
• it also overvalues occupants’ thermal comfort (Figure 7).
• The most influential actions on total energy demand are the operations on setpoint temperature, blinds, and lights (Figure 8).
• The most influential actions on thermal comfort are the operations on setpoint temperature, clothing insulation, and blinds (Figure 10 and 11). Building simulation cannot be performed anymore without considering occu-pant’s behavior. It have to be taken into consideration during the building design phase in order to reduce the gap between simulation and actual energy performance [30]. This can be achieved with different methods using artificial intelligence [28]. Without these considerations, there is a significant risk of discrepancies between calculated and actual energy use.
8 9 10 11 12 13 14 15 16 17 18 19 20 21 22 23 24 25 26 27 28 29 30 31 32 33 34 35 36 37 38 39 40 41 42 43 44 45 46 47 48 49 50 51 52 53 54 55 56 57 58 References
[1] R. Socolow, Saving energy in the home: Princeton’s experiments at Twin Rivers, Ballinger Pub. Co., 1978.
[2] R. C. Sonderegger, Movers and stayers: the resident’s contribution to vari-ation across houses in energy consumption for space heating, Energy and Buildings 1 (3) (1978) 313–324.
[3] T. Maier, M. Krzaczek, J. Tejchman, Comparison of physical performances of the ventilation systems in low-energy residential houses, Energy and Buildings 41 (3) (2009) 337–353.
[4] A. I. Rubin, B. L. Collins, R. L. Tibbott, Window blinds as a potential energy saver: A case study, US Department of Commerce, National Bureau of Standards, 1978.
[5] M. S. Rea, Window blind occlusion: a pilot study, Building and Environ-ment 19 (2) (1984) 133–137.
[6] T. Inoue, T. Kawase, T. Ibamoto, S. Takakusa, Y. Matsuo, The develop-ment of an optimal control system for window shading devices based on investigations in office buildings, ASHRAE transactions 94 (1988) 1034– 1049.
[7] D. R. G. Hunt, The use of artificial lighting in relation to daylight levels and occupancy, Building and Environment 14 (1) (1979) 21–33.
[8] J. A. Love, Manual switching patterns in private offices, Lighting Research and Technology 30 (1) (1998) 45–50.
[9] S. Pigg, M. Eilers, J. Reed, Behavioral aspects of lighting and occupancy sensors in private offices: a case study of a university office building, ACEEE 1996 Summer Study on Energy Efficiency in Buildings.
[10] D. Lindel¨of, N. Morel, A field investigation of the intermediate light switch-ing by users, Energy and Buildswitch-ings 38 (7) (2006) 790–801.
8 9 10 11 12 13 14 15 16 17 18 19 20 21 22 23 24 25 26 27 28 29 30 31 32 33 34 35 36 37 38 39 40 41 42 43 44 45 46 47 48 49 50 51 52 53 54 55 56 57
[11] J. F. Nicol, M. A. Humphreys, Adaptive thermal comfort and sustainable thermal standards for buildings, Energy and Buildings 34 (6) (2002) 563– 572.
[12] S. Herkel, U. Knapp, J. Pfafferott, A preliminary model of user behaviour regarding the manual control of windows in office buildings, in: Proceedings of the 9th International IBPSA Conference BS2005, Montreal, Canada, 2005.
[13] J. Nicol, Characterising occupant behaviour in buildings: towards a stochastic model of occupant use of windows, lights, blinds, heaters and fans, in: Proceedings of the seventh international IBPSA conference, Rio, Vol. 2, 2001.
[14] R. De Dear, A global database of thermal comfort field experiments, ASHRAE Transactions 104 (1998) 1141–1152.
[15] A. Mahdavi, People in building performance simulation, Building perfor-mance simulation for design and operation (2011) 56–83.
[16] C. Whang, D. Yan, Y. Jiang, A novel approach for building occupancy simulation, Building simulation 4 (2) (2011) 149–167.
[17] J. Virote, R. Neves-Silva, Stochastic models for building energy prediction based on occupant behavior assessment, Energy and Buildings 53 (0) (2012) 183 – 193.
[18] L. Norford, R. Socolow, E. Hsieh, G. Spadaro, Two-to-one discrepancy between measured and predicted performance of a low-energy office build-ing: insights from a reconciliation based on the doe-2 model, Energy and Buildings 21 (2) (1994) 121 – 131.
[19] P. A. Torcellini, M. Deru, B. Griffith, N. Long, S. Pless, R. Judkoff, D. Crawley, Lessons learned from field evaluation of six high-performance buildings, National Renewable Energy Laboratory, 2006.
8 9 10 11 12 13 14 15 16 17 18 19 20 21 22 23 24 25 26 27 28 29 30 31 32 33 34 35 36 37 38 39 40 41 42 43 44 45 46 47 48 49 50 51 52 53 54 55 56 57 58
[20] G. R. Newsham, S. Mancini, B. J. Birt, Do leed-certified buildings save energy? yes, but?, Energy and Buildings 41 (8) (2009) 897–905.
[21] C. J. Hopfe, J. L. Hensen, Uncertainty analysis in building performance simulation for design support, Energy and Buildings 43 (10) (2011) 2798 – 2805.
[22] C. M. Clevenger, J. Haymaker, The impact of the building occupant on energy modeling simulations, in: Proceedings of the Joint International Conference on Computing and Decision Making in Civil and Building En-gineering, Montreal, Canada, 2006.
[23] P. Hoes, J. Hensen, M. Loomans, B. De Vries, D. Bourgeois, User behavior in whole building simulation, Energy and Buildings 41 (3) (2009) 295–302. [24] F. Haldi, D. Robinson, Adaptive actions on shading devices in response to local visual stimuli, Journal of Building Performance Simulation 3 (2) (2010) 135–153.
[25] C. Reinhart, Lightswitch-2002: a model for manual and automated control of electric lighting and blinds, Solar Energy 77 (1) (2004) 15–28.
[26] K. J. McCartney, J. F. Nicol, Developing an adaptive control algorithm for europe, Energy and Buildings 34 (6) (2002) 623–635.
[27] M. Endravadan, F. Thellier, J. P. Bedrune, Modelling of occupant-controlled global heating in buildings, in: Proceeding Windsor Conference, Post Occupancy Evaluation: Closing the Loop, 2004.
[28] M. Bonte, F. Thellier, B. Lartigue, An occupant behavior model based on artificial intelligence for energy building simulation, in: Proceedings of the 13th International IBPSA Conference BS2013, Chambery, France, 2013. [29] F. Haldi, D. Robinson, Interactions with window openings by office
8 9 10 11 12 13 14 15 16 17 18 19 20 21 22 23 24 25 26 27 28 29 30 31 32 33 34 35 36 37 38 39 40 41 42 43 44 45 46 47 48 49 50 51 52 53 54 55 56 57
[30] The International Energy Agency (IEA), Annex 53 - Total energy use in buildings: Analysis & evaluation methods (2010).
URL www.ecbcsa53.org
[31] T. Hong, H.-W. Lin, Occupant behavior: Impact on energy use of private offices, in: Proceedings of ASim 2012, 2013.
[32] Statistical Methods for Testing and Evaluating Defense Systems: Interim Report, The National Academies Press, 1995.
[33] R. A. Fisher, The design of experiments, Edinburgh and London: Oliver and Boyd, 1935.
[34] F. Yates, The Design and Analysis of Factorial Experiments, Imperial Bu-reau of Soil Science, 1952.
[35] V. C. Chen, K.-L. Tsui, R. R. Barton, J. K. Allen, A review of design and modeling in computer experiments, Handbook of statistics 22 (2003) 231–261.
[36] The solar energy laboratory, uw-madison (2011). URL http://sel.me.wisc.edu/trnsys/index.html
[37] M. Galeou, La sensation thermique de l’homme dans son habitat : des grandeurs physiques et physiologiques aux sensations, Ph.D. thesis, Uni-versite Paul Sabatier Toulouse III, France (1991).
[38] D. Saelens, W. Parys, R. Baetens, Energy and comfort performance of thermally activated building systems including occupant behavior, Building and Environment 46 (4) (2011) 835–848.
[39] W. Parys, D. Saelens, H. Hens, Implementing realistic occupant behavior in building energy simulations–the effect on the results of an optimization of office buildings, in: Proceedings of the 10th REHVA World Congress “Sustainable Energy use in Buildings”, 2010.
8 9 10 11 12 13 14 15 16 17 18 19 20 21 22 23 24 25 26 27 28 29 30 31 32 33 34 35 36 37 38 39 40 41 42 43 44 45 46 47 48 49 50 51 52 53 54 55 56 57 58
[40] M. Foster, T. Oreszczyn, Occupant control of passive systems: the use of venetian blinds, Building and Environment 36 (2) (2001) 149–155.
[41] H. Masaki, Japans new energy strategy, Energy Perspectives on Singapore and the Region (2007) 228–248.
List of figure captions
Figure 1
Room geometry
Figure 2
Mean energy demand distribution vs case study reference
Figure 3
Temperature and power demand over a week for the minimal (ALF) and
the maximal (ALO) scenario
Figure 4
Total energy demand vs case study reference
Figure 5
Relative Standard Deviation (RSD) of total energy demand vs case
study reference
Figure 6
Error ratio between mean of DOE results and results from standard occu-pant
model
Figure 7
SLT vs case study reference
Figure 8
Total energy demand vs action
Figure 9
Heating energy demand vs action
Figure 10
Negative thermal sensation indicator SLT vs action
Figure 11
Positive thermal sensation indicator SGT vs action
Table 1: Main characteristics of walls and window
Surface U-value (W.m−2.K−1) Area (m2)
g (%)
Outwall 0.248 9
-Inwall 0.248 42
-Window 1.4 3 0.589
-Table 2: Case studies depending on parameters combination
Location Agen Nice
Thermal inertia Low High Low High
Air conditioning On Off On Off On Off On Off Case reference ALO ALF AHO AHF NLO NLF NHO NHF
Table 3: Factors of the fractional design
Action Unit Low level (-1) High level (+1) B Blinds - opened for the whole year closed the whole year L Lights - switched off for the whole
year
switched on during occupation schedulea
W Window - Closed for the whole year Open when the outdoor tem-perature is less than the in-door temperature during sum-mer and the outdoor tempera-ture is greater than 23◦C.
T Tsp ◦C Winter : 18◦C during the
occupation schedule, 17◦C
otherwise. Summer and if air-conditioning is on : 28◦C
Winter : 24◦C during the
oc-cupation schedule 17◦C
oth-erwise. Summer and if air-conditioning is on : 24◦C.
F Fan m/s switched off for the whole year
switched on when indoor tem-perature exceeds 26◦C
C Clothing clo winter 0.9 winter 1.1 summer 0.5 summer 0.7
a
Table 4: Design matrix structure for a 2n
full fractional design and responses
Factors Responses Exp X1 X2 ... Xn Y1(X1, X2..., Xn) ... Yr(X1, X2..., Xn) 1 -1 -1 ... -1 Y1(−1, −1..., −1) ... Yr(−1, −1..., −1) 2 +1 -1 ... -1 Y1(+1, −1..., −1) ... Yr(+1, −1..., −1) ... ... ... ... ... ... ... ... 2n +1 +1 ... +1 Y1(+1, +1..., +1) ... Yr(+1, +1..., +1)
Table 5: Assumptions of conventional French design strategy
Action unit Assumptions Reference
B Blinds - closed when total radiation on facade exceeds 250 W.m−2 and opened when
total radiation on facade is lower than 150 W.m−2
-L Lights - switched on during occupied hours
-W Window - closed all year long French thermal regulation (RT2012)
T Tsp ◦C Winter : 19◦C and 17◦C during night;
Summer : 26◦C and no air conditioning
during night
French thermal regulation (RT2012)
C Clothing clo winter: 1 ISO 7730