HAL Id: hal-02495246
https://hal.univ-lorraine.fr/hal-02495246
Submitted on 28 May 2020HAL is a multi-disciplinary open access
archive for the deposit and dissemination of sci-entific research documents, whether they are pub-lished or not. The documents may come from teaching and research institutions in France or abroad, or from public or private research centers.
L’archive ouverte pluridisciplinaire HAL, est destinée au dépôt et à la diffusion de documents scientifiques de niveau recherche, publiés ou non, émanant des établissements d’enseignement et de recherche français ou étrangers, des laboratoires publics ou privés.
Analysis of crystal field effects and interactions using
X-ray restrained ELMOs
Michelle Ernst, Alessandro Genoni, Piero Macchi
To cite this version:
Michelle Ernst, Alessandro Genoni, Piero Macchi. Analysis of crystal field effects and interac-tions using X-ray restrained ELMOs. Journal of Molecular Structure, Elsevier, 2020, pp.127975. �10.1016/j.molstruc.2020.127975�. �hal-02495246�
This document is the Accepted Manuscript version of a Published Work that appeared
in final form in the Journal of Molecular Structure (J. Mol. Struct. 1209 (2020)
127975) after peer review and technical editing by the publisher. To access the final
edited and published work see
https://doi.org/10.1016/j.molstruc.2020.127975
.
1
Analysis of crystal field effects and interactions
using X-ray restrained ELMOs
Michelle Ernst*,a, Alessandro Genoni*,b, Piero Macchi*,c
a Department for Chemistry and Biochemistry, University of Bern, Freiestrasse 3, Bern 3012,
Switzerland
b Université de Lorraine & CNRS, Laboratoire de Physique et Chimie Théoriques (LPCT), UMR
CNRS 7019, 1 Boulevard Arago, F-57078 Metz, France
c Department of Chemistry, Materials and Chemical Engineering, Polytechnic of Milan, via Mancinelli
7, Milano 20131, Italy
E-mail: [email protected], [email protected], [email protected]
The purpose of this study is to assess the capability of X-ray restrained molecular wavefunction methods to reproduce the perturbation due to the crystal field.
The effect of the crystal environment on the molecular charge densities has been thoroughly investigated experimentally and theoretically. However, the same analysis in terms of molecular orbitals is unprecedented. We specifically analysed the extremely localized molecular orbitals (ELMOs) because they allow for a valence bond like interpretation that is closer to the typical chemical reasoning.
For a set of test molecules, we calculated first principles wavefunctions (called primary wavefunctions) and the corresponding scattered intensities (primary structure factors), that we afterwards used for X-ray restrained Hartree-Fock and ELMO calculations. This mimics the typical procedure of modelling wavefunctions from experimental X-ray diffraction, having the primary wavefunction as benchmark.
This study follows a previous investigation concerning the effects of electron correlation, where it was shown that those subtle features could be retrieved only to a minor extent. The electric field generated by surrounding molecules is instead more substantial. Therefore, retrieving this information should be more successful and, in case, extremely useful for supramolecular chemistry and crystal engineering. The work also provides useful indications to experimentalists who want to exploit the potentialities offered by the X-ray restrained wavefunction methods.
1. Introduction
Crystal field effects significantly affect the structure and properties of molecules in crystals. Long-range forces are mainly due to atomic/molecular charges whose strength is decaying with the reciprocal square power of the distance, whereas other forces are decaying more rapidly. On the other hand, short-range forces are a blend of different effects, including partially covalent interactions, charge transfer, the apparent repulsion due to the Pauli exclusion principle, London-type forces, as well as the electrostatic forces mentioned above. The interplay among these different factors is
2
extremely complex. However, understanding these interactions in crystals is fundamental for the purpose of rationally designing materials featuring specific properties and, more generally, for crystal engineering. Various techniques are being used to study interactions in crystals, from the traditional examination of crystal structures to the equally important analysis of electron densities and their derivatives[1–6] obtained from purely theoretical calculations or from experiments (especially from
X-ray diffraction measurements and subsequent modelling). Since the correlation of electron densities with properties is crucial, various descriptors based on the electron density itself were derived[7–11] and
used to analyse interactions .
In this context, the possibility to compute so-called X-ray constrained wavefunctions (XCWs)[12–18] has
emerged as a powerful approach that enables scientists to retrieve not only one-electron density distributions, but also tentative wavefunctions from experimental X-ray diffraction data. These wavefunctions are actually restrained (not exactly constrained) to structure factors (SF), as also pointed out by Jayatilaka[18]. Therefore, we will subsequently refer to them as X-ray restrained wavefunctions (XRW) in contrast to the generally used term in literature. These experimental wavefunctions can be obtained through the simultaneous minimization of the electronic energy and of the difference between observed and calculated structure factor magnitudes for a molecular wavefunction (WFN) ideally embedded in a crystal. X-ray restrained wavefunctions have been used in diverse studies for the analysis of crystal interactions and properties, e.g. for refractive indices[19,20] or
for the study of bonds[21–25], etc. While the majority of XRW studies focused on the electron density and its related properties in crystals, the XRW technique also provides molecular orbitals that were successfully used, for example, in the study of hypervalency[26–28]. These investigations on hypervalency showed that the use of both, electron density and molecular orbitals (as we have done in this study), allows for a full exploitation of the X-ray restrained wavefunction technique.
Although extended to different strategies of quantum chemistry[18,29–40], the XRW approach was
originally developed in the framework of the Hartree-Fock formalism and this is the level of theory that is still mainly used when X-ray restrained wavefunction calculations are performed. However, when the Hartree-Fock technique is exploited, both in the traditional way and within the XRW method, the resulting canonical orbitals generally spread over the entire molecule, thus hampering a straightforward chemical interpretation. On the other hand, more frequently, chemical-bonding analyses based on MOs take advantage of some localization strategies, reminiscent of valence bond treatments or of some perturbation theory-based approaches (as for example the analysis of frontier molecular orbitals or orbital diagrams widely adopted also in textbooks). Concerning the localization techniques, the goal is achieved by obtaining molecular orbitals mainly localized on small fragments within the molecule (generally, atoms and bonds). For example, traditional localized MOs are those obtained through unitary transformations of the canonical Hartree-Fock molecular orbitals[41–47] that maximize or minimize chemically/physically sound functionals (such as, the orbitals
self-3
extension[41,42], the orbitals auto-repulsion energy[43,44], the charge density overlap[45], the local orbital
populations[46,47]). Obviously, being unitary transformations of the canonical Hartree-Fock orbitals, they provide a wavefunction equivalent to the canonical Hartree-Fock one (they differ only for a phase factor) and, consequently, the same properties (e.g., total energy and electron density) for the system under exam. However, they are not exactly localized, but they have tails extending over other regions of the molecule than the specified fragment. This partially reduces their chemical interpretability. In order to build molecular orbitals that are strictly localized on molecular subunits, we have to resort to the so-called extremely localized molecular orbitals (ELMOs).[48,49] They are molecular orbitals exactly localized on any of the desired fragments, defined by a localization scheme chosen a priori according to the chemical intuition or some computational needs. In this case, due to a reduction in the variational space (i.e., the ELMOs are expanded on a subset of the available atomic basis functions, see Section 2.1), the Hartree-Fock representation is not preserved and, hence, the total energy associated with the ELMO wavefunction is higher than the corresponding Hartree-Fock one. This is the price to pay to have a strict localization and a better chemical interpretability.
Similar to the XRW approach with canonical Hartree-Fock MOs, an X-ray restrained wavefunction technique in the framework of the ELMO theory was also developed (XC-ELMO strategy in literature, subsequently termed XR-ELMO)[29,35–37]. As in the unrestrained case, the strict localization allows for a more straightforward chemical interpretability of the molecular orbitals. An inherent and immediate advantage of obtaining localized functions is the possibility to define them for specific fragments, such as atoms, bonds or functional groups, and to consequently store them as electronic LEGO building blocks in proper libraries[50–52] with the final goal of reconstructing electron densities and related properties[53,54] including structure factors. This allows for the refinement of crystallographic structures
of large systems (e.g. proteins and peptides) with undoubted advantages.[55]
In this study, we investigate another possibility offered by the X-ray restrained ELMOs: exploiting them to interpret supramolecular interactions in crystals within an orbital framework. In this way, the covalent interactions (directly addressed by molecular orbitals) as well as the electrostatic ones (evident from the moments of the charge densities) are equally accounted for. The goal of using ELMOs is to pinpoint orbitals that are mostly perturbed by an interaction and, consequently, to get insights into their roles (and the roles of the corresponding molecular fragments) in the stabilization of a crystal packing. Furthermore, it is interesting to find out whether the change in the extremely localized molecular orbitals is due to short-range or orbital interactions or, otherwise, to long-range effects due to the crystal field (see Figure 1). This approach could offer an alternative to the traditional method of analysing the crystal interaction densities by means of multipolar models.[56,57]
4
Figure 1 Oxalic acid molecule in a crystal. The strongest short-range interactions with the
surrounding water molecules are shown with black lines. Dark blue dots represent other oxalic acid molecules in the crystal, which, together with the surrounding water molecules shown as light blue dots, are responsible for the long-range crystal effects.
The paper is organized as follows. In the next section, we briefly describe the theoretical and computational details of our investigation, also presenting the fundamentals of the ELMO and XR-ELMO methods and describing the systems taken into account. Afterwards, we present and discuss the obtained results and finally, in the last section, we draw general conclusions.
2. Theory and methods
2.1. The ELMO and XR-ELMO techniques
The ELMO strategy originally proposed by Stoll[49] requires a predefined localization scheme that
subdivides the molecule into non-exclusive subunits. This implies assigning local basis-sets !! = !
!! !!!! !
to the different fragments, each of them given by the basis functions (or atomic orbitals) centred on the atoms that belong to the considered subunit. Afterwards, the molecular orbitals corresponding to the different fragments are expanded on these local basis-sets. For example, for the i-th subunit, i-the !-i-th ELMO can be expressed as:
!!! = !
!"! !!! !∈!!
(1)
The molecular wavefunction is the single Slater determinant constructed with orbitals defined in equation (1): Ψ!"#$ = 1 2! ! !"# ! ! !! ! ! ! !… ! !!! !!!! … !!! !!!… !!!! !!!! (2)
5
with ! as the antisymmetrizer operator, !! as the number of occupied ELMOs for the i-th fragment, !!! as a spin-orbital with spatial part !!! and spin part !, and !"# ! as the determinant of the overlap
matrix between the occupied ELMOs.
The coefficients of the linear combination (1) that define the extremely localized molecular orbitals are obtained by minimizing the energy associated with the ELMO wavefunction and are obtained by solving modified Hartree-Fock equations for each fragment in which the molecule under exam was initially subdivided:
!! !
!! = !!! !!! (3)
with !! as the Fock operator for the i-th fragment, which is defined as
!! = 1 − ! + !!! ! 1 − ! + !! (4)
where ! is the traditional Fock operator of quantum chemistry, !! is the local density operator for the
i-th subunit, which depends only on the occupied ELMOs of the fragment, and ! is the global density
operator, which depends on all the occupied ELMOs of the molecule and, for this reason, couples the eigenvalue-equations associated with the different subunits.
The only difference between the unrestrained and the X-ray restrained ELMO techniques is that the former are obtained with a traditional variational method, whereas the latter minimize the sum of the total energy of the system and the disagreement with respect to a set of X-ray structure factors weighted by their experimental uncertainties (if coming from a measurement). This means that the desired X-ray restrained ELMOs are those extremely localize molecular orbitals that always respect the expansion constraints imposed by equation (1), but that also minimize the functional:
! Ψ!"#$ = Ψ!"#$ ! Ψ!"#$ + λ! !! Ψ
!"#$ − ∆ (5)
where ! is the non-relativistic Hamiltonian operator for the reference molecule in the unit-cell of the crystal under exam, λ! is an external multiplier giving the strength of the experimental restraint, Δ is
the desired disagreement between calculated and experimental structure factors magnitudes, and !! is
the measure of the statistical disagreement between computed and experimental values. In particular,
!!= 1 !!− !! ! !!!"#! − !!!"# ! !!! ! (6)
with !! as the number of considered X-ray diffraction data, !! as the number of adjustable
parameters, ! as a triad of Miller indices labelling each reflection, !! as the experimental uncertainty
corresponding to the observed structure factor amplitude !!!"# , and ! as a scale factor that is determined by minimizing !!. Although the method is conceived to use experimental structure factor
6
procedure that we actually adopted for most of the X-ray restrained wavefunction calculations (including the XR-ELMO ones) carried out in the present study (see Subsection 2.2. and the Results section).
Looking for the ELMOs that minimize functional (5) corresponds to solving a new set of modified Hartree-Fock equations (one for each subunit),[29,35] which are formally analogous to those proposed
by Stoll:
!!,!"# !
!! = !!! !!! (7)
but where the modified Fock operator for the generic i-th fragment has this form:
!!,!"# = 1 − ! + !!! ! 1 − ! + !! + λ! !! Re !!!"#! ! 1 − ! + !!! ! !,! 1 − ! + !! + λ! !! Im !!!"#! ! 1 − ! + !!! ! !,! 1 − ! + !! 8 , where !!= 2! !!− !! ! !!!"#! − !!!"# !!! ! !!"#! (9)
and !!,! and !!,! are the real and imaginary parts of the structure factor operator given by
!!= !!,!+ ! !!,! = !!!! !!!!!!∙ !" (10) !!
!!!
with B as the matrix of the reciprocal-lattice and !!, !! !!!!! as the !! unit-cell symmetry operations.
2.2. Computational protocol 2.2.1. Compounds
We studied two different compounds starting with the very simple molecule HCN. At first this molecule was examined in an electric field and, at a later stage, in a crystal. In both cases the same geometry of the HCN molecule was used, namely the geometry optimized in vacuo at the B3LYP/cc-pVDZ level of theory. In order to study HCN in a crystal, we considered a hypothetical crystal of HCN with no symmetry elements except translation (space group P1) and, consequently, with only one molecule per unit-cell. The distance between the nitrogen atom of one molecule and the hydrogen atom of its closest neighbour was chosen to be 2.77 Å, which corresponds to the mean length of this particular hydrogen bond as retrieved from the CSD[58]. The search was made for triply bonded
7
constrained to 170-180° to obtain a linear contact, as it is the case in HCN (namely, C≡N⋯H-C). By chance, the unit-cell length in the direction along the molecule becomes exactly 5 Å. Therefore, the unit-cell dimensions were chosen to be 5 Å in each direction (a=b=c= 5 Å).
Afterwards we considered oxalic acid dihydrate, a hydrogen-bonded system, for which we took into account the geometries of three studied pressure points, all of them taken from a study conducted by Casati et al.[59]. The structures correspond to the ones deposited, where the hydrogen positions were
obtained with DFT calculations as described in that publication.
2.2.2. Periodic ab-initio calculations and structure factor simulation
For the case of HCN in an electric field, the molecule with fixed molecular geometry was placed in a hypothetical 10×10×10 Å3 unit cell in the absence of any roto-reflection symmetry element in order
to simulate structure factors with XD[60].
For all the examined crystal systems, single-point periodic calculations with Crystal17[61] were
performed on the described structures. The calculations were done at the restricted Hartree-Fock (RHF) level of theory with a 6-31G(d,p) basis set. The RHF/6-31G(d,p) combination was consistently used for all the single-point wavefunction calculations in vacuo or with periodic boundary conditions, as well as for all the X-ray restrained calculations for sake of consistency. XR-ELMO calculations are time-intensive, which is the reason why we adopted a rather low level of theory and a rather contracted basis set. Noteworthy, description of electron correlation is not of importance for the purpose of this study. At the moment, we are rather interested to test the machinery of XR-ELMOs and its ability to retrieve electric field-induced changes to the wavefunction, not in a very accurate wavefunction itself. For HCN in a hypothetical crystal and α-OAD at 0, 3.6, and 5.3 GPa, structure factors were simulated with Crystal17[61]. In addition, the MOLSPLIT option was used to calculate a periodic wavefunction
where no intermolecular interactions are present for reasons explained in Section 3.1. The software automatically recognizes oxalic acid and water as individual molecules and separates them far apart. Table 1 gives an overview about the three studied compounds, their unit-cells, symmetry, and resolution for which structure factors were simulated.
2.2.3. X-ray restrained calculations
For all the XRW calculations with canonical Hartree-Fock MOs (subsequently called XR-RHF) we exploited the Tonto[62] software. Δ was set to 0 and all computations were performed with a weighting factor λJ equal to 5, if not otherwise specified. Different λJ -values between 0.5 and 50 were also tested
but they did not lead to qualitatively different results from the λJ=5 case. Since in this study we mainly
used only theoretical structure factors as restraints, all the uncertainties !! were set equal to 1.0 e and
the obtained !! values were generally very low. All the XR-ELMO calculations were performed using
a modified version for the GAMESS-UK quantum chemistry package[63] where the XR-ELMO equations have been implemented. Also for these computations, we set λJ =5 and !! =1.0 e. The lattice
8
and the molecular geometry always corresponded to the calculation of the primary wavefunction and structure factors.
For the X-ray restrained wavefunction fitting calculation of OAD, the asymmetric unit was chosen in such a way that it contains one oxalic acid and two water molecules. For this purpose the inversion centre was removed and the atoms duplicated exactly at the symmetric coordinates such that the space group changed from P21/n to P21.
Table 1 Overview on the different investigated compounds with corresponding resolution for
structure factors.
System unit-cell dimension
(Å3) symmetry resolution for SF (Å -1)
HCN in electric field 10×10×10 P1 0.0-0.3, 0.0-0.7, 0.0-1.2, 0.0-1.8
HCN in crystal 5×5×5 P1 0.0-0.7
Oxalic acid dihydrate (periodic wavefunction
calculation)
experimental P21/n 0.0-0.8
Oxalic acid dihydrate (XRW calculation)
experimental P21 0.0-0.8
2.3. Differences between electron densities
We analysed the differences between the electron densities resulting from the various computations (from now on, density difference maps or, more simply, density differences). In particular, electron densities obtained from XRW calculations based on structure factors including electric field or crystal interactions were subtracted from electron densities from XRW calculations using structure factors without interactions (!!" !"#$%!" − !!"#$%!" or !!""!" − !!"#$%&'!" , see Table 2), as it will be described with
more details in the Results section for each specific case. For the direct comparison of the obtained XR-ELMOs ( !!" !"#$%!" !− !!"#$%!" ! or !!""!" !− !
!"#$%&'!" !), we decided to consider and subtract
the squared orbitals instead of the simple orbitals for two reasons: i) because the former are more directly connected to the electron density distributions and, above all, ii) because they do no depend on a phase factor.
9
Table 2 Definition of various density differences. IMM refers to the independent molecule model
(see the text for more details). Instead of (IMM-crystal), like in all the cases mentioned below, the differences can also be (no electric field – field). XR refers to wavefunctions or orbitals obtained from X-ray restrained calculations. The primary wavefunction is the initially calculated wavefunction used to simulate the structure factors.
Symbol difference between source in direct space source in reciprocal space
!!""− !!"#$%&' molecular electron densities primary wavefunction (Hartree-Fock or ELMO calculation) !!""!− ! !"#$%&' !
squared ELMOs primary wavefunction
(ELMO calculation) !!""!" − ! !"#$%&' !" molecular electron densities Hartree-Fock or
XR-ELMO calculations primary structure factors
!!""!" !− !!"#$%&'!" !
squared ELMOs XR-ELMO calculations primary structure factors
!! !=0 !" − ! !!>0 !" molecular electron densities Hartree-Fock or XR-ELMO calculations primary or measured structure factors !!!"!!! ! − !!!"!!! !
squared ELMOs XR-ELMO calculations primary or measured
structure factors (*)
10 3. Results
3.1. HCN
3.1.1. HCN - electric field
A molecule embedded in a crystal interacts with its first neighbours through short range intermolecular contacts, but it also feels the long range electric field generated by the outer molecules. In order to simulate the latter, we made the simplest approximation, which consisted in applying a homogenous and linear electric field along the linear molecule HCN in both orientations of the main inertial axis. The applied field was 0.01 a.u., which is of the order of magnitude typically experienced by a molecule in a crystal with intermediately strong packing forces. From now on, we will indicate these calculations (and the resulting electron densities) as “direct space calculations” (and “direct space electron densities”) to distinguish them from computations (and electron densities) associated with the use of structure factors (namely, reciprocal space information) as restraints. Subsequently, the direct space densities obtained from the wavefunctions calculated with and without the external electric field were subtracted as shown in Figure 2.
Figure 2 Electron density differences in direct space. The compared densities correspond to a
wavefunction calculated without any field and to wavefunctions resulting from computations with an electric field applied along the molecular axis (!!" !"#$%− !!"#$%). The plotted isosurface corresponds to 0.001 a.u. Blue regions indicate an accumulation of electron density when the electric field is applied, whereas red regions indicate depletion of electron density when the electric field is applied. At the terminal sites of the molecule, the electron density changes according to the electrostatic field direction. In the central part of the molecule (around the carbon atom), instead, we observe a reorganization of the electronic charge that compensates for the effect at the extremities. This illustrates a classical through-bond reorganization of the electron density in response to the external electric field.[64]
This is the behaviour obtained for the direct-space calculations. If the XRW procedure works, the same behaviour should be observed in XRW electron densities. For this reason we computed structure factors for the three wavefunctions (no-field, positive electric field corresponding to the left side of Figure 2, and negative electric field corresponding to the right side of Figure 2). As shown by Genoni
11
et al.[31], the diffraction resolution of the structure factors plays an important role. Therefore, structure
factors were simulated up to sinθ/λ = 1.8 Å-1 and X-ray restrained wavefunctions were calculated using four different resolution shells (0.0-0.3, 0.0-0.7, 0.0-1.2, 0.0-1.8 Å-1).
Figure 3 shows electron density differences !!" !"#$%!" − !
!"#$%!" obtained from X-ray restrained
wavefunctions at Hartree-Fock and ELMO levels. These XRWs were calculated by fitting to primary structure factors that include or exclude the effects of the electric field. In analogy to the direct space calculations, the electric field was also applied in both directions.
Figure 3 Density differences obtained by comparing XRW calculations with SF including and
excluding the electric field (!!" !"#$%!" − !!"#$%!" ), both at Hartree-Fock and ELMO level; blue regions indicate an accumulation of electron density for XRW calculations with SF including the electric field effects. For all the plots, the isovalue is 0.0002 a.u.
In general, the effect is comparable to the one obtained through the direct-space calculations, although it is damped (the isosurface level being 0.0002 a.u. in Figure 3 compared with 0.001 a.u. in Figure 2). This is due to the fact that XRW calculations by definition only partially include the effect of the electric field. In fact, while the second part of equation (5) contains this effect (through reciprocal space fitting), the first part (energy minimization) does not. This holds true not only for the electron density, but also for quantities derived from it, such as for the dipole moment shown in Figure S1. Furthermore, the diffraction resolution plays an important role for the electric field as it does also for including electron correlation[31]. In microscopy, a higher resolution is synonymous of higher accuracy in the image formation. However, in diffraction mode, where the image comes from optimizing a
12
model against the measured structure factors, the higher accuracy is non-homogeneously spread. Core electrons dominate the high scattering angle, while valence electrons, on which the effect of the electric field (as well as of electron correlation) is the largest, scatter only at low angles. Therefore, including higher angle data reduces the weight of the valence electrons and of their density. This pitfall is more pronounced for weaker deformations like those produced by an external electric field or by electron correlation, whereas it is less harmful for electron polarizations due to chemical bonding, because the effects are much larger. This explains the decreased magnitude and clarity of the density differences in Figure 3 with an increasing resolution. Increasing the strength of the simulated electric field from 0.01 a.u. to 0.1 a.u. qualitatively leads to similar results, as shown in Figure S2. An interesting feature is the lobe on the right side of the nitrogen nucleus, which, in Figure 2, is embedded in a larger and opposite-sign lobe. This seems to be an artefact arising from the transformation through reciprocal space and back to direct space. It is likely due to a poor description of the very diffuse density that contributes to the scattering only at very low resolution (hardly sampled by a medium/small-size unit-cell in direct space and therefore invisible).
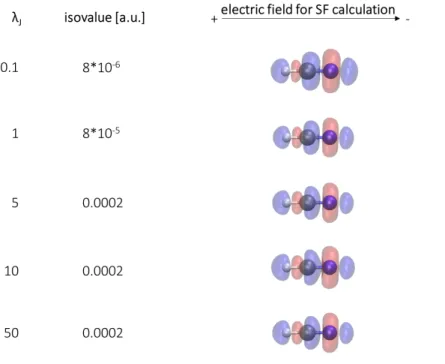
Figure 4 shows the results of X-ray restrained Hartree-Fock calculations using a set of structure factors up to only 0.3 Å-1 for different values of λ
J. When the isosurface levels are chosen as in Figure 4, it
becomes very clear that different λJ -values affect the results only quantitatively, but not qualitatively.
It is interesting to notice that, above a certain λJ -value, the isovalue does not need to be further
increased. It seems that, at that point, increasing the weight of the reciprocal space fitting does not significantly change the result.
Figure 4 Density differences obtained by comparing XR-RHF calculations with SF including and
13
density for XR-RHF calculations with SF including the effects of the electric field. The isovalue is adjusted to different λJ -values in order to highlight the qualitative similarity among the different cases.
In Figure 3, it is easy to observe that the density differences resulting from XR-ELMO calculations are completely analogous to those obtained through traditional X-ray restrained Hartree-Fock calculations. Therefore, the XR-ELMO results are trustable and we can analyse the orbital variations in the same way as those of the electron densities, as shown in Figure 5. As already mentioned in the section dedicated to the description of the computational protocol, the obtained orbitals were always squared before being compared (subtracted).
14
Figure 5 Orbital differences resulting from the comparison of XR-ELMO calculations with SF
including and excluding the electric field effects (!!" !"#$%!" !− !!"#$%!" !; blue regions indicate an accumulation of electron density for XRW calculations with SF including the effects of the electric field. The isovalue is set to 2*10-5 a.u.).
In Figure 5, within each set of four, the uppermost picture always refers to the nitrogen lone pair orbital, the second one to the C-H bond orbital, the third one to the C-N σ bond orbital and the lowest
15
one to one of the two π orbitals for the C-N bond. While the two π orbitals behave in the same way, the σ one only slightly changes because it describes electrons that are less polarizable. For all the three resolutions and for both fields, the electrons in the C-N π orbital move towards the positive direction of the electric field. The electrons in the C-H bond also move in an analogous way, whereas the ones in the N-lone pair orbital show an opposite behaviour, probably for compensation effects.
Noteworthy, this dual behaviour would not be revealed so straightforwardly by canonical Hartree-Fock orbitals.
From this first and very simple example of HCN in an electric field, we can draw already some conclusions: a) the electron density on the terminal atoms N and H complies with the electric field while the electron density on the carbon atom behaves oppositely for a compensation effect (see Figures 2 and 3); b) as for correlation, lower diffraction resolution is better; c) XR-ELMOs analysis allowed to reveal the effects of the electric field from a localized molecular orbital-based point of view and, consequently, to rationalize these effects in terms of molecular fragments. This would be impossible from an analysis on the overall electron density.
3.1.2. HCN - crystal field
The next step of our investigation consisted in simulating an entire crystal, where both long and short-range interactions were simultaneously present. As already explained in the section dedicated to the computational protocol, we constructed a hypothetical crystal based on HCN, where all molecules were aligned as described in section 2.2.1. As subsequently explained in the Computational protocol section, we computed structure factors based on a periodic wavefunction representing this crystal. Simulated structure factors have several advantages compared to experimental ones: a) thermal effects, which increase the complexity of the problem, are not included, b) any packing can be simulated, even those that are not observed in practice, c) calculated structure factors are not affected by experimental errors.
There is an additional motivation of using theoretical simulations: one can explicitly include and exclude some of the effects that we want to study. In particular, we performed calculations for a crystal with normally interacting molecules and one excluding the mutual interaction of molecules (using the MOLSPLIT option in Crystal17, as already explained in the Computational protocol section) in a sort of “independent molecule model” (hereinafter called IMM). For XR-ELMO calculations, this option is useful because the primary structure factors used as constraints are obtained from a periodic Hartree-Fock wavefunction. Therefore, an XR-ELMO calculation at a given λJ > 0
would also fit (compensate for) the error introduced by the use of ELMOs. In other words, a calculation at λJ > 0 would include the effect due to the crystal field and the fitting to canonical
16
important for comparison, since this also fits structure factors from canonical HF calculations but does not include intermolecular interactions. To exclude any bias due to the choice of the basis set, all the structure factors were simulated performing periodic RHF calculations with the same set of basis functions used for the XR-RHF and XR-ELMO calculations.
In order to judge how the crystal environment and specific interactions in the crystal influence the molecule, electron densities obtained from XR-RHF calculations based on structure factors including crystal interactions were subtracted from electron densities resulting from XR-RHF calculations fitting IMM structure factors, as shown in the difference-density plot at the bottom left of Figure 6. On the right side we also show the differences for four selected XR-ELMOs (which are analogous to those considered in Figure 5), calculated using primary structure factors up to 0.7 Å-1. Overall, the picture resembles the one where an electric field with orientation from H to N was applied (physical definition, with positive charge at N and negative charge at H; see Figure 5 for comparison). The similarity can be well explained by the fact that the molecule indeed feels this electric field in the crystal due to the dipole moment of the neighbouring molecules. The dominating blue lobe might be due to the hydrogen bond interaction, which causes electrons on the nitrogen to shift towards the hydrogen atoms of the adjacent molecule, thus reducing the red feature. Overall, the changes in the density and in the ELMOs under the effect of the crystal electric field are very small in absolute values, thus justifying the use of theoretical ELMOs as building block in the current version of the ELMO-databases[50–52]. Nonetheless, when plotted at a low iso-contour level, differences are visible, which point out the nature of the crystal environment. Thus, the use of structure factors from an independent molecule model (IMM) calculation can give valuable insights into these interactions.
17
Figure 6 Top left: density difference resulting from the comparison of the direct space IMM and
crystal calculations (!!""− !!"#$%&'; iso-contour level set to 0.0008 a.u.) Bottom left: density
differences resulting from the comparison of the XR-RHF calculation using IMM structure factors with the XR-RHF calculation using crystal structure factors (!!""!" − !!"#$%&'!" ; iso-contour level set to
4*10-5 a.u., blue=negative and red=positive). Right: orbital differences resulting from the comparison of the XR-ELMO calculation using IMM structure factors with the XR-ELMO calculation using crystal structure factors (!!""!" !− !
!"#$%&'!" !
; iso-contour level set to 2*10-5 a.u., blue=negative and
red=positive). All the XRW plots refer to XRW calculations exploiting structure factors calculated up to a resolution of 0.7 Å-1 and with λ
J set equal to 5.
3.2. Oxalic acid dihydrate
Finally, we examined the α-phase of oxalic acid dihydrate (OAD), featuring several strong hydrogen bonds, among which the strongest ones are transformed into bonds when the crystal gets compressed due to an external pressure.[59] From the six hydrogen bonds formed by one molecule (see Figure 7),
three are symmetry-independent. The shortest hydrogen bond at ambient pressure (1.464 Å) is the one formed by the carboxyl-hydrogen with the neighboring water molecule. It shortens with decreasing temperature[65] and with increasing pressure, while the O-H bond of the hydrogen bond involved in this contact elongates until the proton shifts towards the water at 5.3 GPa. Table 3 shows the hydrogen bond distances for OAD measured at different pressures.
Figure 7 Hydrogen bonds of oxalic acid dihydrate for the ambient pressure experimental structure.
18
Table 3 Bond and interaction distances (in Å) at different pressures. The colour code refers to
Figure 7. C=O --- HOH (blue) C=O --- HOH (green) OH --- OH2 (orange) O-H (solid line) 0 GPa 1.901 1.947 1.464 1.040 3.6 GPa 1.690 1.693 1.331 1.107 5.3 GPa 1.647 1.637 1.065 1.366
In analogy to the HCN case, periodic wavefunctions of α-OAD for the experimental structures at 0, 3.6, and 5.3 GPa were used to simulate structure factors. In addition, IMM wavefunctions were used to obtain a set of structure factors where no intermolecular interactions are present.
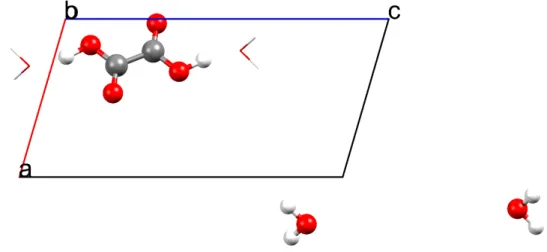
For the X-ray restrained wavefunction fitting calculation, the setting reported in Table 1 was chosen in order to have one entire (and symmetrical) molecule of oxalic acid and, necessarily, two molecules of water. These water molecules were properly chosen far from the oxalic acid (see Figure 8) to avoid the explicit strong hydrogen bonds shown in Figure 7. Therefore, the hydrogen bonds are activated only through the fitting of the structure factors calculated from periodic calculations on the experimental crystal structure but not in the direct-space calculation of the wavefunction of the supramolecular fragment (see again Figure 8). This choice enabled us to better highlight the influence of the structure factors on the oxalic acid not directly affected by the water molecules in the X-ray restrained wavefunction calculation.
Figure 8 In the calculation of the X-ray restrained wavefunctions, the water molecules and the oxalic
acid molecule (both shown in ball-and-stick representation) are chosen in such a way that they do not belong to the same lattice point. In fact, the water molecules are translated by a lattice vector (1,1,1). This quenches their interactions in the direct-space calculation of the wavefunction, but does not affect the analytical form of the molecular Hamiltonian. Thus, their effect is only taken into account through the reciprocal space fitting in the XWR calculations.
19
Figure 9 shows the density differences obtained by comparing XR-RHF calculations using IMM structure factors to XR-RHF calculations exploiting usual crystal structure factors (always !!"!!" −
!!"#$%&'!" ). There, the influence of the water molecules only considered in the structure factors part is clearly visible. In fact, when fitting to crystal structure factors, there is less electron density on the carboxylic hydrogen because the oxygen atoms of the water molecules are binding this site and, therefore, they push the electron density away. An effect is also visible on the carbonyl group, where a polarization occurs and electrons at the carbon atom are pushed away towards the oxygen, because the oxygen atom (an electron donor) is accepting a weak hydrogen bond from the water molecule. For the sake of comparison, in Figure S3 of the Supporting Information, we show the differences obtained by subtracting the electron density corresponding to a simple wavefunction calculation (RHF/6-1G(d,p)) on the oxalic acid with two water molecules as close as in the crystal structure at 0 GPa, to the electron density associated with a simple wavefunction calculation (RHF/6-31G(d,p)) on the oxalic acid with two water molecules that are 5 Å apart from the oxalic acid. This was done to show that the observed density differences are analogous to those seen in Figure 9 and, therefore, that they are indeed due to the short-range hydrogen bonds mentioned above. At 3.6 and 5.3 GPa the difference increases as shown in Figures 9b and 9c.
Figure 9 a) Electron density differences resulting from the comparison of XR-RHF calculations
using IMM structure factors with XR-RHF computations exploiting crystal structure factors. (!!""!" − !
!"#$%&'!" ; isosurfaces: 0.002 a.u. (top row) and 0.0008 a.u. (bottom row)). Red and blue
designate positive and negative regions, respectively. b and c) analogous results obtained for the crystal structures at 3.6 GPa and 5.3 GPa.
20
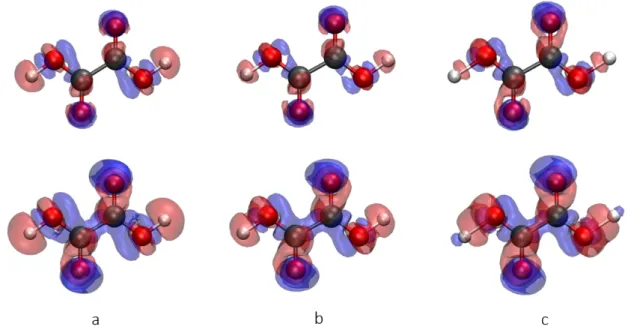
When analysing XR-ELMOs of Figure 10, one can see that the O-H σ-type orbital shifts electrons away from the hydrogen atom towards the covalently bonded oxygen due to the influence of the hydrogen bond to the neighbouring water molecule present in the crystal. An interesting feature appears at 5.3 GPa. At this pressure, the bond to the water is established and, therefore, there are again more electrons in this region, as one can evince from the small blue lobe. On the contrary, the region between the hydrogen and oxygen molecule is characterized by a depletion of the electron density. In carbonyl orbitals one can observe a shift of electrons from carbon to oxygen due to the weakening of the double bond in favour of additional interactions that the oxygen atom is forming.
Thus, only looking at the molecule itself and not knowing the interactions in the crystal, small changes in the XR-ELMOs can indicate which parts of the molecule are involved in the interactions. From the electron density and the σ O-H bond orbital at 5.3 GPa it also seems that this ELMO is able to indicate where a bond is being formed.
Figure 10 Top row: differences for the XR-ELMOs corresponding to the two O-H bonds; middle
row: differences for the XR-ELMOs associated with the two carbonyl π-orbitals; bottom row: differences for the XR-ELMO corresponding to one of the oxygen atom lone pairs. In all cases we depicted the differences !!""!" !− !
!"#$%&'!" !with the iso-contour level set to 0.0002 a.u.,
blue=negative and red=positive. The differences are shown for the computations performed on the crystal structures at 0 GPa, 3.6 GPa, and 5.3 GPa.
In Figure 11 we show the electron density differences resulting from the comparison of an unrestrained RHF calculation (λJ =0.0) and of an XR-RHF computation with experimentally
21
measured structure factors as restraints (λJ =0.5) using the crystal structure of the oxalic acid at
ambient pressure.[59] It is possible to see that the features of the electron density are very similar to those in Figure 9a. They are only slightly less pronounced. This can be attributed to the fact that an experimental dataset also contains temperature effects and noise. The analysis of the orbitals is thus more difficult. Nevertheless, also in this case, for the ELMOs corresponding to O-H bonds involved in hydrogen-bond contacts, we can observe the same effects already highlighted for the simulated structure factors.
Figure 11 Left: density differences resulting from the comparison of the unrestrained
RHF/6-31G(d,p) calculation with the XR-RHF/6-RHF/6-31G(d,p) computation (with λJ =0.5 and experimental
structure factor magnitudes) on the crystal structure of OAD at ambient pressure (!!!!!!" − !!!!!.!!" ; isosurface: 0.004 a.u., blue=negative and red=positive); right: corresponding ELMO differences ( !!!!!!" !− !!!!!.!!" !; isosurface: 0.004 a.u., blue=negative and red=positive).
4. Conclusions
This work focused on X-ray restrained wavefunction fittings, both with canonical orbitals and with extremely localized molecular orbitals. The main finding was that X-ray restrained wavefunction techniques are able to account for the electron density and molecular orbital deformations caused by intra-crystal electric fields. We simulated structure factors calculated with or without an applied electric or crystal field. If the crystal field is switched off, but the wavefunction is anyway periodic (for example using the option MOLSPLIT of Crystal17), we generate an independent molecule model.
22
This provides a benchmark for molecular or orbital density differences, very useful to highlight the effects of the crystal field. These density differences are generally small, thus justifying the use of purely theoretical ELMOs in databases[37,50,66] constructed for improving the refinement of
macromolecular crystal structures.[55]
The diffraction resolution plays a role similar to the one already observed for correlation:[31] high
resolution data do not allow a better recovery of the electric field effect but a worse one. This can be explained with the down-weighting of the low-angle reflections, which are important for a good modelling of the valence electrons.
With the example of HCN under the influence of an electric field, it was shown that not all XR-ELMOs polarize in the direction of an applied electric field. Some of them are actually polarized in the opposite direction. The method was also successful in the analysis of the intermolecular interaction effects for the more complicated system of the oxalic acid dihydrate. In that case it was possible to highlight the influence of the hydrogen bond contacts on the electron density of the oxalic acid molecule, whose effects become more important as pressure increases.
Furthermore, for OAD, both experimental and simulated structure factors were used. Therefore, in light of the obtained results, the approach can also be exploited when measured X-ray data are available, although the pictures might become slightly less clear because experimental structure factors intrinsically contain more information than the theoretical ones and are affected by experimental errors. Further applications and tests of the technique, also using challenging experimental cases, are already envisaged.
5. Acknowledgments
M.E and P.M. thank the NCCR Marvel for financial support. A.G. acknowledges the French Research Agency (ANR) for financial support of the Young Researcher Project QuMacroRef through Grant No. ANR-17-CE29-0005.
6. Keywords
Crystal field effects; Extremely localized molecular orbitals (ELMOs); Intermolecular interactions; X-ray restrained wavefunctions
23
[1] A. Krawczuk, P. Macchi, Chem. Cent. J. 2014, 8, 68.
[2] A. J. Edwards, C. F. Mackenzie, P. R. Spackman, D. Jayatilaka, M. A. Spackman, Faraday
Discuss. 2017, 203, 93–112.
[3] P. Macchi, Chim. Int. J. Chem. 2014, 68, 31–37.
[4] A. Krawczuk, M. Gryl, in Multi-Component Cryst. (Eds.: E. Tiekink, J. Zukerman), De Gruyter, Berlin, Boston, 2017, pp. 59–102.
[5] J. M. Bąk, Ż. Czyżnikowska, P. M. Dominiak, Acta Crystallogr. Sect. A Found. Crystallogr.
2012, 68, 705–714.
[6] B. Dittrich, E. Sze, J. J. Holstein, C. B. Hübschle, D. Jayatilaka, Acta Crystallogr. Sect. A
Found. Crystallogr. 2012, 68, 435–442.
[7] R. F. W. Bader, Acc. Chem. Res. 1985, 18, 9–15.
[8] G. Saleh, C. Gatti, L. Lo Presti, J. Contreras-García, Chem. - A Eur. J. 2012, 18, 15523–15536. [9] E. R. Johnson, S. Keinan, P. Mori-Sánchez, J. Contreras-García, A. J. Cohen, W. Yang, J. Am.
Chem. Soc. 2010, 132, 6498–6506.
[10] J. Contreras-García, E. R. Johnson, S. Keinan, R. Chaudret, J.-P. Piquemal, D. N. Beratan, W. Yang, J. Chem. Theory Comput. 2011, 7, 625–632.
[11] A. D. Becke, K. E. Edgecombe, J. Chem. Phys. 1990, 92, 5397–5403. [12] D. Jayatilaka, Phys. Rev. Lett. 1998, 80, 798–801.
[13] D. Jayatilaka, D. J. Grimwood, Acta Crystallogr. Sect. A Found. Crystallogr. 2001, 57, 76–86. [14] D. J. Grimwood, D. Jayatilaka, Acta Crystallogr. Sect. A Found. Crystallogr. 2001, 57, 87–
100.
[15] I. Bytheway, D. J. Grimwood, D. Jayatilaka, Acta Crystallogr. Sect. A Found. Crystallogr.
2002, 58, 232–243.
[16] I. Bytheway, D. J. Grimwood, B. N. Figgis, G. S. Chandler, D. Jayatilaka, Acta Crystallogr.
Sect. A Found. Crystallogr. 2002, 58, 244–251.
[17] D. J. Grimwood, I. Bytheway, D. Jayatilaka, J. Comput. Chem. 2003, 24, 470–483. [18] D. Jayatilaka, Modern Charge-Density Analysis, Springer Netherlands, Dordrecht, 2012. [19] A. E. Whitten, D. Jayatilaka, M. A. Spackman, J. Chem. Phys. 2006, 125, 174505.
[20] D. Jayatilaka, P. Munshi, M. J. Turner, J. A. K. Howard, M. A. Spackman, Phys. Chem. Chem.
Phys. 2009, 11, 7209.
[21] L. Chęcińska, S. Mebs, B. Ośmiałowski, A. Zakrzewska, K. Ejsmont, M. Kohout,
ChemPhysChem 2016, 17, 2395–2406.
[22] S. Grabowsky, P. Luger, J. Buschmann, T. Schneider, T. Schirmeister, A. N. Sobolev, D. Jayatilaka, Angew. Chemie Int. Ed. 2012, 51, 6776–6779.
[23] D. Jayatilaka, D. Grimwood, Acta Crystallogr. Sect. A Found. Crystallogr. 2004, 60, 111–119. [24] S. Grabowsky, D. Jayatilaka, S. Mebs, P. Luger, Chem. - A Eur. J. 2010, 16, 12818–12821. [25] S. Grabowsky, M. Weber, D. Jayatilaka, Y. S. Chen, M. T. Grabowski, R. Brehme, M. Hesse,
24
T. Schirmeister, P. Luger, J. Phys. Chem. A 2011, 115, 12715–12732.
[26] M. Fugel, F. Kleemiss, L. A. Malaspina, R. Pal, P. R. Spackman, D. Jayatilaka, S. Grabowsky,
Aust. J. Chem. 2018, 71, 227.
[27] M. Fugel, M. V. Ponomarenko, M. F. Hesse, L. A. Malaspina, F. Kleemiss, K. Sugimoto, A. Genoni, G.-V. Röschenthaler, S. Grabowsky, Dalt. Trans. 2019, 48, 16330–16339.
[28] M. Fugel, L. A. Malaspina, R. Pal, S. P. Thomas, M. W. Shi, M. A. Spackman, K. Sugimoto, S. Grabowsky, Chem. – A Eur. J. 2019, 25, 6523–6532.
[29] A. Genoni, J. Chem. Theory Comput. 2013, 9, 3004–3019.
[30] A. Genoni, G. Macetti, D. Franchini, S. Pieraccini, M. Sironi, Acta Crystallogr. Sect. A Found.
Adv. 2019, 75, 778–797.
[31] A. Genoni, L. H. R. Dos Santos, B. Meyer, P. Macchi, IUCrJ 2017, 4, 136–146. [32] L. Bučinský, D. Jayatilaka, S. Grabowsky, J. Phys. Chem. A 2016, 120, 6650–6669. [33] M. Hudák, D. Jayatilaka, L. Perašínová, S. Biskupič, J. Kožíšek, L. Bučinský, Acta
Crystallogr. Sect. A Found. Crystallogr. 2010, 66, 78–92.
[34] S. Grabowsky, A. Genoni, H.-B. Bürgi, Chem. Sci. 2017, 8, 4159–4176. [35] A. Genoni, J. Phys. Chem. Lett. 2013, 4, 1093–1099.
[36] L. H. R. Dos Santos, A. Genoni, P. Macchi, Acta Crystallogr. Sect. A Found. Adv. 2014, 70, 532–551.
[37] A. Genoni, B. Meyer, Adv. Quantum Chem. 2016, 73, 333-362 [38] A. Genoni, Acta Crystallogr. Sect. A Found. Adv. 2017, 73, 312–316.
[39] A. Genoni, D. Franchini, S. Pieraccini, M. Sironi, Chem. - A Eur. J. 2018, 24, 15507–15511. [40] N. Casati, A. Genoni, B. Meyer, A. Krawczuk, P. Macchi, Acta Crystallogr. Sect. B Struct. Sci.
Cryst. Eng. Mater. 2017, 73, 584–597.
[41] S. F. Boys, Rev. Mod. Phys. 1960, 32, 296–299.
[42] J. M. Foster, S. F. Boys, Rev. Mod. Phys. 1960, 32, 300–302. [43] C. Edmiston, K. Ruedenberg, Rev. Mod. Phys. 1963, 35, 457–464. [44] C. Edmiston, K. Ruedenberg, J. Chem. Phys. 1965, 43, S97–S116. [45] W. von Niessen, J. Chem. Phys. 1972, 56, 4290–4297.
[46] J. Pipek, P. G. Mezey, Int. J. Quantum Chem. 1988, 34, 1–13. [47] J. Pipek, P. G. Mezey, J. Chem. Phys. 1989, 90, 4916–4926.
[48] M. Sironi, A. Genoni, M. Civera, S. Pieraccini, M. Ghitti, Theor. Chem. Acc. 2007, 117, 685– 698.
[49] H. Stoll, G. Wagenblast, H. Preuss, Theor. Chim. Acta 1980, 57, 169–178.
[50] B. Meyer, B. Guillot, M. F. Ruiz-Lopez, A. Genoni, J. Chem. Theory Comput. 2016, 12, 1052– 1067.
[51] B. Meyer, B. Guillot, M. F. Ruiz-Lopez, C. Jelsch, A. Genoni, J. Chem. Theory Comput. 2016,
25
[52] B. Meyer, A. Genoni, J. Phys. Chem. A 2018, 122, 8965–8981.
[53] D. Arias-Olivares, E. K. Wieduwilt, J. Contreras-García, A. Genoni, J. Chem. Theory Comput.
2019, 15, 6456–6470.
[54] G. Macetti, A. Genoni, J. Phys. Chem. A 2019, 123, 9420–9428.
[55] L. A. Malaspina, E. K. Wieduwilt, J. Bergmann, F. Kleemiss, B. Meyer, M. F. Ruiz-López, R. Pal, E. Hupf, J. Beckmann, R. O. Piltz, et al., J. Phys. Chem. Lett. 2019, 8571, 6973–6982. [56] M. P. C. M. Krijn, H. Graafsma, D. Feil, Acta Crystallogr. Sect. B 1988, 44, 609–616.
[57] B. Dittrich, M. A. Spackman, Acta Crystallogr. Sect. A Found. Crystallogr. 2007, 63, 426–436. [58] C. R. Groom, I. J. Bruno, M. P. Lightfoot, S. C. Ward, Acta Crystallogr. Sect. B Struct. Sci.
Cryst. Eng. Mater. 2016, 72, 171–179.
[59] N. Casati, P. Macchi, A. Sironi, Chem. Commun. 2009, 2679.
[60] T. Koritsanszky, P. Macchi, C. Gatti, L. J. Farrugia, P. R. Mallinson, A. Volkov, T. Richter,
Man. XD2006 2007.
[61] R. Dovesi, A. Erba, R. Orlando, C. M. Zicovich-Wilson, B. Civalleri, L. Maschio, M. Rérat, S. Casassa, J. Baima, S. Salustro, et al., Wiley Interdiscip. Rev. Comput. Mol. Sci. 2018, 8, e1360. [62] D. Jayatilaka, D. J. Grimwood, Comput. Sci. - Iccs 2003, Pt Iv, Proc. 2003, 2660, 142–151. [63] M. F. Guest, I. J. Bush, H. J. J. Van Dam, P. Sherwood, J. M. H. Thomas, J. H. Van Lenthe, R.
W. A. Havenith, J. Kendrick, Mol. Phys. 2005, 103, 719–747.
[64] A. Fischer, D. Tiana, W. Scherer, K. Batke, G. Eickerling, H. Svendsen, N. Bindzus, B. B. Iversen, J. Phys. Chem. A 2011, 115, 13061–13071.
[65] Y. Wang, C. J. Tsai, W. L. Liu, L. D. Calvert, Acta Crystallogr. Sect. B Struct. Sci. 1985, 41, 131–135.
[66] B. Meyer, B. Guillot, M. F. Ruiz-Lopez, C. Jelsch, A. Genoni, J. Chem. Theory Comput. 2016,