HAL Id: hal-02924397
https://hal.archives-ouvertes.fr/hal-02924397
Submitted on 4 Nov 2020HAL is a multi-disciplinary open access
archive for the deposit and dissemination of sci-entific research documents, whether they are pub-lished or not. The documents may come from teaching and research institutions in France or abroad, or from public or private research centers.
L’archive ouverte pluridisciplinaire HAL, est destinée au dépôt et à la diffusion de documents scientifiques de niveau recherche, publiés ou non, émanant des établissements d’enseignement et de recherche français ou étrangers, des laboratoires publics ou privés.
Policy-Relevant Assessment of Urban CO 2 Emissions
Thomas Lauvaux, Kevin Gurney, Natasha Miles, Kenneth Davis, Scott
Richardson, Aijun Deng, Brian Nathan, Tomohiro Oda, Jonathan Wang, Lucy
Hutyra, et al.
To cite this version:
Thomas Lauvaux, Kevin Gurney, Natasha Miles, Kenneth Davis, Scott Richardson, et al.. Policy-Relevant Assessment of Urban CO 2 Emissions. Environmental Science and Technology, American Chemical Society, 2020, 54 (16), pp.10237-10245. �10.1021/acs.est.0c00343�. �hal-02924397�
Policy-Relevant Assessment of Urban CO
2
Emissions
Thomas Lauvaux,
*
Kevin R. Gurney, Natasha L. Miles, Kenneth J. Davis, Scott J. Richardson,
Aijun Deng, Brian J. Nathan, Tomohiro Oda, Jonathan A. Wang, Lucy Hutyra, and Jocelyn Turnbull
https://dx.doi.org/10.1021/acs.est.0c00343
ABSTRACT: Global fossil fuel carbon dioxide (FFCO2) emissions will be dictated to a great degree by the trajectory of emissions from urban areas. Conventional methods to quantify urban FFCO2 emissions typically rely on self-reported economic/energy activity data transformed into emissions via standard emission factors. However, uncertainties in these traditional methods pose a roadblock to implementation of effective mitigation strategies, independently monitor long-term trends, and assess policy outcomes. Here, we demonstrate the applicability of the integration of a dense network of greenhouse gas sensors with a science-driven building and street-scale FFCO2emissions estimation through the atmospheric CO2inversion process. Whole-city FFCO2emissions agree within 3% annually. Current self-reported inventory emissions for the city of Indianapolis are 35% lower than our optimal estimate, with significant differences across activity sectors. Differences remain, however, regarding the spatial distribution of sectoral FFCO2 emissions, underconstrained despite the inclusion of coemitted species information.
■
INTRODUCTIONDespite the recent increase in renewable energy supply and the transition from coal to natural gas, fossil fuel emissions of carbon dioxide (FFCO2) continue to increase globally at a rate of about 2% annually, a pace driven primarily by growth in Asia and the United States (+2−3%) somewhat moderated by Europe (−2.5%) in 2018.1 Roughly three-quarters of energy-related FFCO2 emissions are generated by urban-based activities2 implying that subnational and city governments have the opportunity to play a central role in achieving the objectives of emission reductions as stated by the Paris agreementa.3Trends in global population distribution suggest that urban growth will be dominated by large and medium-sized urban areas in the coming decades (≥250 000 people), projected to represent 70% of the global population by 2050 compared to 50% in 2016.4 In response to the challenges of the growing energy demand and in support of international climate agreements, city governments and consortia of major metropolitan areas have begun to pledge and implement mitigation strategies (e.g., C40 Cities Climate Leadership Groupb). FFCO2 emission reduction choices, cost-e ffective-ness, and reduction assessment depend on having a reliable
quantitative understanding of urban emissions with sufficient spatial and functional detail and a means to assess trends5and individual reduction policy effectiveness.6 Despite efforts by city governments to build self-reported inventories, emission uncertainties remain large and likely exceed annual urban emission trends in emission reductions (which leveled at about 2% per year for the top third of the C40 cities).7 Emission quantification at the subcity scale and useful integration with cobenefits such as air quality goals in addition to generating targeted and cost-effective reduction options8 remain partic-ularly challenging for cities to generate in budget-constrained conditions. Finally, standardized data sources and estimation procedures are not fully developed and/or adopted leading to continued discrepancies among inventory estimates.9The role of atmospheric measurements to monitor long-term trends in
Received: January 17, 2020
Revised: July 16, 2020
greenhouse gas (GHG) fluxes has been unequivocal at the global scale.10A similar approach to quantifyingfluxes and flux trends has been suggested at finer scales, with a particular emphasis on cities, given the increasing policy demand and the autonomy many cities possess over GHG reduction policy suggests and opportunity for new mitigation action.11 Approaches that combine or assimilate information from a collection of observed quantities to constrainfluxes at relevant scales in urban domains are in rapid development.12,13 Atmospheric approaches assimilate atmospheric mixing ratio measurements and advanced bottom-up flux estimation into models of urban atmospheric transport to achieve the required granularity in emissions and hence become policy rele-vant.14−17 However, most studies have focused on annual whole-city emissions lacking information on individual sectors of the economy. The combination of integrated flux accuracy with space/time and process (e.g., fuel, sector, combustion type, vegetation type) flux detail offers relevant and reliable information for urban stakeholders.18Such an approach might achieve the level of confidence required to assist local governments to make informed decisions and track their progress toward mitigation goals. To achieve levels of precision sufficient to assess sector-specific emission trends from various sectors of the economy and do so with spatial detail, the approach requires a dense network of atmospheric sensors and space/time-explicit bottom-up emissions estimates. Among the many ongoing experiments testing these approaches in urban areas, an experiment deployed in 2010, the Indianapolis Flux Experiment (INFLUX),19 provides an ideal test-bed for thoroughly exploring specific aspects of this approach, namely the density and accuracy of the atmospheric carbon (CO2, CH4, CO) monitoring component,
20
the contribution of high-resolution bottom-up FFCO2 emission estimates,21 urban vegetationflux estimation,22and the sensitivity of the inversion setup.16
With 872 680 inhabitants, Indianapolis ranks 17th among US citiesc and 287th globally. Among city populations in developed and developing countries, Indianapolis stands in the top third of global metropolitan areas, composed of 500 000−5 million inhabitants. About 20% of these urban areas are larger than 5 million (about 70 metropolitan areas around the world), while 45% of the world population lives in cities of 300 000 or less. Hence, medium-sized cities like Indianapolis represent a baseline for monitoring systems, assuming a significant fraction of the global fossil fuel emissions would be monitored by atmospheric systems. With productive agricul-tural land, limited forests, and an expansive urbanized area, Indianapolis is a fair representation of metropolitan areas located in the mid-latitudes and an important first step in demonstrating the potential of advanced assimilation ap-proaches to support climate change decision-making in cities. Consideration of the physical, economic, and demographic conditions of Indianapolis and its relationship to the broader landscape is crucial to building the experiment and interpreting the results. Metropolitan areas in the Midwest of the United States are typically organized around a medium-density downtown, encircled by a traffic-heavy beltway itself connected to major interstate highways with large amounts of commercial truck traffic. Such is the case of Indianapolis, IN with emissions from on-road vehicles adding up to half of the city budget.21 Suburban areas are spread unevenly in development blocks, forming concentric layers of decreasing housing density, correlated with the distance from the beltway. Industrial
facilities are distributed somewhat randomly within and around the central urban area with the notable presence of a major power plant (Harding Street) that releases a third of the city emissions. Mixed vegetation (e.g., vegetation type, manage-ment level) exists throughout the city with increasing density in the outer ring of primarily suburban development.
The advanced assimilation approach described here remains nontrivial to implement at the city scale. Multiple challenges have to be addressed such as the collection of atmospheric carbon measurements at selected locations and at a sufficient height in and around the city,20the representation of the local atmospheric dynamics,23 construction of the optimization algorithm used to assess FFCO2 emissions separately from biogenic carbon exchange, and construction of the building/ street-scale bottom-up FFCO2emissions data product.21Here, we demonstrate how advanced assimilation approaches can detect subcity fluxes at sufficiently small uncertainty to track potential mitigation policies by associating atmospheric information with emissions from various data sources on human activities. Our findings are based on a state-of-the-art optimization system combining multiple atmospheric trace gases and two broad sectors of economic activity.
■
METHODSThe optimization system presented here assimilates hourly atmospheric mixing ratios of CO2and CO collected during the afternoon (12 p.m. to 5 p.m.) with anthropogenic and biogenic surface fluxes at 1 km resolution. Tower footprints representing the relationship between mixing ratios and surface fluxes were simulated using simulations from the Weather Research and Forecasting model (WRFv3.6.124) in Four-Dimensional Data Assimilation mode,23 assimilating surface stations of the World Meteorological Organization, coupled offline to the Lagrangian Particle Dispersion Model25 in backward mode. Particles were released at 20 s intervals (6300 per hour per tower) and stored every 2 min to track air motion at 1 km resolution. The optimization uses a Bayesian inversion framework16solving analytically for a 5 day mean of threeflux components: stationary and mobile anthropogenic emissions, and biogenicfluxes. Attribution of flux contributions to CO is based on emission factors developed by adjusting reported sectoral emission factors to matchflask-based observations of 14CO
2, CO2, and CO from the INFLUX tower network.
26,27
The first guess (or state vector) represents the three flux components at 1 km resolution from the Hestia emission product21 for emissions and from a modified version of VPRM17for biogenicfluxes.
Atmospheric mixing ratio measurements were collected at 12 tower locations for CO2and a subset offive sites for CO mixing ratios, averaged hourly from calibrated Picarro Cavity Ring-Down Spectrometers.20,28,29 Air samples were dried to below 0.2% H2O (0.6% at Site 02) to avoid the need for yearly water vapor calibrations.30Calibration protocol to comply with WMO/NOAA standards31was evaluated to reach an accuracy of 0.18 ppm for CO2 and 6 ppb for CO when compared to discrete flask samples.29 Observations were made at heights ranging from 39 to 136 m above ground level using existing communication towers.20 Data availability and site locations are described inSI Appendix.
Bottom-up emissions from the Hestia CO2 emission product21,32 are available for each of the eight economic sectors, merged into two main sectors of emissions27 corresponding to low (referred to as stationary incl. residential,
industrial, commercial, utility, airport, and railroad sectors) and high (ref to as mobile incl. on-road and off-road sectors) CO/ CO2ratios.33Hestia emissions were aggregated from the initial building-level product down to the 1 km resolution footprint grid, covering Marion County and the eight surrounding counties.
The Open-source Data Inventory for Anthropogenic CO2 (ODIAC) spatial distributions were estimated at 1 × 1 km2 resolution.34Compared to Hestia, ODIAC is available globally by downscaling national fossil fuel consumption statistics (cf.
Supporting Information), hence applicable to other urban areas across the world. The emissions from power plants are mapped using the geolocation reported in the Carbon Monitoring and Action (CARMA) global power plant database,d and the rest of the emissions (nonpoint source emissions) are distributed using satellite observed nightlight data. When using ODIAC as a priori, only the total fossil fuel emissions (no sector) and biogenic fluxes were optimized. A single CO/CO2ratio was used corresponding to the weighted average over the eight sectors of Hestia.
The urban Vegetation Photosynthesis and Respiration Model35incorporates the highly variable fraction of impervious surface area (ISA) from the National Land Cover Database (NLCD36) to modulate carbon fluxes from these heteroge-neous landscapes. Nonpaved portions of Indianapolis were defined as deciduous, broadleaf forest. VPRM is driven by greenness data from the MODIS product and NARR climate reanalysis, while parameters were optimized for four land cover/land use types (i.e., irrigated maize, soybeans, grasslands, and forest)37to produce hourly carbonfluxes as the weighted average of carbonfluxes for each of the four land cover/land use classes.
We defined uncertainties in the Hestia and ODIAC fossil fuel emissions with variances proportional to the net emissions (100% of the net pixel emissions) and spatial error correlations (i.e., error covariances) following urban land cover and an exponentially decaying length scale of 4 km.16 Sensitivity experiments showed that only uncertainties in Harding Street
power plant emissions had a significant impact on the spatial attribution (cf. Supporting Information). For the VPRM biogenic fluxes, the uncertainties were assumed to be larger than fossil fuel emissions as diagnosed from previous studies.37 An exponentially decaying length scale of 12 km was assumed over 5 days over the vegetated area. Transport model uncertainties were defined at each hour based on model-data statistics of wind speed and direction,23 further calibrated based on a χ2 normalized distance between 0.75 and 1.25.16
Final uncertainties on fossil fuel emissions and biogenicfluxes presented in this study correspond to the posterior error covariances produced by the inversion system aggregated over the domain.
■
RESULTSBuilding- and street-level emissions from the Hestia Project21,32 serve as an adjustable bottom-up flux constraint to the optimization system, which sequentially assimilates daytime hourly CO2and CO atmospheric mixing ratios from the INFLUX network over 5 day periods. The optimization procedure generates 1 km resolution maps of sectoral CO2 emissions for mobile and stationary sources and biogenicfluxes from vegetation. Over 3 years (September 2012−September 2015), aggregated whole-city emissions are only slightly lower than the Hestia estimate (−0.6%) with minor adjustments to 5 day FFCO2 emissions (14%; cf. Figure 1). Biosphere net carbon uptake, based on simulated ecosystem exchanges from the Vegetation Photosynthesis and Respiration Model (VPRM;17,35,38SI Appendix, Section 5) modified to simulate urban and agricultural land covers, decreased by 7% over the 3 years, with winters showing a 3−8% reduction in net emission (less positiveflux) and summers showing a 6−8% reduction in net uptake (less negative). With a larger biogenic flux adjustment in summer (reduced photosynthetic uptake), the 3 year adjustment corresponds to an overall decrease of the biogenic net carbon uptake. FFCO2 emissions were little adjusted in summer (<0.5%) due to the tighter uncertainty constraint on FFCO2 emissions compared to the biogenic
Figure 1.Whole-city 5 day averaged FFCO2emissions from the city of Indianapolis, IN (nine counties) in ktC from September 2012 to September
2015 before and after optimization for the fossil fuel CO2emissions (upper panel), the biogenicfluxes (lower panel), and the adjustments after
fluxes. During the three dormant seasons, optimized FFCO2 emissions are slightly lower than the initial Hestia estimate (−2 to−3.2%). When exploring the two specific FFCO2emission sectors (mobile and stationary sources, cf. Figure 2), the atmospheric solution varies from no FFCO2flux adjustment to a solution in which mobile FFCO2 emissions are increased slightly (+2%) and stationary sources are reduced (−6%). The atmospheric constraint for each sector starts to deviate from the initial Hestia emissions estimate when larger uncertainties are prescribed to the coal-fired power plant (from 15 to 30% deviation in both the mobile and stationary sectors). However, the higher confidence reported from hourly energy production statistics39 and the degraded statistical metrics (lower good-ness-to-the-fit) do not support prescribing larger uncertainties to the emissions from the power plant. Overall, the atmospheric and bottom-up constraints (fossil fuel emissions) lie within 3% of each other annually.
More importantly for FFCO2 emissions mitigation policy, the absence of understanding of interannual variations in whole-city daytime emissions limits our ability to quantify the amount of information added by atmospheric observations. To evaluate the influence of the atmospheric constraint, we introduced a seasonally dependent bias to the bottom-up Hestia FFCO2 flux constraint and computed the final mismatch at different time scales. For a 15% positive bias imposed on Hestia, the atmospheric constraint produces a median correction of −14.2%, removing nearly all of the introduced bias (Figure 2). About one-fifth of the 5 day emission estimates fall within 10% of the original Hestia values. The overall agreement between the two constraints is about 2.5% over the 3 years despite the additional bias introduced to the bottom-up constraint. Seasonally, the median of wintertime adjustments is about −16%, slightly overadjusted, whereas
Figure 2.Whole-city 5 day averaged FFCO2emissions from the city of Indianapolis, IN (nine counties) in ktC from September 2012 to September
2015 before and after optimization for each sector of the fossil fuel emissions with mobile (upper panel) and stationary (lower panel) sources, all aggregated from 1 km resolutionfluxes.
Figure 3.Whole-city daytime fossil fuel CO2emissions in MtC normalized over 3 years (September 2012−September 2015) for different a priori
emissions (5 day estimates) and optimized emissions for 5 day, monthly, annual, and 3 year estimates. The central lines represent the mean absolute differences from Hestia emissions and the box heights represent the associated uncertainties (posterior uncertainties after optimization). Hestia whole-city daytime emissions are represented by the dashed lines.
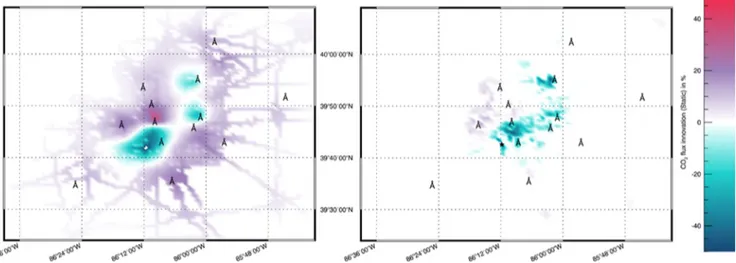
summertime adjustments are about −8%, lower than winter-time adjustments due to higher uncertainties in biogenicfluxes. We further explore the importance of granularity from the Hestia bottom-up emission estimates in light of the fact that most cities across the globe have limited information related to the spatial distribution of their emissions. Here, we use alternative emissions at a coarser resolution derived from spatially disaggregated national emissions using nightlight satellite data, the Open-source Data Inventory for Anthro-pogenic CO2(ODIAC)34 (SI Appendix, Section 4). Wefind that the optimized daytime emissions (11.2 MtC) agree within 3% of the Hestia-based optimized emissions (11.5 MtC) (Figure 3, upper panel). When assimilating only CO2mixing ratios, the convergence diminishes slightly with an FFCO2 underestimation of 6% over the 3 years, suggesting that CO mixing ratios increase the contribution of fossil fuel emissions compared to biogenicfluxes. However, the spatial adjustments required in the optimization differ significantly between the Hestia-optimized and the ODIAC-optimized cases (SI Appendix, Figure S7). Uncertainties associated with the ODIAC-optimized emissions decrease significantly from 8 MtC over the 3 years to less than 1 MtC, indicating a much higher confidence in the combined (inverse) estimates. In the absence of robust temporal error correlations over long time scales, we assumed that 5 day estimates are uncorrelated which, if not true, might affect the prior (increasing uncertainties) but also the error reduction (decreasing uncertainties). We also note here that sectoral information is not available for ODIAC, an important limitation for establishing mitigation policies. When high granularity from Hestia is available for the bottom-up flux constraint, the optimization indicates small space-specific adjustments (Figure 4, lower right). For example, negative emission adjustments are applied to the southwestern and eastern parts of the city for both sectors while an increase in emissions is observed in the downtown area and in the city outskirts for traffic emissions (cf.Figure 4, left panel). The measurement sites located near the negative flux adjustments sample primarily highway emissions which might be the cause of the spatial adjustment. The spatial adjustments in static sources suggest an overall decrease in the southeastern quadrant of the city where the population grew only by less than 5% (Census population
data), whereas the northern and western parts of the city experienced the largest population increase (>15% over 2000− 2016). The spatial differences might indicate that CO2 emissions have increased more rapidly in fast-developing areas (mostly suburban) since 2002 (i.e., the Hestia reference year for the spatial distribution).
The quality and amount of information collected to produce the Hestia CO2 emissions for Indianapolis, IN is unprece-dented, challenging to reproduce for many cities across the world. Assuming that lower-quality emission products will be available elsewhere, we explore the influence of the atmospheric constraint by increasing further the bias applied to the initial bottom-up flux constraint in Figure 5. As noted
previously, an initial bias of less than 20% resulted in a final flux adjustment of less than 2.5% over 3 years and within 16% for 5 day averages. Annually, the initial bottom-up constraint and thefinal optimized flux remain within 3% of each other. Based on this result, satellite-driven bottom-up estimates such as ODIAC provide sufficient precision to produce whole-city
Figure 4.Maps of 3 year adjustments in CO2emissions (in %) after optimization aggregated from September 2012 to September 2015 for the
mobile (left panel) and stationary (right panel) sectors with the measurement network (triangles). Hestia emissions were used as a priori emissions (first guess) in the CO2/CO optimization system.
Figure 5.Mismatch between adjusted emissions and Hestia estimates as a function of introduced bias in bottom-up flux constraint. Mismatches are represented by the mean absolute differences (in %) aggregated over 5 day, monthly, annual, and 3 year time periods.
CO2emissions at policy-relevant levels over most US cities.32 However, when the initial mismatch is larger (+40%), the atmospheric constraint is unable to adjust the optimizedflux to reach similar levels of agreement (now within 18%), even at monthly, annual, or 3 year time scales. More than half of the initial bias has been removed, but the disagreement (18%) remains larger than policy-relevant levels (defined as 2% per year, or 6% over 3 years). Other recent studies suggested city-scale uncertainties of about 60% (mean relative differences) over Poland and the northeastern US, too large to converge using satellite-derived emission prior in the current optimiza-tion system.7,40 We note here that even with a non-biased initial bottom-upflux constraint, 5 day and monthly estimates deviate by 14 and 8%, respectively, which may relate to errors in the atmospheric constraint or actual variability not accounted for in the Hestia bottom-up constraint. For large initial biases (here +40%), about 85% of the 5 day periods show an improvement and afifth of the 5 day periods show a close agreement (within 10%), with a median bias adjustment of −24% (Figure S8, SI Appendix). Despite the temporal aggregation over 1−3 years, a severely biased bottom-up constraint (here +40%) will not be fully corrected by the atmospheric constraint.
Atmospheric assimilation approaches, like any other optimization procedure, rely on specified uncertainties, both in thefluxes, boundary conditions, and in the transport model. With an improved atmospheric model built on meteorological data assimilation (Supporting Information),flux and boundary condition uncertainties likely remain the two dominant sources of uncertainty. Because biogenicfluxes are more uncertain than FFCO2emissions, even at the whole-city scale, the potential for convergence of FFCO2 is severely impacted by biosphere carbon exchange uncertainties during the growing season (summer adjustments are 50% weaker than wintertime adjustments in our bias-recovery experiments). Attribution to FFCO2 fluxes or biospheric carbon exchange in the optimization scheme is mostly dictated by the presence of distinct spatial patterns, as human activities and biosphere overlap only in suburban areas in Indianapolis, and by the assimilation of CO mixing ratios assuming negligible contribution from the biosphere. Here, optimized summer emissions between June and August remain in agreement with Hestia, and despite the presence of large biogenic fluxes, no incorrect adjustment has been observed (Figure 1). We performed an additional experiment by introducing a 15% bias in biogenic fluxes while preserving their spatial and temporal distributions. The atmospheric optimization propagates part of the bias to FFCO2 emissions due to misattribution of the signals, causing an underestimation of 7.5% at annual and 3-year time scales. Hence, careful estimation of biogenicfluxes is a prerequisite to urban FFCO2emission quantification, similar to findings for Boston, MA.17 For higher granularities (e.g., sectoral biases), we performed sector-specific experiments (SI Appendix, Figure S9). Sectoral perturbations of 15% were added to one of the two sectors. After optimization, biased traffic emissions were adjusted down (−12%), an overall improvement, counterbalanced by a decrease in stationary sources (−6%), a misattribution of the bias from the traffic sector. When perturbing the stationary sector, stationary sources are adjusted by 8% (reducing by half the bias) but mobile sources decreased by 12%, a similar misattribution of the bias from stationary sources. Sectoral attribution depends on the relative weights of uncertainties and deviates from the
original solution despite the assimilation of sector-specific tracers such as CO mixing ratios.27 We conclude here that additional tracers are required beyond CO to improve the attribution of sectoral biases.
In the light of our results, high-resolution bottom-up CO2 emission products similar to Hestia seem to provide necessary information for policy makers to establish mitigation strategies at the urban scale. However, important aspects to which atmospheric data provide complementary and timely informa-tion must be taken into account. Most metropolitan areas have no established policies for data access and often lack expertise to construct reliable emission products. In addition, fast-growing urban areas will require constant monitoring of sources as technologies and activities evolve rapidly while bottom-up products are delayed by data collection and changes in emission factors. Emission products like Hestia require a considerable amount of time and effort to compile and produce emission maps at high spatiotemporal resolution. Within the Indianapolis city boundaries, the direct emissions (Scope 1) from the city’s self-reported inventory (SRI) are 35% lower than our optimal emissions estimate for the year 2013.41Both non-CO2and indirect emissions were subtracted from the reported community emissions for this comparison. At the sectoral level, traffic and industries CO2emissions are lower by more than 40% and the utility sector (electricity production) is lower by 25%. An accurate portrayal of the emitting landscape is essential to prioritize mitigation choices. The implementation of effective climate policies on robust estimates is essential to reducing gradually CO2 emissions. Considering the mitigation strategy of the city, the 2025 target of the Thrive Indianapolis report aims at a reduction of 20% compared to the 2016 reported emissions, i.e., a change of less than 2% per year on average over the 10 year period. However, the systematic differences between the city SRI emissions and our optimal estimate remain too large to confirm the decrease in emissions by 2025 using the typical SRI methodology.
Due to limited information on soil organic carbon and above ground biomass, emission products currently exclude green carbon, while carbon storage is potentially a key player in offsetting carbon emissions from cities.42 Most importantly, bottom-up products have no guarantee of continuity over multiple years due to continuously evolving activities, a fundamental limitation in this approach when characterizing interannual variations on the order of a few percent. By assimilating atmospheric measurements into the information system, timely information with long-term calibration will help preserve the monitoring of all activities across the urban area and over years, including the green fraction, in combination with available bottom-up products despite potential gaps in activity data or emission factors. Current and future deploy-ments of eddy-covariance flux towers will provide critical measurements to calibrate and evaluate biogenic fluxes over urban areas. The density and locations of atmospheric stations remain dependent on the city characteristics (e.g., urban area extent, urban development, topographical features), but high density is desirable to map each district and sector of the area.19Technological advances in instrument techniques is key to increase the number of sensors produced at lower costs,43 hence to reach sufficient coverage to provide, in association with bottom-up emission products, policy-relevant information for local governments and the private sector over most major metropolitan areas of the world.
This atmosphere monitoring/bottom-up integrated system over Indianapolis sheds light on the potential of atmospheric and information science to help quantify city FFCO2emissions but also to identify possible discrepancies at fine scales, i.e., seasonally, sectorally, and interannually. Constraining urban emissions at short time scales (submonthly) remain challeng-ing with largely unexplained variations in 5 day means and a limited convergence at a high temporal frequency, as revealed by perturbation experiments. However, annual biases of whole-city emissions at the current level of mitigation policies seem attainable by combining granular bottom-up data products with atmospheric measurement approaches. Typical emission trends observed during the last decade are at the order of a few percent a year (2% per year achieved for the top third of C40 cities). With an optimal detection potential of 3−4% of the net FFCO2emissions annually (about 2% over 3 years), less than 5 years will be enough to confirm the reported changes with relatively high confidence. Similarly, fast-developing economies with annual growth rates in GDP of 6% or higher, assuming CO2emissions will grow at a similar rate, become even more measurable than trends in current reduction policy trends, measurable in less than 3 years. Going beyond the whole-city trends, decision makers will require higher granularity spatially and/or sectorally, to most efficiently target reduction measures. The current system includes CO mixing ratios to support the deconvolution of atmospheric signals into sectoral contribu-tions.27 Convergence in the stationary sources is weaker (converging from 40 to 29%) compared to mobile sources (from 40 to 23%), and 5 day standard deviation of sectoral emissions is about 26%, similar to whole-city emissions. This result suggests that whole-city sectoral changes are more difficult to capture with an atmosphere-only approach. Spatial attribution remains informative despite its sensitivity to uncertain error structures and will still require additional methodological development and improved uncertainty estimation before achieving the full potential of the integrated atmospheric/bottom-up optimization systems.
■
ASSOCIATED CONTENT*
sı Supporting InformationThe Supporting Information is available free of charge at
https://pubs.acs.org/doi/10.1021/acs.est.0c00343.
The observations and the inverse modeling systems are described in details, with complementary sensitivity experiments (PDF)
■
AUTHOR INFORMATIONCorresponding Author
Thomas Lauvaux − Laboratoire des Sciences du Climat et de l’Environnement, CEA, CNRS, UVSQ/IPSL, Université Paris-Saclay, Orme des Merisiers, 91191 Gif-sur-Yvette Cedex, France; Department of Meteorology and Atmospheric Science, The Pennsylvania State University, University Park,
Pennsylvania 16802, United States; orcid.org/0000-0002-7697-742X; Phone: +33 1 69 08 49 18;
Email:thomas.lauvaux@lsce.ipsl.fr; Fax: +33 1 69 08 77 16
Authors
Kevin R. Gurney− School of Informatics, Computing, and Cyber Systems, Northern Arizona University, Flagstaff, Arizona 86011, United States; orcid.org/0000-0001-9218-7164
Natasha L. Miles− Department of Meteorology and Atmospheric Science, The Pennsylvania State University, University Park, Pennsylvania 16802, United States Kenneth J. Davis− Department of Meteorology and
Atmospheric Science, The Pennsylvania State University, University Park, Pennsylvania 16802, United States Scott J. Richardson− Department of Meteorology and
Atmospheric Science, The Pennsylvania State University, University Park, Pennsylvania 16802, United States Aijun Deng− Utopus Insights, Valhalla, New York 10595,
United States
Brian J. Nathan − OSU Pytheas, Institut Méditerranéen de Biodiversité et d’Ecologie Marine et Continentale, Aix-Marseille Université, Aix-en-Provence 13013 Marseille, France
Tomohiro Oda− Global Modeling and Assimilation Office, NASA Goddard Space Flight Center, Greenbelt, Maryland 20771, United States; Goddard Earth Sciences Technology and Research, Universities Space Research Association, Columbia, Maryland 21046, United States; orcid.org/0000-0002-8328-3020
Jonathan A. Wang− University of California Irvine, Irvine, California 92697, United States
Lucy Hutyra− Boston University, Boston, Massachusetts 02215, United States
Jocelyn Turnbull − Rafter Radiocarbon Laboratory, GNS Science, Lower Hutt 5040, New Zealand; CIRES, University of Colorado at Boulder, Boulder, Colorado 80309, United States;
orcid.org/0000-0002-0306-9658
Complete contact information is available at:
https://pubs.acs.org/10.1021/acs.est.0c00343 Notes
The authors declare no competingfinancial interest.
■
ACKNOWLEDGMENTSThe authors thank Maria O. Cambaliza, Anna Karion, Douglas K. Martins, Colm Sweeney, Isaac Vimont for instrumenting, maintaining, and analyzing atmospheric data during the INFLUX project; Bernd J. Haupt for data acquisition and quality control; Brian Gaudet for his expertise in WRF modeling; Jianhua Huang, Darragh O’Keefe, and Yang Song for their contribution to the Hestia product; Paul Shepson and James Whetstone for helpful discussion. The atmospheric measurements of CO2 and CO greenhouse gas mixing ratios (https://doi.org/10.18113/d37g6p) and the inverse model footprints (https://doi.org/10.26208/a95d-cm52) are publicly available at the PennState Data Commons. This work has been funded by the National Institute for Standards and Technology (Project 70NANB10H245) and the National Oceanic and Atmospheric Administration (Grant NA13OAR4310076). T.L. was also supported by the French research program Make Our Planet Great Again (Project CIUDAD).
■
ADDITIONAL NOTES a h t t p s : / / t r e a t i e s . u n . o r g / d o c / T r e a t i e s / 2 0 1 6 / 0 2 / 20160215%2006-03%20PM/Ch_XXVII-7-d.pdf. b https://www.c40.org/. c2017 US Census Bureau.■
REFERENCES(1) Le Quéré, C.; Andrew, R. M.; Friedlingstein, P.; Sitch, S.; Hauck, J.; Pongratz, J.; Pickers, P. A.; Korsbakken, J. I.; Peters, G. P.; Canadell, J. G.; Arneth, A.; Arora, V. K.; Barbero, L.; Bastos, A.; Bopp, L.; Chevallier, F.; Chini, L. P.; Ciais, P.; Doney, S. C.; Gkritzalis, T.; Goll, D. S.; Harris, I.; Haverd, V.; Hoffman, F. M.; Hoppema, M.; Houghton, R. A.; Hurtt, G.; Ilyina, T.; Jain, A. K.; Johannessen, T.; Jones, C. D.; Kato, E.; Keeling, R. F.; Goldewijk, K. K.; Landschützer, P.; Lefèvre, N.; Lienert, S.; Liu, Z.; Lombardozzi, D.; Metzl, N.; Munro, D. R.; Nabel, J. E. M. S.; Nakaoka, S.-I.; Neill, C.; Olsen, A.; Ono, T.; Patra, P.; Peregon, A.; Peters, W.; Peylin, P.; Pfeil, B.; Pierrot, D.; Poulter, B.; Rehder, G.; Resplandy, L.; Robertson, E.; Rocher, M.; Rödenbeck, C.; Schuster, U.; Schwinger, J.; Séférian, R.; Skjelvan, I.; Steinhoff, T.; Sutton, A.; Tans, P. P.; Tian, H.; Tilbrook, B.; Tubiello, F. N.; van der Laan-Luijkx, I. T.; van der Werf, G. R.; Viovy, N.; Walker, A. P.; Wiltshire, A. J.; Wright, R.; Zaehle, S.; Zheng, B. Global Carbon Budget 2018. Earth Syst. Sci. Data 2018, 10, 2141−2194.
(2) Seto, K.; Dhakal, S.; Bigio, A.; Blanco, H.; Delgado, G.; Dewar, D.; Huang, L.; Inaba, A.; Kansal, A.; Lwasa, S.; McMahon, J.; Müller, D.; Murakami, J.; Nagendra, H.; Ramaswami, A. Climate Change 2014: Mitigation of Climate Change. IPCC Working Group III Contribution to AR5; Cambridge University Press, 2014.
(3) Creutzig, F.; Baiocchi, G.; Bierkandt, R.; Pichler, P.-P.; Seto, K. C. Global typology of urban energy use and potentials for an urbanization mitigation wedge. Proc. Natl. Acad. Sci. U.S.A. 2015, 112, 6283−6288.
(4) United Nations. Department of Economic and Social Affairs, Population Division (ST/ESA/SER.A/423), World Population Prospects 2019: Highlights; 2019.
(5) Mitchell, L. E.; Lin, J. C.; Bowling, D. R.; Pataki, D. E.; Strong, C.; Schauer, A. J.; Bares, R.; Bush, S. E.; Stephens, B. B.; Mendoza, D.; Mallia, D.; Holland, L.; Gurney, K. R.; Ehleringer, J. R. Long-term urban carbon dioxide observations reveal spatial and temporal dynamics related to urban characteristics and growth. Proc. Natl. Acad. Sci. U.S.A. 2018, 115, 2912−2917.
(6) Hsu, A.; Höhne, N.; Kuramochi, T.; Roelfsema, M.; Weinfurter, A.; Xie, Y.; Lütkehermöller, K.; Chan, S.; Corfee-Morlot, J.; Drost, P.; Faria, P.; Gardiner, A.; Gordon, D. J.; Hale, T.; Hultman, N. E.; Moorhead, J.; Reuvers, S.; Setzer, J.; Singh, N.; Weber, C.; Widerberg, O. A research roadmap for quantifying non-state and subnational climate mitigation action. Nat. Clim. Change 2019, 9, 11−17.
(7) Gately, C. K.; Hutyra, L. R. Large Uncertainties in Urban-Scale Carbon Emissions. J. Geophys. Res.: Atmos. 2017, 122, 11,242−11,260. (8) Li, M.; Zhang, D.; Li, C.-T.; Mulvaney, K. M.; Selin, N. E.; Karplus, V. J. Air quality co-benefits of carbon pricing in China. Nat. Clim. Change 2018, 8, 398−403.
(9) Hutyra, L. R.; Duren, R.; Gurney, K. R.; Grimm, N.; Kort, E. A.; Larson, E.; Shrestha, G. Urbanization and the carbon cycle: Current capabilities and research outlook from the natural sciences perspective. Earth’s Future 2014, 2, 473−495.
(10) Keeling, C. D.; Piper, S. C.; Bacastow, R. B.; Wahlen, M.; Whorf, T. P.; Heimann, M.; Meijer, H. A. A History of Atmospheric CO2and its Effects on Plants, Animals, and Ecosystems; Springer Verlag:
New York, 2005.
(11) Nisbet, E.; Weiss, R. Top-Down Versus Bottom-Up. Science 2010, 328, 1241−1243.
(12) Kort, E. A.; Frankenberg, C.; Miller, C. E.; Oda, T. Space-based observations of megacity carbon dioxide. Geophys. Res. Lett. 2012, 39, No. L17806.
(13) Turnbull, J. C.; Karion, A.; Davis, K. J.; Lauvaux, T.; Miles, N. L.; Richardson, S. J.; Sweeney, C.; McKain, K.; Lehman, S. J.; Gurney, K. R.; Patarasuk, R.; Liang, J.; Shepson, P. B.; Heimburger, A.; Harvey, R.; Whetstone, J. Synthesis of Urban CO2Emission Estimates
from Multiple Methods from the Indianapolis Flux Project (INFLUX). Environ. Sci. Technol. 2019, 53, 287−295.
(14) McKain, K.; Down, A.; Raciti, S. M.; Budney, J.; Hutyra, L. R.; Floerchinger, C.; Herndon, S. C.; Nehrkorn, T.; Zahniser, M. S.; Jackson, R. B.; Phillips, N.; Wofsy, S. C. Methane emissions from
natural gas infrastructure and use in the urban region of Boston, Massachusetts. Proc. Natl. Acad. Sci. U.S.A. 2015, 112, 1941−1946.
(15) Staufer, J.; Broquet, G.; Bréon, F.-M.; Puygrenier, V.; Chevallier, F.; Xueref-Rémy, I.; Dieudonné, E.; Lopez, M.; Schmidt, M.; Ramonet, M.; Perrussel, O.; Lac, C.; Wu, L.; Ciais, P. The first 1-year-long estimate of the Paris region fossil fuel CO2emissions based
on atmospheric inversion. Atmos. Chem. Phys. 2016, 16, 14703− 14726.
(16) Lauvaux, T.; Miles, N. L.; Deng, A.; Richardson, S. J.; Cambaliza, M. O.; Davis, K. J.; Gaudet, B.; Gurney, K. R.; Huang, J.; O’Keefe, D.; Song, Y.; Karion, A.; Oda, T.; Patarasuk, R.; Razlivanov, I.; Sarmiento, D.; Shepson, P.; Sweeney, C.; Turnbull, J.; Wu, K. High resolution atmospheric inversion of urban CO2emissions during the
dormant season of the Indianapolis Flux Experiment (INFLUX). J. Geophys. Res.: Atmos. 2016, 121, 5213−5236.
(17) Sargent, M.; Barrera, Y.; Nehrkorn, T.; Hutyra, L. R.; Gately, C. K.; Jones, T.; McKain, K.; Sweeney, C.; Hegarty, J.; Hardiman, B.; Wang, J. A.; Wofsy, S. C. Anthropogenic and biogenic CO2fluxes in
the Boston urban region. Proc. Natl. Acad. Sci. U.S.A. 2018, 115, 7491−7496.
(18) Newman, S.; Xu, X.; Gurney, K. R.; Hsu, Y. K.; Li, K. F.; Jiang, X.; Keeling, R.; Feng, S.; O’Keefe, D.; Patarasuk, R.; Wong, K. W.; Rao, P.; Fischer, M. L.; Yung, Y. L. Toward consistency between trends in bottom-up CO2 emissions and top-down atmospheric
measurements in the Los Angeles megacity. Atmos. Chem. Phys. 2016, 16, 3843−3863.
(19) Davis, K. J.; Deng, A.; Lauvaux, T.; Miles, N. L.; Richardson, S. J.; Sarmiento, D. P.; Gurney, K. R.; Hardesty, R. M.; Bonin, T. A.; Brewer, W. A.; Lamb, B. K.; Shepson, P. B.; Harvey, R. M.; Cambaliza, M. O.; Sweeney, C.; Turnbull, J. C.; Whetstone, J.; Karion, A. The Indianapolis Flux Experiment (INFLUX): A test-bed for developing urban greenhouse gas emission measurements. Elementa: Sci. Anthropocene 2017, 5, No. 21.
(20) Miles, N. L.; Richardson, S. J.; Lauvaux, T.; Davis, K. J.; Balashov, N. V.; Deng, A.; Turnbull, J.; Sweeney, C.; Gurney, K. R.; Patarasuk, R.; Razlivanov, I.; Cambaliza, M. O. L.; Shepson, P. Quantification of urban atmospheric boundary layer greenhouse gas dry mole fraction enhancements: Results from the Indianapolis Flux Experiment (INFLUX). Elementa: Sci. Anthropocene 2017, 5, No. 27. (21) Gurney, K. R.; Razlivanov, I.; Song, Y.; Zhou, Y.; Benes, B.; Abdul-Massih, M. Quantification of Fossil Fuel CO2Emissions on the
Building/Street Scale for a Large U.S. City. Environ. Sci. Technol. 2012, 46, 12194−12202.
(22) Wu, K.; Lauvaux, T.; Davis, K. J.; Deng, A.; Lopez Coto, I.; Gurney, K. R.; Patarasuk, R. Joint inverse estimation of fossil fuel and biogenic CO2fluxes in an urban environment: An observing system
simulation experiment to assess the impact of multiple uncertainties. Elementa: Sci. Anthropocene 2018, 6, No. 17.
(23) Deng, A.; Lauvaux, T.; Davis, K. J.; Gaudet, B. J.; Miles, N.; Richardson, S. J.; Wu, K.; Sarmiento, D. P.; Hardesty, R. M.; Bonin, T. A.; Brewer, W. A.; Gurney, K. R. Toward reduced transport errors in a high resolution urban CO2 inversion system. Elementa: Sci.
Anthropocene 2017, 5, No. 20.
(24) Skamarock, W. C.; Klemp, J. B. A time-split nonhydrostatic atmospheric model for weather research and forecasting applications. J. Comput. Phys. 2008, 227, 3465−3485.
(25) Uliasz, M. Environmental Modelling II; Computational Mechanics Publications: Southampton, U.K., 1994; pp 71−102.
(26) Turnbull, J. C.; Sweeney, C.; Karion, A.; Newberger, T.; Lehman, S. J.; Tans, P. P.; Davis, K. J.; Lauvaux, T.; Miles, N. L.; Richardson, S. J.; Cambaliza, M. O.; Shepson, P. B.; Gurney, K.; Patarasuk, R.; Razlivanov, I. Toward quantification and source sector identification of fossil fuel CO2emissions from an urban area: Results
from the INFLUX experiment. J. Geophys. Res.: Atmos. 2015, 120, 292−312.
(27) Nathan, B.; Lauvaux, T.; Turnbull, J.; Richardson, S.; Miles, N.; Gurney, K. Source Sector Attribution of CO2 Emissions Using an
Urban CO/CO2Bayesian Inversion System. J. Geophys. Res.: Atmos.
(28) Rella, C. W.; Chen, H.; Andrews, A. E.; Filges, A.; Gerbig, C.; Hatakka, J.; Karion, A.; Miles, N. L.; Richardson, S. J.; Steinbacher, M.; Sweeney, C.; Wastine, B.; Zellweger, C. High accuracy measurements of dry mole fractions of carbon dioxide and methane in humid air. Atmos. Meas. Techn. 2013, 6, 837−860.
(29) Richardson, S.; Miles, N.; Davis, K.; Lauvaux, T.; Martins, D.; Turnbull, J.; McKain, K.; Sweeney, C.; Cambaliza, M. Tower measurement network of in-situ CO2, CH4, and CO in support of
the Indianapolis FLUX (INFLUX) Experiment. Elementa: Sci. Anthropocene 2017, 5, No. 59.
(30) Chen, H.; Karion, A.; Rella, C. W.; Winderlich, J.; Gerbig, C.; Filges, A.; Newberger, T.; Sweeney, C.; Tans, P. P. Accurate measurements of carbon monoxide in humid air using the cavity ring-down spectroscopy (CRDS) technique. Atmos. Meas. Techn. 2013, 6, 1031−1040.
(31) Tans, P. P.; Crotwell, A. M.; Thoning, K. W. Abundances of isotopologues and calibration of CO2greenhouse gas measurements.
Atmos. Meas. Techn. 2017, 10, 2669−2685.
(32) Gurney, K. R.; Liang, J.; O’Keeffe, D.; Patarasuk, R.; Hutchins, M.; Huang, J.; Rao, P.; Song, Y. Comparison of Global Downscaled Versus Bottom-Up Fossil Fuel CO2Emissions at the Urban Scale in
Four U.S. Urban Areas. J. Geophys. Res.: Atmos. 2019, 124, 2823− 2840.
(33) Vimont, I. J.; Turnbull, J. C.; Petrenko, V. V.; Place, P. F.; Karion, A.; Miles, N. L.; White, J. W. C.; et al. Carbon monoxide isotopic measurements in Indianapolis constrain urban source isotopic signatures and support mobile fossil fuel emissions as the dominant wintertime CO source. Elementa: Sci. Anthropocene 2017, 5, No. 63.
(34) Oda, T.; Maksyutov, S.; Andres, R. J. The Open-source Data Inventory for Anthropogenic CO2, version 2016 (ODIAC2016): a
global monthly fossil fuel CO2 gridded emissions data product for
tracer transport simulations and surface flux inversions. Earth Syst. Sci. Data 2018, 10, 87−107.
(35) Mahadevan, P.; Wofsy, S. C.; Matross, D. M.; Xiao, X.; Dunn, A. L.; Lin, J. C.; Gerbig, C.; Munger, J. W.; Chow, V. Y.; Gottlieb, E. W. A satellite-based biosphere parameterization for net ecosystem CO2 exchange: Vegetation Photosynthesis and Respiration Model
(VPRM). Glob. Biogeochem. Cycles 2008, 22, No. GB2005.
(36) Homer, C.; Dewitz, J.; Yang, L.; Jin, S.; Danielson, P.; Xian, G.; Coulston, J.; Herold, N.; Wickham, J.; Megown, K. Completion of the 2011 National Land Cover Database for the Conterminous United States Representing a Decade of Land Cover Change Information. Photogramm. Eng. Remote Sens. 2015, 81, 345−354.
(37) Hilton, T. W.; Davis, K. J.; Keller, K. Evaluating terrestrial CO2
flux diagnoses and uncertainties from a simple land surface model and its residuals. Biogeosciences 2014, 11, 217−235.
(38) Hardiman, B. S.; Wang, J. A.; Hutyra, L. R.; Gately, C. K.; Getson, J. M.; Friedl, M. A. Accounting for urban biogenic fluxes in regional carbon budgets. Sci. Total Environ. 2017, 592, 366−372.
(39) Quick, J. C.; Marland, E. Systematic error and uncertain carbon dioxide emissions from U.S. power plants. J. Air Waste Manage. Assoc. 2019, 69, 646−658.
(40) Oda, T.; Bun, R.; Kinakh, V.; Topylko, P.; Halushchak, M.; Marland, G.; Lauvaux, T.; Jonas, M.; Maksyutov, S.; Nahorski, Z.; Lesiv, M.; Danylo, O.; Horabik-Pyzel, J. Errors and uncertainties in a gridded carbon dioxide emissions inventory. Mitigation Adapt. Strategies Glob. Change 2019, 24, 1007−1050.
(41) City of Indianapolis and Marion County, Indianapolis Greenhouse Gas Emission Inventory Report for 2010, 2013, and 2016; 2018, Vol. FY10−11.
(42) Churkina, G.; Brown, D. G.; Keoleian, G. Carbon stored in human settlements: the conterminous United States. Glob. Change Biol. 2010, 16, 135−143.
(43) Kim, J.; Shusterman, A. A.; Lieschke, K. J.; Newman, C.; Cohen, R. C. The Berkeley Atmospheric CO2Observation Network:
field calibration and evaluation of low-cost air quality sensors. Atmos. Meas. Techn. 2018, 11, 1937−1946.