HAL Id: hal-01933423
https://hal.archives-ouvertes.fr/hal-01933423
Submitted on 23 Nov 2018HAL is a multi-disciplinary open access archive for the deposit and dissemination of sci-entific research documents, whether they are pub-lished or not. The documents may come from teaching and research institutions in France or abroad, or from public or private research centers.
L’archive ouverte pluridisciplinaire HAL, est destinée au dépôt et à la diffusion de documents scientifiques de niveau recherche, publiés ou non, émanant des établissements d’enseignement et de recherche français ou étrangers, des laboratoires publics ou privés.
Mitochondrial DNA sequence diversity in two groups of
Italian Veneto speakers from Veneto
N. Mogentale-Profizi, L. Chollet, A. Stevanovitch, V. Dubut, C. Poggi, M.
Pradie, J. Spadoni, A. Gilles, E. Beraud-Colomb
To cite this version:
N. Mogentale-Profizi, L. Chollet, A. Stevanovitch, V. Dubut, C. Poggi, et al.. Mitochondrial DNA sequence diversity in two groups of Italian Veneto speakers from Veneto. Annals of Human Genetics, Wiley, 2001, 65 (2), pp.153 - 166. �10.1046/j.1469-1809.2001.6520153.x�. �hal-01933423�
Ann. Hum. Genet. (2001), 65, 153–166
Printed in Great Britain
153
Mitochondrial DNA sequence diversity in two groups of Italian Veneto
speakers from Veneto
N. MOGENTALE-PROFIZI", L. CHOLLET", A. STE!VANOVITCH#, V. DUBUT", C. POGGI", M. P. PRADIE!", J. L. SPADONI#, A. GILLES$ E. BE!RAUD-COLOMB#
" DeTpartement de Biologie MoleTculaire, Centre Hospitalier de Toulon-La Seyne, BP 1412, 83056
Toulon Cedex, France
# ADN mitochondrial et populations, Case 901, 163 Avenue de Luminy, 13288 Marseille Cedex 09,
France. Present address : U387 INSERM, Laboratoire d’Immunologie, HoV pital Sainte Marguerite, BP29, 13274 Marseille Cedex 09, France
$ EA biodiversiteT 2202, Laboratoire d’Hydrobiologie, UniversiteT de Provence, 1 Place Victor Hugo,
13331 Marseille Cedex 03, France
(Received 10.8.00. Accepted 15.12.00)
Although frequencies of mitochondrial DNA (mtDNA) haplogroups in the different European populations are rather homogenous, there are a few European populations or linguistic isolates that show different mtDNA haplogroup distributions ; examples are the Saami and Ladin speakers from the eastern Italian Alps.
MtDNA sequence diversity was analysed from subjects from two villages in Veneto. The first, Posina, is situated in the Venetian Alps near Vicenza. The second, Barco di Pravisdomini is a village on the plains near Venice. In spite of their common Veneto dialect, the two group populations have not preserved a genetic homogeneity ; particularly, they show differences in T and J haplogroups frequencies. MtDNA diversity in these two groups seems to depend more on their geographic situation.
In many studies of extant human populations, variations in gene frequency have been attri-buted to the geographic distance between popu-lations (reviewed in Wijsman & Cavalli-Sforza, 1984). Although some extensive gene frequency gradients seem to be due to directional gene flow (Menozzi et al. 1978 ; Sokal & Menozzi, 1982 ; Ammerman & Cavalli-Sforza, 1984 ; Rendine et
al. 1986), other gene frequency patterns simply cannot be explained by a major migratory movement. Different selective pressures or iso-lation factors must also be considered (Slatkin, 1975 ; Piazza et al. 1981 ; Slatkin, 1985 ; Piazza et
al. 1988 ; Barbujani & Sokal, 1991 a). In
par-Correspondence : Dr Eliane Be! raud-Colomb. Fax: (33) 04-91-75-23-28.
E-mail : beraud!marseille.inserm.fr
ticular, several authors have noted a positive correlation between genetic and linguistic characteristics for different groups (Livingstone, 1963). This phenomenon is found in Italy where a great genetic heterogeneity occurs throughout the various regions, and where genes and languages have a similar geographical distri-bution when taking into account the ten major Italian dialects (Barbujani & Sokal, 1991 b). In fact, the genetic structure of the modern Italian population could probably be deduced from pre-Roman gene frequency data alone (Piazza et al. 1988). In some cases it has been suggested that history left tracks in different gene frequencies.
The vast majority of present-day European mitochondrial DNA (mtDNA) sequences, ac-cording to mtDNA markers, can be classified into ten haplogroups (H, I, J, K, M, T, U, V, W, X) (Torroni et al. 1996). In addition, mtDNA
154
N. M
-P
sequences from Europe generally exhibit a very low diversity compared to sequences from other continents. There are some exceptions, however. High mtDNA sequence diversity has been observed in the Saami, and a few populations or groups that include the Ladin. The Ladin-speaking populations studied by Stenico et al. (1996) are linguistic isolates from the Italian Alps. German and Italian linguistic groups from the Italian Alps in the administrative region of Trentino-Alto Adige were also studied (Stenico et
al. 1996). The mitochondrial sequence diversity exhibited by the two groups of Ladin speakers was different from that of other linguistic groups. The particular patterns of diversity observed in these Alpine isolates are probably due to their historical geographic isolation, the Ladin com-munity of Val Gardena being the most differen-tiated.
In this study, we report on the distribution of mtDNA haplogroups in two groups of Veneto-speaking Italians : the first inhabiting Posina and the second Barco, in Veneto. Posina is in an isolated mountainous area, between Trento and Vicenza, whereas Barco is situated on the plains, near Venice. This study reveals a difference in the mtDNA sequence diversity patterns of these two Veneto-speaking groups, manifested as a difference in the differential distributions of haplotypes belonging to the J and T haplogroups. The population from Posina presents a similar diversity to the Ladin-speaking populations from Val Gardena and Colle Santa Lucia.
, History
Veneto owes its name to the Venetians, a population whose paleovenetian civilisation flourished on the territory of the three Venetia (Trentino-Alto Adige, Veneto and Friuli-Venezia Giulia) from the dawn of the Iron age in 1000 before Christ (..) to the end of the second century .. Called Henetes by the Greeks and mentioned by Homer in the Iliad, this population is said to have come from Asia Minor after the Trojan war in the thirteenth century.., and to
have brought an iron age culture with them. The Venetians landed on the shores of the Adriatic where they drove out the Euganei, who then took refuge in the mountains. The Euganei were a group of people who could have belonged to the Rhaetii, an unclearly defined P.M. historic people co-existing with the Ligures in the western valleys (Chieco Bianchi, 1988).
The Venetian tribes spread out in the territory now known as Veneto, with the exception of the Veronese and the Trentino who were Rhaetii. The Friuli was less intensely populated by Venetians and most of this region was occupied by the Carni, of Celtic origin. There are other historic references to the name Venetian in places other than Veneto, for instance in Central Europe as far as the shores of the Baltic, and on the Atlantic coast of Brittany (in Breton dialect Vannes is gwened and means Venetian). For linguists and archaeologists (Prosdocimi, 1978), the word Venetian is synonymous with Indo-European. The Venetians of Veneto represent an Indo-European strain.
The Etruscans, from central Italy, comprised an advanced civilization which lasted from the twelfth to fifth centuries.. However, the great expansion of Etruscans, extending from southern Italy to the Po valley in the north, could not have reached the region inhabited by the Venetians (Livio). The Celts, whom the Romans called ‘ Gauls ’, arrived in Padania at the end of the fifth century .. These people occupied Central and Northern Europe before the Romans extended their domination further north, ar-riving from Switzerland, Austria and South-West-Germany. The Venetians, without sub-mitting to them, were culturally and artistically influenced by the Gauls, and vice-versa. This progressive influence of Roman ways on the Venetians lasted from the second century .. until the fall of the Roman Empire (second–fifth century ..).
Numerous archaeological sites confirm the presence of paleovenetians in Veneto since around the end of the second millennium .. Many archaeological sites (Broglio, 1987) how-ever, have revealed the existence of human
mtDNA diversity in Veneto speakers
155
Fig. 1. Map of the three main regions in Venetia. Note : The shaded area in the map of Italy indicates the administrative region Veneto. The striped area in the map of Italy indicates the administrative region Tuscany., Villages studied by Stenico et al (Stenico et al. 1998). Ladin-speaking samples: LG, Selva Val Gardena Wolkenstein, LC, Colle Santa Lucia ; LF, Fassa and LB, Badia.4, The two Veneto-speaking samples, Posina and Barco.
habitations in the Euganei Venetian territory since the upper Paleolithic period (35 000–10 000 years).
Subjects
Subjects for this study were volunteers, coming from two villages in Veneto, Italy (Fig. 1). Herein, we report the distribution of mtDNA haplogroups in these two Italian Veneto-speak-ing groups : the first inhabitVeneto-speak-ing Veneto at Posina in the west, and the second from Barco di Pravisdomini in the east. Veneto is located between the northern shores of the Adriatic sea and the foothills of the Dolomites in the Eastern Alps. It is bordered by Friuli-Venezia Giulia to the east, Lombardy to the west, Trentino-Alto Adige to the north west, Emilia Romagna to the
south and Austria to the far North. Venice is the capital of Veneto. Posina is situated in a valley at the foot of Pasubio in the Venetian Prealps, 50 km to the south of Trento. It is a village neighbouring the North Eastern valley of the Eastern Alps where Ladin (Stenico et al. 1996) is still spoken. The valley where Posina is found, in former times, provided the passage between Trento and the plain (Dalla Via, 1993). Barco di Pravisdomini and the neighbouring villages in the Veneto area (Meduna, Annone Veneto) are the villages of the plains, 50 km east of Venice, opposite Posina at the extremity of Veneto and adjoining Friuli-Venezia Giulia.
Sixty-eight individuals were studied, 38 coming from Posina and the 30 other individuals from Barco. Subjects were maternally unrelated individuals. All grandmothers of these
indi-156
N. M
-P
Table 1. Primers used for partial PCR amplification of Veneto mtDNAs Haplogroup
Amplified region position
(primers position)a Polymorphic restriction site
H 06890–07131 7025 AluI (06890–06910 ; 07131–07110) U 12104–12342 12308 HinfI (12104–12127 ; 12342–12315) [nt 12308G] K 08829–09184 9052 HaeII (08829–08845 ; 09184–09163) K 12104–12342 12308 HinfI (12104–12127 ; 12342–12315) [nt 12308G] T 15409–15701 15606 AluI (15409–15428 ; 15701–15682) V 04308–04739 4577 NlaIII (04308–04225 ; 04739–04719) [nt 4580A] PreV, V 14668–14919 14766 MseI (14668–14687 ; 14919–14900) [nt14766C] W 08829–09184 8994 HaeIII (08829–08845 ; 09184–09163) X 01615–01894 1715 DdeI (01615–01643 ; 01894–01874) X 14430–14614 14465 AccI (14430–14452 ; 14614–14590) J 10270–10579 10394 DdeI (10270–10290 ; 10579–10557) I 01615–01894 1715 DdeI (01615–01643 ; 01894–01874) I 09910–10107 10032 AluI (09910–09932 ; 10107–10089) L 03388–03717 3592 HpaI (03388–03408 ; 03717–03701)
a Primers are numbered according to Anderson et al. (1981) with 5h-3h coordinates before the comma corresponding
to the forward primers and those after the comma to the reverse primers.
viduals were born respectively in Posina or in Barco.
DNA extraction
DNA was extracted from Peripheral Blood Mononuclear Cells (PBMC) or hair roots. The entire DNA was extracted by QIAamp DNA Blood Mini Kit (QIAGEN).
mtDNA analysis
Hypervariable segments (HVS-1 and HVS-2) of the Control Regions (CR) of mtDNAs were directly amplified by polymerase chain reaction (PCR). HVS-1 was amplified from np 16025 to np 16431. The primers used are L16025 5h-TCTTT-CATGGGGAAGCAGATTT-3h (light chain, nps 16025–16046) and H16410 5h-GTGCGGGATAT-TGATTTCAC-3h (heavy chain, nps 16431– 16411). PCR was conducted as follows : denaturation at 94mC for 1 min, annealing at 55mC for 1 min and extension at 72 mC for 1 min,
repeated for 35 cycles. HVS-2 was amplified as described elsewhere (Macaulay et al. 1999) from np 008 to np 248. The primers used are HV2 S : 5h-GGTCTATCACCCTATTAACCAC-3h (light chain, nps 00008–00029) and HV2 AS : 5h-TCAATTGTTATTATTATGTCCTACAA-3h (heavy chain, nps 00248–00223), with identical PCR conditions.
After purification of PCR products (QIAquick PCR Purification Kit, QIAGEN), only light strands of HVS-1 and HVS-2 were sequenced by use of ABI Prism BigDye Terminator Cycle Sequencing Ready Reaction Kit (Perkin Elmer) using respectively primers L16025 and HV2 S : denaturation at 98mC for 10 s, annealing at 55 mC for 10 s and extension at 60mC for 10 s, repeated for 35 cycles.
According to Torroni et al. (1996) and Macaulay et al. (1999), the relevant polymor-phic restriction sites analysed were reported in Table 1.
mtDNA diversity in Veneto speakers
157
Database analysisSequence polymorphisms in regions HVS-1 and HVS-2 of the D-Loop from the Barco (Table 2) and Posina (Table 3) samples were compared to other samples from the HVR base (Burkhardt
et al. 1999), including samples from seven villages from Venetia and Trento-Alto Adige (Stenico et
al. 1996) and samples from Tuscany (Francalacci
et al. 1996). Haplogroups were determined using classifications described by Torroni (Torroni et
al. 1996 ; Macaulay et al. 1999) and Richards (Richards et al. 1996) (Table 4). In some populations from the HVR base, differences between I and W haplogroups, as well as differences between H and U haplogroups, were unresolvable due to the absence of RFLP analysis in reference data.
Statistical analysis
The DNA sequences were aligned using Clustal X ver. 1.81. (Thompson et al. 1994). MEGA program was employed to identify each haplo-type using the complete deletion option with no assumption of traditional haplotypes definition. By this method, 309 sites were seen to be conserved (for the 167 individuals), representing 119 different haplotypes.
The population genetic structure was analysed using AMOVA (Excoffier et al. 1992) and F statistics (Weir & Cockerham, 1984) of six various populations using Arlequin 1.1 program (Schneider et al. 2000). An exact test of popu-lation differentiation was performed using a Markov chain with 1000 iterations. Tamura and Nei distance option was selected because of the differences in the transition and transversion rates and the bias in nucleotide composition (C, 34.4 % ; T, 21.3 % ; A, 34.9 % ; G, 9.4 %).
A Phenogram based on the six populations using Fst values and the Neighbour-Joining (NJ) (Saitou & Nei, 1987) clustering algorithm was done. A European control population (Bulgarian) was included as an outgroup to remove the possible artefacts due to the very closed location (the maximum distance between the populations was 200 km) and the small size of Ladin-speaking
populations (LC, LG). The tree was rooted on the Bulgarian population. An UPGMA tree was also done using the same matrix, but the topology was not statistically different : therefore, only the NJ tree was considered.
Control region data
Sequences for the two segments of the hyper-variable region of the mtDNA D-loop were determined for all the 68 Veneto-speaking indi-viduals who participated in this study. Nucleo-tide differences relative to the reference sequence (CRS, Anderson et al. 1981) were identified for all individual samples. Fifty variable positions were detected in the 380 sites sequenced in HVS-1 and 18 variable positions in the 240 sites sequenced in HVS-2. All nucleotide changes were transitions, except for three transversions at nps 16097 (T to A in haplotype VB 11), 16327 (A to T in haplotype VB 28) and 217 (T to A in haplotype VB12) in haplotypes from Barco, and six trans-versions in haplotypes from Posina, one G-C at position 16129 (haplotype VP 30), one A-C at position 16182 (haplotype VP6) and the A-C transversion at position 16183 in four haplotypes (VP6, VP17, VP37 and VP30).
Diversity of haplotypes
Most of the haplotypes observed in this study were unique. There were twenty-three different haplotypes among the 38 subjects from Posina and 24 different haplotypes were found in the 30 Barco individuals. An identical haplotype was observed in seven individuals, six from Posina (VP4, VP12, VP27, VP29, VP32, VP34) and one from Barco (VB27). This haplotype was charac-terized by an HVS-1 sequence identical to the CRS, and an HVS-2 sequence with only one difference (152C) relative to the CRS.
Haplotypes contained within haplogroups H, K, U and V did not show any particular polymorphisms capable of characterizing one population group or another. In contrast, haplo-types within haplogroups J and T showed between group differences. 90 % of Posinian
158
N.
M
-P
Table 2. Variable sites in the control region HV1 and HV2 of 30 mtDNA from Veneto of Barco
Sub 1 6 0 6 9 1 6 0 8 8 1 6 0 9 7 1 6 1 1 1 1 6 1 2 6 1 6 1 2 9 1 6 1 4 5 1 6 4 1 8 1 6 1 6 2 1 6 1 6 3 1 6 1 6 9 1 6 1 8 5 1 6 1 8 6 1 6 1 8 9 1 6 1 9 2 1 6 2 1 1 1 6 2 2 3 1 6 2 2 4 1 6 2 3 1 1 6 2 3 4 1 6 2 4 9 1 6 2 5 6 1 6 2 6 1 1 6 2 7 0 1 6 2 9 4 1 6 2 9 8 1 6 2 9 8 1 6 3 0 4 1 6 3 1 1 1 6 3 1 9 1 6 3 2 4 1 6 3 2 7 1 6 3 5 2 1 6 3 6 2 1 6 3 9 1 7 2 7 3 1 4 6 1 5 0 1 5 2 1 8 5 1 8 8 1 8 9 1 9 3 1 9 5 1 9 9 2 0 4 2 0 7 2 1 5 2 1 7 CRS a C T T C T G G C A A C C C T C A C T T C T C C C C C T T T G T A T T G Hap T A T C T G A A A T T T G A T VB1 ? – – – – A – – – – – – – – – – – – – – – – – – – – – – – – – – – – – H – – – – – – – – – – – – – – – VB4 ? – – – – – – T – – – – – – – – – – – – – T – – – – – – – A – – – – – H – – – – – – – G G – – – – – – VB5 ? – – – – – – – – – – – – – – – – – – – – – – T – – – – – – – – – C – H – – – – – – – – – – – – – – – VB7 ? C – – – – – – – – – – – – – – – – – – C T – – – – – – C – – – C – – H – – – – – – – – – – – – – – – VB9 ? – – – – – – – – – – – – – – – – – – – – – – T – – – – – – – – – C – H – – – – – – – – – – – – – – – VB16 ? – – – – – – – – – – – – – – – – – – – – – – – – – – – – – – – – – – H – – – – – – – – – – – – – – – VB18 ? – – – – – – – – – – – – – – – – – – – – – – – – – – – – – – – – – – H – G – – – – – – – – – – – – – VB23 ? – – – – – – – – – – – – C – – – – – – – – – – – – – – – – – – – – – H – – – – – – – – – – – – – – – VB25 ? – – – – – – – G – – – – – – – – – – – – – – – – – – – – – – – – – – H – G – – – – – – – – – – – – – VB27 ? – – – – – – – – – – – – – – – – – – – – – – – – – – – – – – – – – – H – – – – C – – – – – – – – – – VB30 ? – – – – – – – – – – – – C – – – – – – – – – – – – – C – – – – – – – H – – – – – – – – – – – – – – – VB19 ? – – – – – – – – – – – – – – – – – – – – – – T – – – – – – – – – C – H – – – – – – – – – – – – – – – VB12 ? – – – – A – – – – – – – – – – T – – – – – – – – – – – – – – – – – A I – G – – C – – – – – C C A – A VB28 ? – – – – A – – – – – T – – – – T – – – – – – – – – – – – – – T – – A I – G – – – – – – – – C C – – – VB8 T – – – C – – – – – – – – – – – – – – – – – – – – – – – – – – – – – – J – G – – – A – – – – – – – – – VB10 T – – – C – – – – – – – – – – – – – – – – – – – – – – – – – – – – – – J – G – – – – A – – – – – – – – VB17 T – – – C – – – – – – – – – – – – – – – – – – – – – – – – – – – – – – J – G – – – – A – – – – – – – – VB26 T – – – C – – – – – – – – – – – – – – – – – – – – – – – – – – – – – – J – G – – – – A – – – – – – – – VB24 T – – – C – A – – – – – – – – – – – C – – – T – – – – – – – – – – – – J1a – G – T C – – – – C – – – G – VB11 ? – A T – A – – – – – – – – – T – – C – – – – – – – – – – C – – – – – K – – G – – – A – – – – – – – – VB3 – – – – C – – – – – – – – – – – – – – – – – – – T T – C – – – – – – – T – G – – – – – – – – – – – – – VB13 – – – – – – – – – G – – T C – – – – – – – – – – T – – – – – – – – – – T – G – – C – – – – C – – – – – VB15 T – – – C – – – – G – – T – – – – – – – – – – – – T – – – – – – – – – T – – G – – C – – – – C – – – – VB21 – – – – C – – – – G – – T C – – – – – – – – – – T – – – – – – – – – – T1 – G – – C – – – – C – – – – – VB22 – – – – C – – – – G – – T C – – – – – – – – – – T – – – – – C – – – – T1 – G – – G – – – – – – – – – – VB14 – – – – – – – – – – – – – – – – – – – T – – – – – – – – – – C – – – – U – – G – – – – – – C – – – – – VB6 ? – – – – – – – – – – – – – – – – – – – – – – – – – – – C – – – – – – V – – – – – – – – – – – – – – – VB2 ? – – – – – – – – – – – – – – G – – – – – – T – – – C – – – – – – – – V C – – – – A – – – – – – – – – VB29 ? – – – – – – – – – T – – – – – – – – – – – – – – – C – – – – – – – – V C – – – – – – – – – – – – – – VB20 ? – – – – – – – – – – – – – – – – – – – – – – T – – – – – – – – – C – other – G – – C – – – – C – – – – – Sub, subjects ; Hap, haplogroups ; (cluster membership was determined as described in the text) ; VB, Veneto from Barco.
HV 1 haplotypes, nps between 16055 and 16410 that are different from CRS (Anderson et al. 1981). (–) denotes that there is no difference from the CRS. HV 2 haplotypes, nps between 00008 and 00240 that are different from CRS (Anderson et al. 1981). (–) denotes that there is no difference from the CRS. ?, not determined.
mtDNA
diversity
in
Veneto
speakers
159
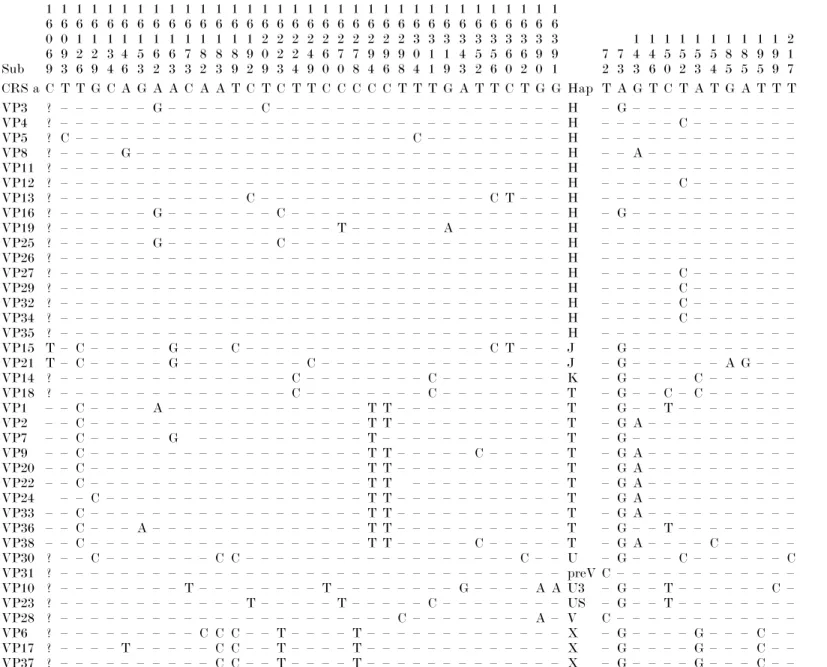
Table 3. Variable sites in the control region HV1 and HV2 of 38 mtDNA from Veneto of Posina
Sub 1 6 0 6 9 1 6 0 9 3 1 6 1 2 6 1 6 1 2 9 1 6 1 3 4 1 6 1 4 6 1 6 1 5 3 1 6 1 6 2 1 6 1 6 3 1 6 1 7 3 1 6 1 8 2 1 6 1 8 3 1 6 1 8 9 1 6 1 9 2 1 6 2 0 9 1 6 2 2 3 1 6 2 2 4 1 6 2 4 9 1 6 2 6 0 1 6 2 7 0 1 6 2 7 8 1 6 2 9 4 1 6 2 9 6 1 6 2 9 8 1 6 3 0 4 1 6 3 1 1 1 6 3 1 9 1 6 3 4 3 1 6 3 5 2 1 6 3 5 6 1 6 3 6 0 1 6 3 6 2 1 6 3 9 0 1 6 3 9 1 7 2 7 3 1 4 3 1 4 6 1 5 0 1 5 2 1 5 3 1 5 4 1 8 5 1 8 5 1 9 5 1 9 9 2 1 7 CRS a C T T G C A G A A C A A T C T C T T C C C C C T T T G A T T C T G G Hap T A G T C T A T G A T T T VP3 ? – – – – – – G – – – – – – C – – – – – – – – – – – – – – – – – – – H – G – – – – – – – – – – – VP4 ? – – – – – – – – – – – – – – – – – – – – – – – – – – – – – – – – – H – – – – – C – – – – – – – VP5 ? C – – – – – – – – – – – – – – – – – – – – – – C – – – – – – – – – H – – – – – – – – – – – – – VP8 ? – – – – G – – – – – – – – – – – – – – – – – – – – – – – – – – – – H – – A – – – – – – – – – – VP11 ? – – – – – – – – – – – – – – – – – – – – – – – – – – – – – – – – – H – – – – – – – – – – – – – VP12 ? – – – – – – – – – – – – – – – – – – – – – – – – – – – – – – – – – H – – – – – C – – – – – – – VP13 ? – – – – – – – – – – – – C – – – – – – – – – – – – – – – C T – – – H – – – – – – – – – – – – – VP16 ? – – – – – – G – – – – – – – C – – – – – – – – – – – – – – – – – – H – G – – – – – – – – – – – VP19 ? – – – – – – – – – – – – – – – – – – T – – – – – – A – – – – – – – H – – – – – – – – – – – – – VP25 ? – – – – – – G – – – – – – – C – – – – – – – – – – – – – – – – – – H – – – – – – – – – – – – – VP26 ? – – – – – – – – – – – – – – – – – – – – – – – – – – – – – – – – – H – – – – – – – – – – – – – VP27 ? – – – – – – – – – – – – – – – – – – – – – – – – – – – – – – – – – H – – – – – C – – – – – – – VP29 ? – – – – – – – – – – – – – – – – – – – – – – – – – – – – – – – – – H – – – – – C – – – – – – – VP32 ? – – – – – – – – – – – – – – – – – – – – – – – – – – – – – – – – – H – – – – – C – – – – – – – VP34 ? – – – – – – – – – – – – – – – – – – – – – – – – – – – – – – – – – H – – – – – C – – – – – – – VP35 ? – – – – – – – – – – – – – – – – – – – – – – – – – – – – – – – – – H – – – – – – – – – – – – – VP15 T – C – – – – – G – – – C – – – – – – – – – – – – – – – – C T – – – J – G – – – – – – – – – – – VP21 T – C – – – – – G – – – – – – – – C – – – – – – – – – – – – – – – – J – G – – – – – – A G – – – VP14 ? – – – – – – – – – – – – – – – C – – – – – – – – C – – – – – – – – K – G – – – – C – – – – – – VP18 ? – – – – – – – – – – – – – – – C – – – – – – – – C – – – – – – – – T – G – – C – C – – – – – – VP1 – – C – – – – A – – – – – – – – – – – – – T T – – – – – – – – – – – T – G – – T – – – – – – – – VP2 – – C – – – – – – – – – – – – – – – – – – T T – – – – – – – – – – – T – G A – – – – – – – – – – VP7 – – C – – – – – G – – – – – – – – – – – T – – – – – – – – – – – – T – G – – – – – – – – – – – VP9 – – C – – – – – – – – – – – – – – – – – – T T – – – – – C – – – – – T – G A – – – – – – – – – – VP20 – – C – – – – – – – – – – – – – – – – – – T T – – – – – – – – – – – T – G A – – – – – – – – – – VP22 – – C – – – – – – – – – – – – – – – – – – T T – – – – – – – – – – T – G A – – – – – – – – – – VP24 – – C – – – – – – – – – – – – – – – – – T T – – – – – – – – – – – T – G A – – – – – – – – – – VP33 – – C – – – – – – – – – – – – – – – – – – T T – – – – – – – – – – – T – G A – – – – – – – – – – VP36 – – C – – – A – – – – – – – – – – – – – – T T – – – – – – – – – – – T – G – – T – – – – – – – – VP38 – – C – – – – – – – – – – – – – – – – – – T T – – – – – C – – – – – T – G A – – – – C – – – – – VP30 ? – – C – – – – – – – C C – – – – – – – – – – – – – – – – – – C – – U – G – – – C – – – – – – C VP31 ? – – – – – – – – – – – – – – – – – – – – – – – – – – – – – – – – – preV C – – – – – – – – – – – – VP10 ? – – – – – – – – T – – – – – – – – T – – – – – – – – G – – – – A A U3 – G – – T – – – – – – C – VP23 ? – – – – – – – – – – – – T – – – – – T – – – – – C – – – – – – – – US – G – – T – – – – – – – – VP28 ? – – – – – – – – – – – – – – – – – – – – – – C – – – – – – – – A – V C – – – – – – – – – – – – VP6 ? – – – – – – – – – C C C – – T – – – – T – – – – – – – – – – – – – X – G – – – – G – – – C – – VP17 ? – – – – T – – – – – C C – – T – – – – T – – – – – – – – – – – – – X – G – – – – G – – – C – – VP37 ? – – – – – – – – – – C C – – T – – – – T – – – – – – – – – – – – – X – G – – – – G – – – C – –
160
N. M
-P
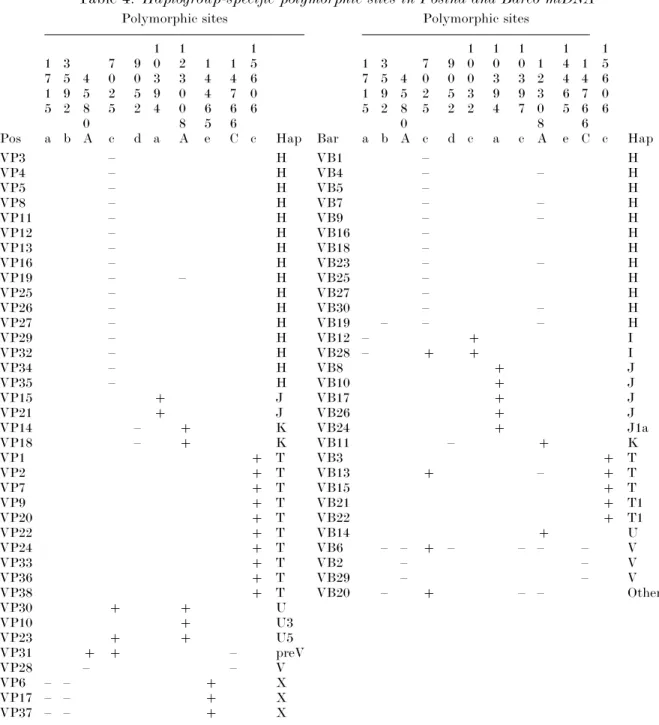
Table 4. Haplogroup-specific polymorphic sites in Posina and Barco mtDNA Polymorphic sites Polymorphic sites
Pos 1 7 1 5 a 3 5 9 2 b 4 5 8 0 A 7 0 2 5 c 9 0 5 2 d 1 0 3 9 4 a 1 2 3 0 0 8 A 1 4 4 6 5 e 1 4 7 6 6 C 1 5 6 0 6 c Hap Bar 1 7 1 5 a 3 5 9 2 b 4 5 8 0 A 7 0 2 5 c 9 0 5 2 d 1 0 0 3 2 c 1 0 3 9 4 a 1 0 3 9 7 c 1 2 3 0 8 A 1 4 4 6 5 e 1 4 7 6 6 C 1 5 6 0 6 c Hap VP3 – H VB1 – H VP4 – H VB4 – – H VP5 – H VB5 – H VP8 – H VB7 – – H VP11 – H VB9 – – H VP12 – H VB16 – H VP13 – H VB18 – H VP16 – H VB23 – – H VP19 – – H VB25 – H VP25 – H VB27 – H VP26 – H VB30 – – H VP27 – H VB19 – – – H VP29 – H VB12 – j I VP32 – H VB28 – j j I VP34 – H VB8 j J VP35 – H VB10 j J VP15 j J VB17 j J VP21 j J VB26 j J VP14 – j K VB24 j J1a VP18 – j K VB11 – j K VP1 j T VB3 j T VP2 j T VB13 j – j T VP7 j T VB15 j T VP9 j T VB21 j T1 VP20 j T VB22 j T1 VP22 j T VB14 j U VP24 j T VB6 – – j – – – – V VP33 j T VB2 – – V VP36 j T VB29 – – V VP38 j T VB20 – j – – Other VP30 j j U VP10 j U3 VP23 j j U5 VP31 j j – preV VP28 – – V VP6 – – j X VP17 – – j X VP37 – – j X
The restriction enzymes used in the analysis are designated by the following single-letter codes :al DdeI;bl
HpaI ; cl AluI; dl HaeII; el AccI. Polymorphisms 4580A, 12308A and 14766C are determined by direct
sequencing. Sites are numbered from the first nucleotide of the recognition sequence. A sign (j) indicates the presence of a restriction site and a sign (–) indicates the absence of the polymorphic site. VP, Veneto from Posina ; VB, Veneto from Barco.
haplotypes studied from haplogroup T have 296T, a mutation in the HVS-1 region, and 70 % have the 143A mutation in HVS-2. One haplo-type (VB3) from Barco exhibited the 296T mutation, and no haplotype from Barco has the 143A mutation in HVS-2. There is no dis-equilibrium linkage between the 296T an 143A
mutations. The 163G polymorphism in HVS-1 was observed in two haplotypes (VP15 and VP21) from the J haplogroup and in one haplotype (VP7) from the T haplogroup of Posina. Whereas this same 163G polymorphism was found in all haplotypes, except one from a T haplogroup, from Barco. The 185A
poly-mtDNA diversity in Veneto speakers
161
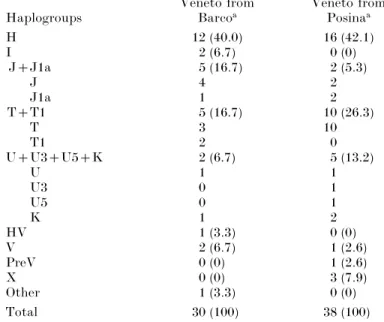
Table 5. Distribution of mtDNA haplogroups in the two villages of Veneto speakers Haplogroups Veneto from Barcoa Veneto from Posinaa H 12 (40.0) 16 (42.1) I 2 (6.7) 0 (0) JjJ1a 5 (16.7) 2 (5.3) J 4 2 J1a 1 2 TjT1 5 (16n7) 10 (26.3) T 3 10 T1 2 0 UjU3jU5jK 2 (6n7) 5 (13n2) U 1 1 U3 0 1 U5 0 1 K 1 2 HV 1 (3.3) 0 (0) V 2 (6.7) 1 (2.6) PreV 0 (0) 1 (2.6) X 0 (0) 3 (7.9) Other 1 (3.3) 0 (0) Total 30 (100) 38 (100)
All haplogroups are according to Torroni et al. 1996 and Macaulay et al. 1999.
a Values are numbers of subjects with percentage in parentheses.
Table 6. Fst analysis
(a) Computing conventional F-Statistics from haplotype frequencies for the six populations studied
TO VB OUT VP LG VB 0n00382 OUT 0n00175 0n00727 VP 0n00760 0n02259 0n01140 LG 0n00138 0n01235 0n00492 0n0062 LC 0n01152 0n00943 0n00863 0n01104 0n00112
(b) Matrix of significant Fst p values based on 100 permutations (with a p value 0n05)
VB –
OUT – –
VP j j j
LG – – – –
LC j – – – –
j, significant; –, not significant. Table 7. Fixation indices
FSC: k0n01704* FST : 0n00660* FCT : 0n02325*
* Significant F statistics p values (with a p value 0n05).
morphism in HVS-2 was observed in all haplo-types from haplogroup J, from Barco, except in haplotype VB24. One haplotype from Posina, corresponding to individuals VP2, VP20, VP24 and VP33, was retrieved in the Colle Santa Lucia group (haplotype 1986), and one haplotype from Barco corresponding to individuals VB13, VB21
and VB22, was retrieved in the Colle Santa Lucia group (haplotype 1991, 1992). Haplotypes from Barco were distributed into ten haplogroups or sub-haplogroups : H, HV, I, J, J1a, K, T, T1, U, V, and haplotypes from Posina were distributed into ten haplogroups or sub-haplogroups H, J, K, T, U, U3, U5, preV, V and X.
Haplogroup distribution in Posina and Barco people
The main haplogroups observed in the Barco group were H (40 %), J (16.7 %), T (16.7 %), V (6.7 %) and I (6.6 %). In the Posina group, the
162
N. M
-P
Table 8. Estimated number of migrants every generation for haploid data using the Fst value
TO VB OUT VP LG VB 130n49040 OUT 284n58249 68n2978 VP 65n26884 21n62931 43n36451 LG 361n85214 40n0000 101n07143 805n14850 LC 42n89640 52n54717 57n44898 44n79803 444n9997
Fig. 2. Phenogram based on the five alpine and plain populations and one out-group using Fst values and the Neighbour-Joining (NJ) clustering algorithm. Pheno-gram based on the five alpine and plain population and one out-group using Fst values and the Neighbour-Joining (NJ) (Saitou & Nei, 1987) clustering algorithm was done. The tree was rooted on the Bulgarian population. TO, Tuscanian population ; VP, Posina population (Veneto-speaker) ; VB, Barco population (Veneto-speaker) ; LC, Colle Santa Lucia population (Ladin-speaker) ; and LG, Val Gardena population (Ladin-speaker).
following distribution was found : H (42.1 %), T (26.3 %) and U (7.9 %) and X (7.9 %), while the T frequency was 5.3 % (Table 5).
Statistical analysis
Amova and F statistics results were very similar, so only the last one was reported and discussed herein. The Fst values were low for the different samples of populations (Table 6 a). The range of the Fst value (0.00062 Fst 0.02259) indicated few local genetic factors (such as founder effect or consanguinity). Among
popu-lations with a low Fst value, a significant Fst value (Table 6b) was found for the Posinian population (VP), Tuscanian population (TO) and Barco population (VB) and for the Colle Santa Lucia population (LC) and Tuscanian population (TO). The Fct indicated no Whalung effect (Table 7) for all of the populations.
The Nm values (Number of migrants every generation) were reported in Table 8. Higher Nm values were observed between the VP and Val Gardena populations (LG) (805.15), LG and LC (444.99) and between LG and TO (361.85). Whereas, lower Nm values were observed be-tween VB and VP (21.22), VB and LG (40.00), TO and LC (42.14) and between VP and LC (44.79). The Neighbour-joining tree (Figure 2) (as UPGMA one (data not shown)) defined two groups. The first one constituted mountainous populations (VP, LG, LC) and the second one constituted the plain populations (VB, TO). This topology completely fitted the geographical pat-tern.
This study described mtDNA diversity in two Italian Veneto-speaking groups from Veneto : Posina and Barco. The two groups exhibited a quite similar distribution of haplotypes when haplogroup H (representing 40 % of haplotypes from Barco and 42.1 % of haplotypes from Posina) and haplogroup 2 or JT (31.6 % of haplotypes from Barco and 33.3 % of haplotypes from Posina) were considered. While in almost all Europeans, the frequencies of haplogroup H and haplogroup 2 or JT are in the ranges of 40–50 % and 10–20 % respectively, few European populations, communities or linguistic isolates show a higher value of the haplogroup 2
mtDNA diversity in Veneto speakers
163
or JT frequency. Specifically, this haplogroup encompasses 63 % of Val Gardena haplotypes and 51 % of Middle Eastern population haplo-types, while it only represents 35.7 % of the haplotypes in Fassa, 27 % in Turkey, 25 % in Tuscany and 24.9 % in Badia. Samples from Ladin-speaking populations (Val Gardena, Colle Santa Lucia, Badia, Fassa) located in the North of the historical Venetia region in the southern Alps (Stenico et al. 1998), show similarity to the Posina and Barco samples. Other populations of northern Italy (Stenico et al. 1996) such as German-speakers (Hafling and Jenesian) and populations from Trento-Adige show a different pattern of mtDNA diversity.
These observations should reflect one of the two Paleolithic migrations from the Middle East, probably the one that occurred along the Mediterranean coast (Richards et al. 1996). The physical barrier formed by the Alps would have prevented people from migrating southward to Tuscany and then westward. Some people may have stayed in the mountainous area and become the founders of future Alpine populations. Nm values (calculated here from our two groups of Veneto-speakers, from Ladin-speakers (Stenico
et al. 1996) and from the Tuscanian population (Francalacci et al. 1996)) (Table 8) sustained the hypothesis that it was not an isolation process for Alpine populations regarding plain popu-lations, but a difference in the rate of the number of migrants between the two geographical areas. The beginning of genetic drift, suspected by the Fst, was due only to this phenomenon.
The Posina and Barco groups were distin-guished by their haplogroup J and haplogroup T distributions. The Barco population, with a higher J value, is more like the neighbouring Tuscanians than Posina (16.6 % in Barco, 16.6 % in Tuscany and 5.3 % in Posina). This differen-tiation is also shown by statistical analysis (Table 6a, b and Fig. 2). Haplogroup J represents about 7.1–11 % of European haplotypes (Richards et al. 1998 ; Torroni et al. 1994, 1997), becoming more frequent in Central and West Europe. It was probably introduced into Europe from the Near East about 10 000 years ago during the Neolithic
expansion. This Neolithic migration could have left tracks in the Barco and Tuscan groups more than in most alpine groups.
The T haplogroup is the major non-H haplo-group in the Posina population (26.3 %), encom-passing 16.7 % of haplotypes from Barco. Haplo-group T may have come from the Near East, as had haplogroup J (Torroni et al. 1997 ; Richards
et al. 1998). In Europe, haplogroup T exhibits a global frequency equal to 8 % : in Spanish (including Catalonia and Andalusia) (Corte-Real
et al. 1996 ; Pinto et al. 1996 ; Parsons et al. 1997) and Portuguese (Corte-Real et al. 1996) popu-lations, the T haplogroup represents 7 % and 11 % respectively. In different Mediterranean populations (listed in Torroni et al. 1996), in-cluding Greeks, Albanians, Sardinians, Apulians, Sicilians, Arabs from Palestine and Jews, the T haplogroup has been spotted by RFLP analysis. None of the populations show more than 14.6 % (in Sicilia) of T haplogroup.
From our data (Table 9) populations ex-hibiting a T haplogroup frequency equal to or higher than that of Middle Eastern populations (16.6 %) are mainly situated in the Alpine area with the exception of Fassa, which is distin-guished by a very low value. T haplogroup encompasses 53.8 % of haplotypes from Colle Santa Lucia and Val Gardena populations (Ladin speakers) and only 16.7 % of haplotypes from Barco. In the Posina population, nine out of ten (90 %) of the T individuals have both mutations 16294T and 16296T, as noticed for the Val Gardena and Tuscan populations. These two mutations are considerably less frequent in T individuals from Barco (one out of five, 20 %), and from Colle Santa Lucia (two out of seven, 27 %). Therefore, the T haplogroup members of Posina, Val Gardena and Tuscany can be distinguished from the T haplogroup members from Barco and Colle Santa Lucia.
Despite this point, haplogroup composition of the Posinians in this study appeared to be different from that of the Tuscans, with no I or W haplogroups in the Posinians, and a small J haplogroup frequency (5.3 % vs. 14.6 % in Tuscans). Considering Barco and Posina mtDNA
164
N. M
-P
Table 9. Distribution of JT, J and T haplogroups in European populations
Population n
Haplogroup 2
or JT (%) Haplogroup J (%) Haplogroup T (%)
Colle Santa Luciaa 10 70 10 60
Gardenab 16 63 3n8 50
Middle Eastc 42 51 19n4 16n6
Fassab 14 35n7 28n5 7
Posina (this study) 38 31n5 5 26n5
Barco (this study) 30 30 17 16n6
Turkeyd–e 74 27 16 9n3 Tuscanyf 49 25 12n5 10n2 Badiab 13 24n9 7n7 15 Germanyg 107 21n5 nd 10n3 Bulgariad 30 20 nd 10 Sardiniac 69 19 5n8 11n6 Great Britainh–i 106 18n8 11n8 6n9 Andalusiaj 16 18n8 12n5 6n3 Portugalj 54 18n1 nd 10n9 Russiak 117 17n9 6n8 8n5 Estoniak 28 17n9 7 10n7 Spainj–l 71 16 nd 8n5 Austriam 16 12n5 12n5 0 Switzerlandh–n 77 11n7 9n1 2n6 Finlandk–n 142 11 2 3n5 Basque Counrtyj–o 106 7n5 nd 4n6 Cataluniaj 15 6 nd 0 Norwayk–p 82 3n5 0 0 Swedenk 25 0 0 0
Haplogroup JT is defined as Simoni et al. 2000. Haplogroup J and T are defined as Torroni et al. 1996. n means the numbers of individuals studied in each population.aFrom Stenico et al. 1996 ;bFrom Stenico et al. 1998 ;cFrom Di
Rienzo et al. 1991 ; dFrom Calafell et al. 1996 ; eFrom Comas et al. 1996 ; fFrom Francalacci et al. 1996 ;gFrom
Richards et al. 1996 ; hFrom Horai et al. 1990 ; iFrom Piercy et al. 1993 ; jFrom Corte-Real et al. 1996 ; kFrom
Sajantila et al. 1996 ; lFrom Pinto et al. 1996 ; mFrom Handt et al. 1994 ; nFrom Pult et al. 1994 ; oFrom
Bertranpetit et al. 1995 ;pFrom Delghandi et al. 1998.
diversity, Veneto-speakers appear hetero-geneous. MtDNA diversity in these two groups seems to depend more on the geographic dis-tribution of the population than on their common dialect.
We would like to express our gratitude to Romano Zambon, Maria Angela Pitton-Buset and Ada Agnolon who helped us to obtain samples, and Mario Dalla Via and Franco Zambon who provided rich documentation. We thank Prof. Antonio Torroni for critical advice and helpful discussion. A. S. and J. L. S. are supported by a grant from Conseil Re! gional Provence Alpes Co#te d’Azur. This work was supported by INSERM.
Ammerman, A. J. & Cavalli-Sforza, L. L. (1984). The Neolithic transition and the genetics of populations in Europe. Princeton, NJ : Princeton University Press. Anderson, S., Bankier, A., Barell, B., De Bruijn, M.,
Coulson, A., Drouin, J., Eperon, I., Nierlich, D., Roe, B., Sanger, F., Schreier, P., Smith, A., Staden, A. & Young, I. (1981). Sequence and organization of the human mitochondrial genome. Nature. 290, 457–465.
Barbujani, G. & Sokal, R. R. (1991 a). Genetic population structure of Italy. I. Geographic patterns of gene frequencies. Hum. Biol. 63, 253–72.
Barbujani, G. & Sokal, R. R. (1991 b). Genetic population structure of Italy. II. Physical and cultural barriers to gene flow. Am. J. Hum. Genet. 48, 398–411.
Bertranpetit, J., Sala, J., Calafell, F., Underhill, P. A., Moral, P. & Comas, D. (1995). Human mitochondrial DNA variation and the origin of Basques. Ann. Hum. Genet. 59, 63–81.
Broglio, A. (1987) Ceni sulla storia delle richerche sulla preistoria e protostoria del territorio vicentino. Academia Olimpica. Neri Pozza, Ed.
Burckhardt, F., von Haeseler, A. & Meyer, S. (1999). HvrBase : Compilation of mtDNA control region sequences from primates. Nucleic Acids Res. 27, 138–142.
Calafell, F., Underhill, P., Tolun, A., Angelicheva, D. & Kalaydjieva, L. (1996). From Asia to Europe : mito-chondrial DNA sequence variability in Bulgarians and Turks. Ann. Hum. Genet. 60, 35–49.
Chieco Bianchi, A. M. (1988). I Veneti, in Italia omnium terrarum alumna. Milano : Libri Scheiwiller.
Comas, D., Calafell, F., Mateu, E., Perez-Lezaun, A. & Bertranpetit, J. (1996). Geographic variation in human mitochondrial DNA control region sequence : the population history of Turkey and its relationship to Europeans population. Mol. Biol. Evol. 13, 1067–1077.
mtDNA diversity in Veneto speakers
165
Co# rte-Real, H., Macaulay, V., Richards, M., Hariti, G., Issad, M., Cambon-Thomsen, A., Papiha, A., Bertranpetit, J. & Sykes, B. (1996). Genetic diversity in the Iberian Peninsula determined from mito-chondrial sequence analysis. Ann. Hum. Genet. 60, 331–350.
Dalla Via, M. (1993). Communita' di confine nella Val Posina : la terra, la gente. Vicenza : la grafica e stampa, Ed.
Delghandi, M., Utsi, E. & Krauss, S. (1998). Saami mitochondrial DNA reveals deep maternal lineage clusters. Hum. Hered. 48, 108–14.
Di Rienzo, A. & Wilson, A. C. (1991). Branching pattern in the evolutionary tree of human mitochondrial DNA. Proc. Natl. Acad. Sci. USA 88, 597–601.
Excoffier, L., Smouse, P. E. & Quattro, J. M. (1992). Analysis of molecular variance inferred from metric distances among DNA haplotypes : application to human mitochondrial DNA restriction data. Genetics
13, 1479–1491.
Francalacci, P., Bertranpetit, J., Calafell, F. & Underhill, P. A. (1996). Sequence diversity of the control region of the mitochondrial DNA in Tuscany and its impli-cations for the peopling of Europe. Am. J. Phys. Anthropol. 100, 443–460.
Handt, O., Richards, M., Trommsdorff, M., Kilger, C., Simanainen, J., Georgiev, O., Bauer, K., Stone, A., Hedges, R., Schaffner, W., Utermann, G., Sykes, B. & Pa$ a$bo, S. (1994). Molecular genetic analyses of the tyrolean Iceman. Sciences 264, 1775–1778.
Horai, S. & Hayasaka, K. (1990). Intraspecific nucleotide sequence differences in the major noncoding region of human mitochondrial DNA. Am. J. Hum. Genet. 46, 828–842.
Livingstone, F. B. (1963). Blood-group and ancestry : a test case from the New Guinean Highlands. Curr. Anthropol. 4, 541–542.
Macaulay, V., Richards, M., Hickey, E., Vega, E., Cruciani, F., Guida, V., Scozzari, R., Bonne-Tamir, B., Sykes, B. & Torroni, A. (1999). The emerging tree of West Eurasian mtDNAs : a synthesis of control-region sequences and RFLPs. Am. J. Hum. Genet. 64, 232–249.
Menozzi, P., Piazza, A. & Cavalli-Sforza, L. L. (1978). Synthetic maps of human gene frequencies in Europeans. Sciences 201, 786–792.
Parsons, T. J., Muniec, D. S., Sullivan, K., Woodyatt, N., Alliston-Greiner, R., Wilson, M. R., Berry, D. L., Holland, K. A., Weedn, V. W., Gill, P. & Holland, M. M. (1997). A high observed substitution rate in the human mitochondrial DNA control region. Nat Genet.
15, 363–368.
Piazza, A., Menozzi, P., Cavalli-Sforza, L. L. (1981). Synthetic gene frequency maps of man and selective effects of climate. Proc. Natl. Acad. Sci. USA 78, 2638–2642.
Piazza, A., Cappello, E., Olivetti, E. & Rendine, S. (1988). A genetic history of Italy. Ann. Hum. Genet. 52, 203–213.
Piercy, R., Sullivan, K. M., Benson, N. & Gill, P. (1993). The application of mitochondrial DNA typing to the study of white Caucasian genetic identification. Int. J. Legal. Med. 106, 85–90.
Pinto, F., Gonzalez, A. M., Hernandez, M., Larruga, J. M. & Cabrera, V. M. (1996). Genetic relationship
between Canary Islanders and their African and spanish ancestors inferred from mitochondrial DNA. Ann. Hum. Genet. 60, 321–330.
Prosdocimi, A. L. (1978). Il Venetico, in Popoli e civilita' dell ’ Italia antica, VI, Roma. Milano : Libri Scheiwiller. Pult, I., Sajantila, A., Simanainen, J., Georgiev, O., Schaffner, W. & Pa$ a$bo, S. (1994). Mitochondrial DNA sequence from Switzerland reveal striking homogen-eity of European populations. Biol. Chem. Hoppe seyler
375, 837–840.
Rendine, S., Piazza, A. & Cavalli-Sforza, L. L. (1986). Simulation and separation by principal components of multiple demic expansions in Europe. Am. Nat. 128, 681–706.
Richards, M., Macaulay, V., Bandelt, H. J. & Sykes, B. (1998). Phylogeography of mitochondrial DNA in western Europe. Ann Hum. Genet. 62, 241–260. Richards, M., Corte-Real, H., Forster, P., Macaulay, V.,
Wilkinson-Herbots, H., Demaine, A., Papiha, S., Hedges, R., Bandelt, H. J. & Sykes, B. (1996). Paleolithic and Neolithic lineages in the European mitochondrial gene pool. Am. J. Hum. Genet. 59, 185–203.
Saitou, N. & Nei, M. (1987). The neighbor-joining method : a new method for reconstructing phylogenetic trees. Mol. Biol. Evol. 4, 406–425.
Sajantila, A., Lahermo, P., Anttinen, T., Lukka, M., Sistonen, P., Savontaus, M. L., Aula, P., Beckman, L., Tranebjaerg, L., Gedde-Dahl, T., Issel-Tarver L., DiRienzo, A. & Pa$ a$bo, S. (1996). Paternal and maternal DNA lineage reveal a bottleneck in the founding of the Finnish population. Proc. Natl. Acad. Sci. USA. 93, 12035–12039.
Schneider, S., Roessli, D. & Excoffier, L. (2000). Arlequin ver.2.0 : A software for population genetics data analysis. Genetics and Biometry laboratory, University of Geneva, Switzerland.
Simoni, L., Calafell, F., Pettener, D., Bertranpetit, J. & Barbujani, G. (2000). Geographic patterns of mtDNA diversity in Europe. Am. J. Hum. Genet. 66, 262–278. Slatkin, M. (1975). Gene flow and selection in a two-locus
system. Genetics 81, 787–802.
Slatkin, M. (1985). Gene flow in natural populations. Annu Rev Ecol Syst. 16, 393–430.
Sokal, R. R. (1988). Genetic, geographic and linguistic distances in Europe. Proc. Natl. Acad. Sci. USA 85, 1722–1726.
Sokal, R. R. & Menozzi, P. (1982). Spatial auto-correlation of HLA frequencies in Europe support demic diffusion of early farmers. Am. Nat. 119, 1–17. Stenico, M., Nigro, L. & Barbujani, G. (1998).
Mito-chondrial lineages in Ladin-speaking communities of the eastern Alps. Proc. R. Soc. Lond. B. 265, 555–561. Stenico, M., Nigro, L., Bertorelle, G., Calafell, F., Capitanio, M., Corrain, C. & Barbujani, G. (1996). High mitochondrial sequence diversity in linguistic isolates of the Alps. Am. J. Hum. Genet. 59, 1363–1375. Thompson, J. D., Higgins, D. G. & Gibson, T. J. (1994). CLUSTAL W : improving the sensitivity of progressive multiple sequence alignment through sequence weighting, position-specific gap penalties and weight matrix choice. Nucleic Acids Res. 22, 4673–4680. Torroni, A., Petrozzi, M., D’Urbano, L., Sellito, D.,
166
N. M
-P
Carelli, V., Barboni, P., De Negri, A. & Scozzari, R. (1997). Haplotype and phylogenetic analyses suggest that one european-specific mtDNA background plays a role in the expression of leber hereditary optic neuropathy by increasing the penetrance of the primary mutations 11778 and 14484. Am. J. Hum. Genet. 60, 1107–1121.
Torroni, A., Huoponen, K., Francalacci, P., Petrozzi, M., Morelli, L., Scozzari, R., Obinu, D., Savontaus, M. L. & Wallace, D. (1996). Classification of european mtDNAs from an analysis of three european popu-lations. Genetics 144, 1835–1850.
Torroni, A., Lott, M. T., Cabell, M., Chen, Y. S., Lavergne, L. & Wallace, D. C. (1994). mtDNA and the origin of Caucasians : identification of ancient caucasian-specific Haplogroup, one of which is prone to a recurrent somatic duplication in the D-loop Region. Am. J. Hum. Genet. 55, 760–776.
Weir, B. S. & Cockerham, C. C. (1984). Estimating F-statistics for the analysis of population structure. Evolution 38, 1358–1370.
Wijsman, E. M. & Cavalli-Sforza, L. L. (1984). Migration and genetic population structure with special reference to human. Annu. Rev. Ecol. Syst. 15, 279–301.