HAL Id: hal-02050579
https://hal.archives-ouvertes.fr/hal-02050579
Submitted on 27 Feb 2019HAL is a multi-disciplinary open access
archive for the deposit and dissemination of sci-entific research documents, whether they are pub-lished or not. The documents may come from teaching and research institutions in France or abroad, or from public or private research centers.
L’archive ouverte pluridisciplinaire HAL, est destinée au dépôt et à la diffusion de documents scientifiques de niveau recherche, publiés ou non, émanant des établissements d’enseignement et de recherche français ou étrangers, des laboratoires publics ou privés.
To Heat or not to Heat: a Study of the Performances of
Iron Carbide Nanoparticles in Magnetic Heating
Juan Manuel Asensio, Julien Marbaix, Nicolas Mille, Lise-Marie Lacroix,
Aikaterini Soulantika, Pier-Francesco Fazzini, Julian Carrey, Bruno Chaudret
To cite this version:
Juan Manuel Asensio, Julien Marbaix, Nicolas Mille, Lise-Marie Lacroix, Aikaterini Soulantika, et al.. To Heat or not to Heat: a Study of the Performances of Iron Carbide Nanoparticles in Magnetic Heating. Nanoscale, Royal Society of Chemistry, In press. �hal-02050579�
1
To Heat or not to Heat: a Study of the Performances
of Iron Carbide Nanoparticles in Magnetic Heating
Juan Manuel Asensio,a* Julien Marbaix,a Nicolas Mille,a Lise-Marie Lacroix,a Katerina
Soulantica,a Pier-Francesco Fazzini,a Julian Carrey,a Bruno Chaudret.a*
aLPCNO, Université de Toulouse, CNRS, INSA, UPS, 135 avenue de Rangueil, 31077
Toulouse, France.
*Dr. Bruno Chaudret: chaudret@insa-toulouse.fr *Dr Juan M. Asensio: asensior@ insa-toulouse.fr
ABSTRACT. Heating magnetic nanoparticles with high frequency magnetic fields is a topic of interest for biological applications (magnetic hyperthermia) as well as for heterogeneous catalysis. This study shows why FeC NPs of similar structures and static magnetic properties display radically different heating power (SAR from 0 to 2 kW.g-1). By combining results from
Transmission Electron Microscopy (TEM), Dynamic Light Scattering (DLS) and static and time-dependent high-frequency magnetic measurements, we propose a model describing the heating mechanism in FeC nanoparticles. Using, for the first time, time-dependent high-frequency hysteresis loop measurements, it is shown that in the samples displaying the larger heating powers, the hysteresis is strongly time dependent. More precisely, the hysteresis area increases by a factor 10 on a timescale of a few tens of seconds. This effect is directly related to the ability of the nanoparticles to form chains under magnetic excitation, which depends on the presence or not of strong dipolar couplings. These differences are due to different ligand concentrations on the surface of the particles. As a result, this study allows the design of a scalable synthesis of nanomaterials displaying a controllable and reproducible SAR.
2
Magnetic heating, i.e. heating of magnetic nanoparticles using magnetic excitation, is a topic of interest that proposes promising applications in the field of cancer therapy1-3 –the so-called
magnetic hyperthermia– and more recently in heterogeneous catalysis.4-11 Thus, recent papers
and patents evidence the high potential of this technique in catalysis given its anticipated energetic efficiency. A recurrent problem in magnetic hyperthermia concerns the variability of the heating capacities of nanomaterials and the origin of this phenomenon. The use of magnetic heating in catalysis requires materials displaying the highest possible heating powers in a reproducible way and therefore, a good understanding of the heating mechanism of magnetic nanoparticles (MNPs) and their assemblies under operating conditions. Magnetic heating has developed considerably during the past few years thanks nanochemistry, which has enabled the controlled synthesis of MNPs displaying tailored heating properties. However, controlling the heating power of MNPs in reproducible and scaled-up processes is a challenging task as the magnetic properties depend on many parameters.3, 12 As a consequence, variations in the
reaction conditions may lead to variations in the heating power of the MNPs, which emphasizes the need for robust synthetic methods for MNPs production.
The heating power of MNPs is usually quantified by the specific absorption rate (SAR), which describes the amount of energy absorbed per unit of mass in the presence of an alternating magnetic field. Although the mechanism of heating for single-domain NPs is well-understood,13, 14 several theoretical and experimental studies have demonstrated that magnetic
interactions between the NPs can dramatically affect their heating power.15-21 A good
understanding of the influence of interactions between the NPs on their SAR is, therefore, a prerequisite to any development of the use of magnetic heating whether in biology or in catalysis. Some theoretical and experimental works have shown that organization of NPs into chains as a result of the application of a magnetic field during the experiments, induces the occurrence of an additional uniaxial anisotropy that enhances their heating power.19, 22-24 The
3
magnitude of magnetic interactions (dipolar couplings) between the NPs is crucial to allow this phenomenon taking place, since if the NPs are too far away to interact and to be organized in the presence of the magnetic field, their heating power remains low. Thus, the heating power increases with the concentration of NPs until reaching an optimal point, after which higher concentrations favor the presence of strong demagnetizing interactions resulting into a drop of the heating power.20
One additional consequence of dipolar interactions is that, at a given concentration, an agglomeration of MNPs reduces their heating due to an absence of mobility25 and/or to the fact
that the overall magnetic moment of agglomerates is reduced dueto their magnetic flux closure configurations, reducing their tendency to interact with their neighbors.26, 27 Thus, in samples
without agglomerates and displaying large heating powers, the heating power is expected to increase with time following the dynamics of the NPs self-organization upon application of an alternating magnetic field. On the contrary, in samples with agglomerates, heating power is expected to remain small and constant with time. However, to the best of our knowledge, direct experimental proofs of these expected effects have never been reported. This will be done in the present work and monitored by a technique never used in this context: time-dependent high-frequency measurements.
Different MNPs have been synthesized for applications in magnetic hyperthermia. Among them, the most widely used are iron oxide-based systems due to their good biocompatibility.26, 28-33 However, for magnetically-induced catalysis where higher temperatures are required, iron
carbide NPs (FeC NPs) can be better candidates. especially since these materials are ferromagnetic at room temperature and display moderate coercive fields and good colloidal stability.2 Different preparation methods of FeCx NPs for applications in catalysis have been
reported.34-39 Over the past years, our group has developed the synthesis of monodisperse Fe(0)
4
NPs.5, 34, 44 High values of SAR of ca. 750 Wˑg-1 (100 kHz, 47 mT) were achieved for Fe(0)
NPs,45 but their transformation into FeC NPs led to much enhanced SAR as well as better
catalytic activity and air stability. Indeed, we recently reported the synthesis of FeCx NPs displaying heating properties in organic solvents that surpass those of any previously described material.5, 44 The NPs were synthesized by carbidization of pre-formed monodisperse Fe(0) NPs
using a mixture of syngas (CO/H2). We demonstrated that their very high SAR was related to
the presence of the crystalline Fe2.2C phase.5 However, different values of SAR could be
obtained upon slightly modifying the reaction and purification conditions.
In this paper, we demonstrate that standard static magnetic measurements cannot discriminate between heating and non-heating Fe2.2C NPs. In our case, the heating properties can only be
understood in terms of the presence or not of strong dipolar couplings resulting from the organization or agglomeration of the nanoparticles, which in turn depend on the surface ligands concentration. Time-dependent high-frequency magnetic measurements were employed for the first time to characterize the behavior of NPs assemblies under alternating magnetic fields. In association with dynamic light scattering they were found to be the key techniques to unveil the origin of the differences in the heating properties of the samples. These findings constitute a novel insight into the relationship between the synthesis of NPs and their final heating properties and allowed to design robust procedures for the production of FeC NPs based nanomaterials displaying high and reproducible heating powers.
RESULTS AND DISCUSSION
Heating and non-heating Fe2.2C NPs obtained by carbidization of Fe(0) NPs.
In our previous work, we explored the synthesis of Fe2.2C NPs through carbidization of
pre-formed monodisperse Fe(0) NPs under a syngas mixture in mesitylene.5 In that preliminary
5
been isolated by post-synthesis decantation and washing, after which a powder with a Fe content of ca. 50 wt% was obtained and carbidized during 96 h to give Fe2.2C (FeC-ref) NPs
with unprecedent SAR (see Table 1). The excellent heating power of the Fe2.2C NPs obtained
after carbidization incited us to optimize and scale-up the reaction. Thus, in order to purify more extensively the surface of the particles, a more efficient washing of the powder led to Fe(0) NPs
Fe-1, with a Fe content of 78% determined by thermogravimetric analysis (TGA). Surprisingly,
even though the carbidization of these NPs was performed under similar conditions to those described in our previous work (reaction time of 96 hours), a strong agglomeration of the FeC NPs (NPs FeC-1 in Table 1, see also Figure 1-a and S1) was observed by transmission electron microscopy (TEM).
The SAR of FeC-1 measured by calorimetry experiments had a value of 0 W·g-1 when applying
an alternating magnetic field of µ0Hrms of 47 mT at a fixed frequency of 93 kHz, (Hmax = √2Hrms)
contrasting with the excellent SAR found under the same conditions for NPs FeC-ref prepared by the same methodology (ca. 2000 W·g-1, see Table 1). In addition, NPs FeC-1 were not
dispersible in mesitylene, in contrast to the NPs FeC-ref prepared in our previous work. Furthermore, the NPs rapidly precipitated even after external addition of solubilizing ligands and sonication at room temperature. Finally, the size of the FeC NPs FeC-1 after carbidization was only marginally increased compared to the starting Fe(0) NPs (from 12.5 ± 1.3 nm to 13.7 ± 1.6 nm). Extending the carbidization time to 7 or 8 days induced the coalescence of the NPs to give large nanoobjects of more than 200 nm observed by TEM. These results suggest a non-innocent role of the ligands in the carbidization process.
Analysis of the Mössbauer spectrum (see Fig S2) showed the presence of the heating carbide phase Fe2.2C in FeC-1 with a concentration of 59.6%, together with some Fe5C2 (28.1%) and
Fe(0) (8.3%). Although the relative amount of the heating phase Fe2.2C was lower than in
6
be justified by this difference. Powder X-Ray diffraction (XRD) analysis of FeC-1 only showed the peaks related to the Fe2.2C phase (see Fig. S3). Similarly, the saturation magnetization (Ms,
170 A·m2·kg-1), remnant magnetization (Mr, 23 A·m2·kg-1), coercive field (Hc, 0.051 T) and
magnetic susceptibility (χm, 0.043) of the FeC-1 NPs measured by vibrating sample magnetometry (VSM, see Fig S4) did not reveal any significant differences in the Ms, Mr or χm from the values found in the FeC-ref NPs previously reported by Bordet et al., although a higher value of Hc was obtained in that case (Ms = 170 A·m2·kg-1, Mr ~ 30 A·m2·kg-1, Hc = 0.103 T and χm ~ 0.04 at 300 K). All these results indicate that these structuraldifferences are not enough to explain the lack of heating properties in FeC-1 NPs.
Figure 1. TEM micrographs of (a) the agglomerated NPs FeC-1 after carbidization of 96 h and
(b) of the dispersible NPs FeC-2 after carbidization of 48 h. (a)
(b)
FeC-1
7
High Resolution TEM (HRTEM) and High-Angle Annular Dark-Field Scanning Transmission Electron microscopy (HAADF-STEM) analyses of the non-heating FeC-1 NPs showed that the agglomerates formed by several NPs are surrounded by a thin amorphous layer composed of a light element (see Figure S5). Energy-dispersive X-ray EDX spectroscopy also evidenced the presence of a shell containing silicon in addition to oxygen (see Figure 2b-f). This amorphous silicon-oxygen embedding layer is likely to be amorphous silica or a polysiloxane derivative, the presence of which could be related to the lack of solubility of NPs FeC-1 in mesitylene and their assembly into the large aggregates as it would reduce the interactions between the agglomerates and the ligands added to re-disperse the NPs. XPS spectroscopy confirmed the presence of Si at binding energies of 102 eV for the Si 2p3/2 orbital, which are characteristic of
silicates or organosiloxanes (see Fig S6). Concerning its origin, the only possible source of Si in the carbidization process is hexamethyldisilazane (hmds) resulting from the reaction with hydrogen of the corresponding amido ligand present in {Fe[N(SiMe3)2]2}2, the organometallic
precursor of the starting Fe NPs (see experimental section for more details). When carbidization progresses, water molecules are released into the solution as a reaction product44 and at low
concentration of other ligands they can react with the Si moiety, leading to the formation of the amorphous embedding layer.
The role of this layer in the on-off behaviour of the heating power has then to be clarified. It has been previously shown that the presence of more than 2 wt% of SiO2 deteriorates the magnetic
permeability of a hard magnetic material such as bulk barium ferrite,46 but here, this is not the
case since the Ms of the FeC-1 NPs determined by VSM is very similar to that measured for the FeC-ref NPs (see Table 1). Then, the on-off behaviour of the heating power has to be related to the NPs agglomeration, in which the silicon containing layer can also play a role by preventing chain formation. There are two convergent explanations to this fact: (i) when the NPs are aggregated, the proximity between the magnetic domains induces strong
8
demagnetizing interactions between them, typically dipole-dipole interactions18, 20, 47 and (ii),
when the FeC NPs are agglomerated, their organization in the magnetic field into chains is not possible. Such chains are necessary to be formed during the hyperthermia experiments in order to induce the presence of a uniaxial anisotropy that enhances the NP heating power.19, 22 For
this phenomenon to happen, a relative free mobility of the NPs is required.
We noticed that after 96 hours of carbidization, 2 bars of syngas were consumed for the preparation of the FeC-1 NPs, whereas for the synthesis of the heating FeC-ref NPs the pressure drop observed at the end of the reaction was of only 0.8 bars. We assume that due to the presence of less organic ligands in the Fe-1 NPs herein used, an easier surface access may accelerate CO hydrogenation, leading to more syngas consumption and justifying the higher pressure drop. When carbidization of Fe-1 NPs was allowed to proceed only for 48 hours, the
syngas consumption was of 0.8 bars, and the FeC-2 NPs obtained were dispersible in
mesitylene as evidenced by TEM micrographs (see Fig 1b and Fig S7). In contrast to FeC-1, their SAR measured at µ0Hrms of 47 mT with a f of 93 kHz was 1260 W.g-1 (see Table 1 and
Fig S8). The FeC-2 NPs were also characterized by the same techniques as the FeC-1 NPs (see Fig S9-11). The SAR of NPs FeC-2 was higher than the SAR of the analogous NPs obtained by Bordet et al. after 48 hours of carbidization (1260 and 342 W·g-1 respectively).
9
Table 1. Comparison between the NPs FeC-1 and FeC-2 prepared in this work by variation of
the reaction time with the NPs FeC-ref prepared by Bordet et al.5
a Deterimined by TGA. b Measured at 47 mT and 93 kHz. c Determined by VSM and measured at 300 K. d
Measured at 4 K.
Interestingly, despite their better heating properties, the degree of carbidization of the FeC-2 NPs was lower than for FeC-1, as deduced from the lower content of the Fe2.2C and Fe5C2
phases in the Mössbauer spectroscopy (see Table 1). This fact also indicates that the absence of heating power in NPs FeC-1 is not related to the carbidization degree and raises the question of the heating mechanism. From the above data we can conclude that the low ligand content of the Fe-1 NPs modifies the kinetics of the carbidization process and that the FeC-1 NPs present different surface properties and tend to agglomerate. Indeed, XPS spectrometry revealed that NPs FeC-2 were free of Si, contrary to FeC-1. XPS also showed that NPs FeC-2 were richer
Carbidization conditions: NPs FeC-1 (this work, 96 h carbidization) NPs FeC-2 (this work, 48 h carbidization) NPs FeC-ref (Bordet et al., 96 h carbidization) NPs FeC-ref (Bordet et al., 48 h carbidization) Size (nm) 13.3 ± 1.6 nm 14.4 ± 1.3 nm 15.9 ± 0.9 nm ~ 13 nm ΔP after reaction (bar) >2 0.8 ~0.8 ~0.4 Starting Fe(0) NPs
(Fe wt%a) Fe-1 (78%) Fe-1 (78%) Fe-ref (ca. 50%) Fe-ref (ca. 50%)
Dispersible in
Mesitylene No Yes Yes Yes
SAR (W·g-1) b 0 1260 1935 342 Magnetic properties c Ms = 170 A·m2·kg-1 Mr = 23 A·m2·kg-1 Hc = 0.051 T χm = 0.043 Ms = 168 A·m2·kg-1 Mr = 28 A·m2·kg-1 Hc = 0.055 T χm = 0.043 Ms = 170 A·m2·kg-1 Mr~ 30 A·m2·kg-1 Hc = 0.103 T χm~ 0.04 Ms = 163 A·m2·kg-1 Mr~ 25 A·m2·kg-1 Hc = 0.050 T χm~ 0.04 Mössbauer spectroscopy d FeFe2.2C (60 %) 5C2 (28%) Fe(0) (8%) Fe2.2C (52%) Fe5C2 (32%) Fe(0) (12%) Fe2.2C (71%) Fe5C2 (24%) Fe(0) (4%) Fe2.2C (55%) Fe5C2 (23%) Fe(0) (18%)
10
in Fe(0) at their surface and less oxidized than NPs FeC-1, which may be again linked to the presence of the Si containing layer in the latter (see Fig S6).
In order to re-disperse the agglomerates, a sample of 50 mg of the FeC-1 NPs was heated at 150 °C in mesitylene in the presence of 0.2 equivalents of palmitic acid for 2 hours. A dark-brown suspension that contained the FeC-3 NPs was recovered after the reaction. Although the suspension was stable for 1 hour and only thereafter the NPs started to precipitate, large agglomerates were still observable by TEM (see Figure S12) together with few isolated NPs. and The FeC-3 NPs displayed a very low SAR value of ca. 20 W.g-1 in hyperthermia
experiments at µ0Hrms = 47 mT and f = 93 kHz. The FeC-3 NPs were then characterized by
VSM and XRD without showing significant differences from FeC-1 and FeC-2 NPs (see Fig. S13-15). Moreover, the hysteresis cycles for NPs FeC-3 and FeC-2 are identical. Then, the
FeC-3 NPs were further characterised by HAADF-STEM and EDX. No significant differences
in the surface composition of the FeC-3 NPs and the heating FeC-2 NPs were found by EDX mapping. However, upon observing TEM micrographs at low magnification, it is difficult to determine if the agglomeration degree of the two samples FeC-2 and FeC-3 is significantly different (see Figure S14).
Understanding the heating mechanism of FeC NPs in solution.
Thanh and co-workers have observed a correlation between the heating properties of multi-core iron oxide NPs and their dispersion in solution.27 The authors concluded that a better magnetic
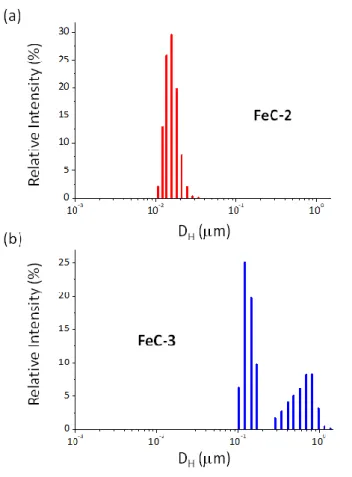
heating power was associated to less inter-particle interactions as deduced by Dynamic Light Scattering (DLS). Thus, DLS measurements in mesitylene solution evidence for FeC-3 the presence of large agglomerates displaying a DH of 590 ± 380 nm (38% population) and 121 ±
40 nm (62% population) (see Figure 2). In contrast, for FeC-2 displaying a good heating power, a single distribution was observed in the DLS with a DH of 14.3 ± 1.0 nm. This indicates that
11
inter-particle interactions in solution are a determining factor for explaining the heating properties as previously proposed.
Figure 2. Size distribution of the hydrodynamic diameters measured by DLS for the NPs FeC-2 (a) and FeC-3 (b).
In order to confirm this hypothesis, we studied the intrinsic magnetic properties of FeC-2 and
FeC-3 by dispersing the nanoparticles in tetracosane at 60 °C and performing magnetic
measurements. Tetracosane solidifies at low temperature and freezes the position of the particles in the medium. This then limits the magnetic interactions between the particles (see Table 2). The FeC-1 NPs could not be studied as they were not dispersible due to the presence of the larger agglomerates. A zero-field cooled – field cooled (ZFC/FC) experiment with a µ0H0
of 10 mT was run, together with the hysteresis loops measurements at 300 K and 5 K (see Fig S16-18). Even though the NPs were diluted in tetracosane to very low Fe concentrations (Fe
12
wt% of ~ 0.01%), in both cases the NPs were far from being well-dispersed and strong interactions between the particles still remained. Thus, the apparent superparamagnetic blocking temperature (Tb) at which the ZFC and FC graphs matched was above 300 K, which
we attribute to the agglomerates present at different degree in each sample.48 Higher values of
Hc and Mr, as well as a saturation of the loops at lower amplitudes of magnetic field were found
for FeC-2 in the hysteresis loops at 5 K after dilution in tetracosane, which agrees with weaker interactions in this sample. ZCF/FC curves indicate that both samples are aggregated but no qualitative conclusion on the difference between the two samples can be provided.
To gain a more precise understanding of the magnetic properties of this system, we turned to measurements under dynamic conditions which are more representative of the situation under hyperthermia conditions. We measured the high-frequency hysteresis loops of both samples under an alternating magnetic field of µ0Hrms = 37 mT and 50 kHz using a previously described
set-up.49 The high-frequency hysteresis cycles for the FeC-2 and FeC-3 were completely
different (see Fig S19): FeC-2 displayed a fully opened hysteresis loop with a maximum magnetization at 37 mT of 84 A·m2·kg-1, whereas FeC-3 displayed a very small response to the
magnetic excitation, with an almost reversible response and a maximum magnetization at 37 mT of 28 A·m2·kg-1. The hysteresis area is 23 times larger for FeC-2 than for FeC-3, in
agreement with its much more efficient heating. These results demonstrate that although the magnetic properties of the NPs under static conditions are similar for both systems, their dynamic magnetic properties are not comparable.
13
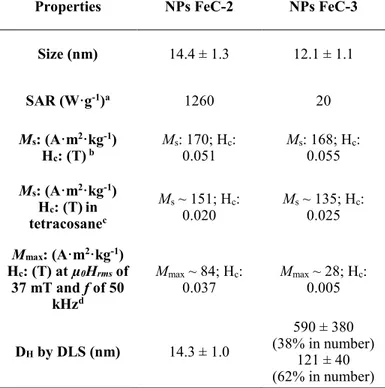
Table 3. Comparison between the heating NPs FeC-2 and non-heating NPs FeC-3.
Properties NPs FeC-2 NPs FeC-3
Size (nm) 14.4 ± 1.3 12.1 ± 1.1 SAR (W·g-1)a 1260 20 Ms: (A·m2·kg-1) Hc: (T) b Ms: 170; Hc: 0.051 Ms: 168; H0.055 c: Ms: (A·m2·kg-1) Hc: (T)in tetracosanec Ms ~ 151; Hc: 0.020 Ms ~ 135; H0.025 c: Mmax: (A·m2·kg-1) Hc: (T) at µ0Hrms of 37 mT and f of 50 kHzd Mmax ~ 84; Hc: 0.037 Mmax0.005 ~ 28; Hc: DH by DLS (nm) 14.3 ± 1.0 590 ± 380 (38% in number) 121 ± 40 (62% in number)
a Measured at 47 mT and 93 kHz. b Ms: Saturation magn. Hc: Coercive field. Measured by VSM at 3T and 300 K. c M
s: Saturation magn. Hc: Coercive field. Measured by VSM at 3 T and 300 K after dilution in tetracosane (Fe
wt% of ~ 0.01%). d M
max: Magnetization at maximum magnetic field (µ0Hrms of 37 mT). Hc: Coercive field. Cycles
were measured in solution at 300 K (10 mg of Fe2.2C NPs in 0.5 mL of Mesitylene).
To have a deeper insight into the origin of the difference in heating between the two samples, high-frequency hysteresis loops for FeC-2 and FeC-3 were recorded as a function of time using the same set-up. A very different behaviour was found between the two samples (see Fig 3). Whereas the hysteresis loops for NPs FeC-2 open with time, reaching their maximum value of area after 60 seconds, the hysteresis cycles of the non-heating NPs FeC-3 remained closed. Fig. S20 displays the evolution of the hysteresis area as a function of time for the two samples. Interestingly, the initial heating power of both samples is quite small and comparable, since the hysteresis area is approximately 0.41 and 0.14 Jˑkg-1 for FeC-2 and FeC-3 respectively.
However, in the case of FeC-2, this value increases up to 7.23 Jˑkg-1 after 60 s without
significant evolution afterwards, whereas it remains in the same range for FeC-3. Similarly, Fig S21 displays the values of Mmax and normalized χm as a function of time for NPs FeC-2 and
14
FeC-3. Whereas the Mmax and χm values remain almost constant for NPs FeC-3, Mmax values
get increased by a factor of 7 and χm values by a factor of 10 for NPs FeC-2 after 60s of exposure
to the alternating magnetic field. This is the clear sign that, in sample FeC-2, the NPs organize into chains which can be macroscopically observed with a naked eye. This organization induces an effective uniaxial anisotropy along the magnetic field direction, which enhances the heating power of the material. In addition, the area of the high-frequency hysteresis loop after 10 s of exposure has a value of 4.04 Jˑkg-1 (see also Fig S20), which is in of the same order of magnitude
as the value measured by calorimetry after the same time of exposure at µ0Hrms of 33 mT and a
f of 93 kHz (5.67 Jˑkg-1). It should be noted that, for experimental reasons, the concentration in
mesitylene of NPs for SAR measurements by calorimetry experiments is ca. 20 mgˑmL-1,
whereas in the dynamic hysteresis measurements it is ca. 10 mgˑmL-1. Qualitatively, we
observed the rapid (1-2 s) formation of chains when the experiments were performed at 5 different concentrations of NPs FeC-2 (from 2 to 40 mgˑmL-1). The discrepancy between the
measurements for FeC-2 and FeC-3 might be due to the fact that larger aggregates are not able to modify their structures to form chains, or that, due to their flux closure magnetic states and the larger inter-aggregate distance, they interact less with each other.
15
Figure 3. High-frequency (50 kHz) hysteresis loops as a function of time for the heating NPs FeC-2 (a) and for the non-heating NPs FeC-3 (b). Magnetic field is given by µ0Hmax (Hmax =
√2Hrms). A µ0Hmax of 47 mT in the graph corresponds to a µ0Hrms of 33 mT.
To the best of our knowledge, this is the first time that high-frequency hysteresis loops as a function of time are measured for characterizing the heating power of MNPs. First, it clearly evidences that heating power can be a time-dependant property, which was overlooked in previous works. Second, the results obtained on these two samples illustrate that time-dependent high-frequency hysteresis loops constitute a precious tool to understand the origin of heating power in solution of MNPs: whereas the two samples we had measured displayed similar magnetic properties under VSM, their heating properties were very different, which is related to the possibility for one of them to organize in solution.
16
Finally, we carried out an additional experiment to observe the formation of chains under hyperthermia conditions. When a drop of the above-mentioned solutions was deposed on a grid in the presence of an alternating magnetic field of µ0Hrms = 33 mT and 93 kHz and left to
evaporate to dryness, the formation of chains of size within the range of 0.5-5 µm that were aligned with the magnetic field direction was clearly observable in the TEM micrographs of
FeC-2 (see Fig 4. and Fig S22). However, in the case of the non-heating NPs FeC-3, no
anisotropic orientation along the magnetic field could be observed and the NPs remained in the form of big amorphous agglomerates.
Figure 4. TEM micrographs of the NPs (a) FeC-2 and (b) FeC-3 when a drop of the
hyperthermia solution was deposed in the TEM grid in the presence of an alternating magnetic field. The images illustrate the orientation of the FeC-2 NPs with the magnetic field, which is responsible of their SAR. Contrary, FeC-3 NPs remain as amorphous agglomerates.
17
We conclude this part by presenting a summary of our view on the mechanism at the origin of heating in these samples. The overall hysteresis loop of assemblies of MNPs is the combined result of i) their physical rotation under the influence of the torque or of thermal agitation, and ii) their magnetization reversal. In our case, we consider that agglomerates of MNPs do not rotate under the influence of the magnetic field because they are rather large objects with a very weak remnant magnetization so the torque they undergone is extremely small. In the case of chains, however, we cannot exclude that part of the reversal is due to their physical rotations, but there is so far no suitable model permitting to easily calculate the reversal time of an anisotropic assembly of nanoparticles. Moreover, even if this model existed, it would require knowing precisely the length and width of the chains during the application of the magnetic field. In any case, whatever the underlying mechanism, Fig. 3(a) illustrates well that the coercive field of the chains is close but below the applied alternating magnetic field, which explains why FeC particles display large heating power upon magnetic moment reversal.
Ligand effects on the heating power of Fe2.2C NPs: reproducible and scalable preparation of
nanoparticles displaying high heating power
The previous results demonstrate that the initial ligand concentration seems to play a crucial role in the carbidization process. This concentration depends on the washing process of the nanoparticles. In this work, we have tried to remove as much ligands as possible before reacting the particles with syngas. This led to Fe-1 NPs with a Fe concentration of 70-80 wt%. Starting from this sample, and in order to slow down the carbidization process in a controlled way avoiding at the same time the formation of the agglomerates observed in NPs FeC-1, a known amount of ligands was added to the NP suspension in mesitylene. In this way, the relation between the nature of the ligands and their concentration in the reaction medium with the SAR of the FeC NPs obtained could be studied.
18
Four different carbidization experiments were carried out (see experimental section for details), starting from the NPs Fe-1 with a Fe content of 73 wt% determined by TGA. In these experiments, various amounts of a 1:1 (by weight) mixture of hexadecylamine (HDA) and palmitic acid (PA), the ligands used for the synthesis of the Fe(0) NPs, were introduced into the reactor before reacting with syngas. The resulting NPs FeC-4 to FeC-7 were thoroughly characterized and their characteristics are summarized in Table 3 (see also Figures S23-28). When carrying out the reaction after addition of solubilizing ligands, all FeC NPs samples could be dispersed in mesytilene and no large agglomerate was observed on the TEM images. In all cases the resulting NPs displayed heating properties in mesitylene solution and a correlation between the SAR and the amount of ligands added before the carbidization process was established. The SAR of the NPs progressively increased when increasing the amount of the 1:1 HDA/PA mixture (see Figure 5). A maximum value of 1700 W·g-1 at a field of µ
0Hrms of
47 mT with a frequency of 93 kHz was obtained for NPs FeC-6 when the reaction was performed starting from a solid sample displaying a 37 wt% Fe content. Further lowering the Fe content down to 24 wt% led to a decrease of the SAR value of NPs FeC-7 to 670 W·g.-1 It
is also interesting to note that syngas consumption at the end of the reaction progressively decreased from FeC-4 to FeC-7, meaning that CO hydrogenation is slowed down when the amount of ligands present in the reaction medium was increased. This observation can be related to the surface accessibility of the nanoparticles. In addition, the crystallite sizes of the Fe2.2C phase determined by the Scherrer equation from the XRD were slightly larger upon
increasing the amount of ligands. In all cases, extending the carbidization time to 6 or 7 days did not lead to any notable difference in the heating power of the FeC NPs.
Then, two carbidization experiments were performed under the reaction conditions in which the highest SAR was obtained, i.e. starting from a Fe content of 37%, but adding only PA
above-19
mentioned techniques (see Fig. S29-33). The nature of the ligand was shown to have a strong influence on the CO hydrogenation rate as deduced from the pressure drop in both experiments at the end of reaction. More precisely, the pressure drop observed was 0.7 bar for FeC-8 and of >1.5 bar for FeC-9, which can be related to the stronger coordination of PA to the NPs as compared to the HDA. In addition, PA was found to produce FeC NPs displaying higher heating power. Thus, the SAR measured for the FeC-8 NPs was 2020 W·g-1 whereas it was only 610
W·g-1 for the FeC-9 NPs when applying a field of µ
0Hrms of 47 mT and a frequency of 93 kHz
(see Figure 5 and Experimental section).
The agglomeration degree was again found to play a role on the heating power, since the
FeC-9 NPs were much more agglomerated than the FeC-8 NPs in agreement with the much better
coordination properties of PA compared to HDA. In addition, on the XRD diffractogram of the
FeC-9 NPs, some peaks corresponding to iron oxide were observed. This can be attributed to
the competition between water resulting from the carbidization process and the amine ligand for iron coordination, competition which is not present when PA is used. NPs FeC-8, were also studied by Mossbauer spectroscopy (see Fig S31). The percentages of the Fe2.2C (69.6%) and
Fe5C2 (24.8%) phases were now comparable to those obtained by Bordet et al. under similar
conditions (71.2% of Fe2.2C and 24.4% of Fe5C2), which displayed also a comparable value of
SAR.
Finally, high-frequency hysteresis loops as a function of time were acquired for NPs FeC-5 and
FeC-8 (see Fig S34-37) at µ0Hrms of 33 mT and a f of 50 kHz at a concentration of ca. 10
mgˑmL-1. The area of the cycles for NPs FeC-5 after 40-60 s were comparable to those found
for NPs FeC-2 (ca. 6-7 mJ·g-1), which agrees with their similar values of SAR obtained by
calorimetry for these samples. The dynamic of chain formation was also comparable, and the hysteresis loops began to open after 1-2 s of exposure to the alternating magnetic field. However, for the NPs FeC-8 displaying the highest value of SAR, the area of the hysteresis
20
loops reached a maximum of 14 mJ·g-1 after 5-10 s of field exposure, but rapidly decreased
because the chains were coming out of the solution as observed in the calorimetry experiments and thus their heating power could not be measured anymore (see Fig S38). Furthermore, chain formation was faster in this case, and the hysteresis loops began to open very rapidly, 0.1 s of exposure to the magnetic field.
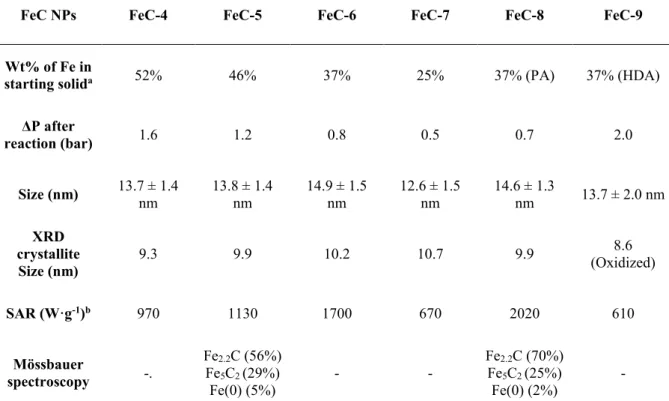
Table 3. Comparison between the characterizations of NPs FeC-4 to FeC-9 prepared by
carbidization of the NPs Fe-1 after addition of different amounts of a 1:1 mixture in mass of HDA/PA, PA or HDA.
FeC NPs FeC-4 FeC-5 FeC-6 FeC-7 FeC-8 FeC-9
Wt% of Fe in
starting solida 52% 46% 37% 25% 37% (PA) 37% (HDA)
ΔP after reaction (bar) 1.6 1.2 0.8 0.5 0.7 2.0 Size (nm) 13.7 ± 1.4 nm 13.8 ± 1.4 nm 14.9 ± 1.5 nm 12.6 ± 1.5 nm 14.6 ± 1.3 nm 13.7 ± 2.0 nm XRD crystallite Size (nm) 9.3 9.9 10.2 10.7 9.9 8.6 (Oxidized) SAR (W·g-1)b 970 1130 1700 670 2020 610 Mössbauer spectroscopy -. Fe2.2C (56%) Fe5C2 (29%) Fe(0) (5%) - - Fe2.2C (70%) Fe5C2 (25%) Fe(0) (2%) -
a After addition of a 1:1 PA/HDA mixture in FeC-4 to FeC-7, PA in FeC-8 or HAD in FeC-9. b Measured at µ
0Hrms
21
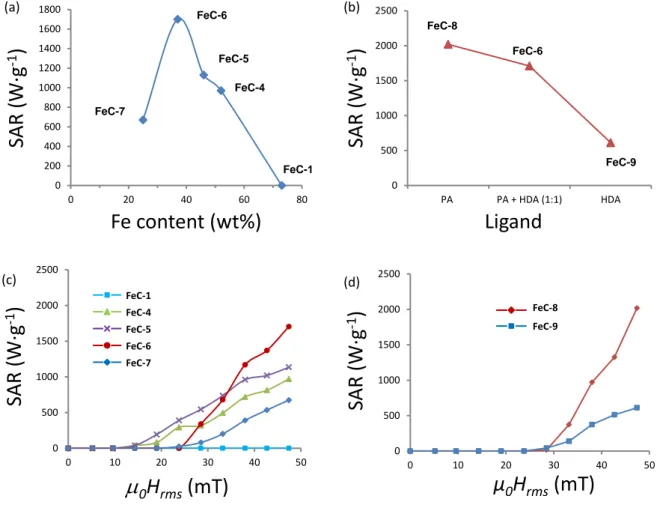
Figure 5. (a) Graphical representation of the SAR measured at a field of µ0Hrms of 47 mT with
a frequency of 93 kHz, as a function of the Fe content of the parent Fe(0) NPs. FeC-1 (no ligands added) NPs FeC-4 to FeC-7 (different amounts of a mixture of 1:1 by weight of HDA/PA were added). (b) Graphical representation of the SAR as a function of ligands mixture for NPs FeC-6, FeC-8 and FeC-9 (when PA:HDA, PA or HDA were respectively used). (c) Comparison of the heating power of the NPs FeC-1 and FeC-4 to FeC-7 at 93 kHz and (d) comparison of the heating power of the NPs FeC-8 and FeC-9 at 93 kHz
All these experiments show that, in order to obtain FeC NPs displaying a good heating power, the presence of an optimum quantity of ligands is necessary (ca. 100 wt% respect to the Fe(0) NPs). The role that the ligands play in the reaction mechanism is to prevent the agglomeration of the NPs in solution and to slow down the carbon incorporation rate (see Scheme 1).
0 200 400 600 800 1000 1200 1400 1600 1800 0 20 40 60 80 FeC-1 FeC-4 FeC-5 FeC-7 FeC-6
SAR (
W·g
-1)
Fe content (wt%)
(a) 0 500 1000 1500 2000 2500 PA PA + HDA (1:1) HDA FeC-9 FeC-8 FeC-6SAR
(
W·g
-1)
Ligand
(b) 0 500 1000 1500 2000 2500 0 10 20 30 40 50SAR
(W·g
-1)
m
0H
rms(mT)
FeC-1 FeC-4 FeC-5 FeC-6 FeC-7 (c) 0 500 1000 1500 2000 2500 0 10 20 30 40 50μ
0H
rms(mT)
FeC-9 FeC-8 (d)SAR
(W·g
-1)
22
The mobility in solution of well-dispersed FeC NPs is an important factor to obtain high SAR values. The nature of the ligand also influences the preparation of FeC NPs. PA coordinates more strongly to the surface of the Fe(0) NPs than HDA.42 The oxidation of the NPs FeC-9
observed in the XRD is in agreement with this hypothesis. If HDA gives weaker interactions with the NPs, they are more prone to react with the water that is generated in the carbidization process leading to partial oxidation of the surface. In addition, PA may assist the shift of the surface-coordinated hmds by protonation, hence helping to avoid the formation of the Si containing amorphous layer that embeds the agglomerates composing the non-heating NPs
FeC-1. Understanding the influence of the reaction conditions allowed preparing
reproductively and in a scalable way NPs FeC-8, which display the highest heating power in this work (ca. 2000 Wˑg-1) at a field of µ
23
Scheme 1. Schematic representation of the role of the ligands into the heating properties of the
Fe2.2C NPs.
CONCLUSIONS
In this work, in order to scale-up the reproducible synthesis of highly heating magnetic nanoparticles and to understand their heating mechanism, we have extended our previous studies concerning the synthesis under syngas of FeC NPs by carbidization of pre-formed Fe(0) NPs. We have studied their structure and their heating properties in detail. We have discovered a surprising effect of the extended washing of the starting Fe(0) nanoparticles. When the
24
nanoparticles surface is depleted of its ligands after extended washing, the particles are strongly and irreversibly agglomerated and cannot align in an alternating magnetic field. The result is the absence of heating properties of these nanomaterials. Control over the ligands concentration on the surface of the NPs is therefore a pre-requisite to prepare nanoparticles displaying a controllable and reproducible heating power. In parallel, this work explores the heating mechanism in magnetic nanoparticles, demonstrates the importance of dynamic magnetic measurements and brings forward a new indication of the importance of dipolar interactions, here specifically in solution, for controlling the heating power of magnetic materials.
Finally, when controlling the Fe concentration at the beginning of the reaction, the carbidization process showed good reproducibility and scalability. We believe that this work represents an important advance in the synthetic control of well-dispersed homogeneous magnetic NPs, here FeC NPs, displaying reliable heating properties in the objective of future applications.
CONCFLICTS OF INTEREST
The authors declare no conflict of interest
AKNOWLEDGMENTS
The authors thank ERC Advanced Grant (MONACAT 2015-694159) for financial support, J.-F. Meunier for Mössbauer measurements and Jérôme Esvan and Simon Tricard for the XPS measurements.
NOTES AND REFERENCES
1. D. H. Ortgies, F. J. Teran, U. Rocha, L. de la Cueva, G. Salas, D. Cabrera, A. S. Vanetsev, M. Rähn, V. Sammelselg, Y. V. Orlovskii and D. Jaque, Advanced Functional
25
2. J. Yu, F. Chen, W. Gao, Y. Ju, X. Chu, S. Che, F. Sheng and Y. Hou, Nanoscale Horiz., 2017, 2, 81-88.
3. E. A. Perigo, G. Hemery, O. Sandre, D. Ortega, E. Garaio, F. Plazaola and F. J. Teran,
Appl. Phys. Rev., 2015, 2, 041302/041301-041302/041335.
4. A. Meffre, B. Mehdaoui, V. Connord, J. Carrey, P. F. Fazzini, S. Lachaize, M. Respaud and B. Chaudret, Nano Lett., 2015, 15, 3241-3248.
5. A. Bordet, L.-M. Lacroix, P.-F. Fazzini, J. Carrey, K. Soulantica and B. Chaudret,
Angew. Chem., Int. Ed., 2016, 55, 15894-15898.
6. S. Ceylan, C. Friese, C. Lammel, K. Mazac and A. Kirschning, Angew. Chem., Int. Ed., 2008, 47, 8950-8953.
7. S. Ceylan, L. Coutable, J. Wegner and A. Kirschning, Chem. - Eur. J., 2011, 17, 1884-1893, S1884/1881-S1884/1818.
8. J. Hartwig, S. Ceylan, L. Kupracz, L. Coutable and A. Kirschning, Angew. Chem., Int.
Ed., 2013, 52, 9813-9817.
9. P. M. Mortensen, J. S. Engbaek, S. B. Vendelbo, M. F. Hansen and M. Oestberg, Ind.
Eng. Chem. Res., 2017, 56, 14006-14013.
10. WO2014162099A1, 2014.
11. M. G. Vinum, M. R. Almind, J. S. Engbaek, S. B. Vendelbo, M. F. Hansen, C. Frandsen, J. Bendix and P. M. Mortensen, Angew. Chem., Int. Ed., 2018, 57, 10569-10573.
12. A. B. Salunkhe, V. M. Khot and S. H. Pawar, Curr. Top. Med. Chem., 2014, 14, 572-594.
26
13. N. A. Usov, J. Appl. Phys., 2010, 107, 123909/123901-123909/123912.
14. J. Carrey, B. Mehdaoui and M. Respaud, J. Appl. Phys., 2011, 109, 083921/083921-083921/083917.
15. C. L. Dennis, A. J. Jackson, J. A. Borchers, R. Ivkov, A. R. Foreman, J. W. Lau, E. Goernitz and C. Gruettner, J. Appl. Phys., 2008, 103, 07A319/311-307A319/313.
16. F. Burrows, C. Parker, R. F. L. Evans, Y. Hancock, O. Hovorka and R. W. Chantrell, J.
Phys. D: Appl. Phys., 2010, 43, 474010/474011-474010/474010.
17. C. L. Dennis, A. J. Jackson, J. A. Borchers, P. J. Hoopes, R. Strawbridge, A. R. Foreman, J. van Lierop, C. Gruttner and R. Ivkov, Nanotechnology, 2009, 20, 395103/395101-395103/395107.
18. C. Haase and U. Nowak, Phys. Rev. B: Condens. Matter Mater. Phys., 2012, 85, 045435/045431-045435/045435.
19. B. Mehdaoui, R. P. Tan, A. Meffre, J. Carrey, S. Lachaize, B. Chaudret and M. Respaud,
Phys. Rev. B: Condens. Mater Mater. Phys., 2013, 87, 174419/174411-174419/174410.
20. C. Martinez-Boubeta, K. Simeonidis, D. Serantes, I. Conde-Leboran, I. Kazakis, G. Stefanou, L. Pena, R. Galceran, L. Balcells, C. Monty, D. Baldomir, M. Mitrakas and M. Angelakeris, Adv. Funct. Mater., 2012, 22, 3737-3744, S3737/3731-S3737/3738.
21. R. P. Tan, J. Carrey and M. Respaud, Phys. Rev. B: Condens. Matter Mater. Phys., 2014,
90, 214421/214421-214421/214412, 214412 pp.
22. D. Serantes, K. Simeonidis, M. Angelakeris, O. Chubykalo-Fesenko, M. Marciello, M. d. P. Morales, D. Baldomir and C. Martinez-Boubeta, The Journal of Physical Chemistry C, 2014, 118, 5927-5934.
27
23. E. Myrovali, N. Maniotis, A. Makridis, A. Terzopoulou, V. Ntomprougkidis, K. Simeonidis, D. Sakellari, O. Kalogirou, T. Samaras, R. Salikhov, M. Spasova, M. Farle, U. Wiedwald and M. Angelakeris, Sci. Rep., 2016, 6, 37934.
24. K. Simeonidis, M. P. Morales, M. Marciello, M. Angelakeris, P. de la Presa, A. Lazaro-Carrillo, A. Tabero, A. Villanueva, O. Chubykalo-Fesenko and D. Serantes, Sci. Rep., 2016, 6, 38382.
25. J. G. Ovejero, D. Cabrera, J. Carrey, T. Valdivielso, G. Salas and F. J. Teran, Phys.
Chem. Chem. Phys., 2016, 18, 10954-10963.
26. R. Das, J. Alonso, Z. Nemati Porshokouh, V. Kalappattil, D. Torres, M.-H. Phan, E. Garaio, J. A. Garcia, J. L. Sanchez Llamazares and H. Srikanth, J. Phys. Chem. C, 2016, 120, 10086-10093.
27. C. Blanco-Andujar, D. Ortega, P. Southern, Q. A. Pankhurst and N. T. K. Thanh,
Nanoscale, 2015, 7, 1768-1775.
28. F. M. Martin-Saavedra, E. Ruiz-Hernandez, A. Bore, D. Arcos, M. Vallet-Regi and N. Vilaboa, Acta Biomater., 2010, 6, 4522-4531.
29. Z. Li, M. Kawashita, N. Araki, M. Mitsumori, M. Hiraoka and M. Doi, J. Biomater.
Appl., 2011, 25, 643-661.
30. E. M. Muzquiz-Ramos, V. Guerrero-Chavez, B. I. Macias-Martinez, C. M. Lopez-Badillo and L. A. Garcia-Cerda, Ceram. Int., 2015, 41, 397-402.
31. P. Drake, H.-J. Cho, P.-S. Shih, C.-H. Kao, K.-F. Lee, C.-H. Kuo, X.-Z. Lin and Y.-J. Lin, J. Mater. Chem., 2007, 17, 4914-4918.
28
32. K. H. Bae, M. Park, M. J. Do, N. Lee, J. H. Ryu, G. W. Kim, C. Kim, T. G. Park and T. Hyeon, ACS Nano, 2012, 6, 5266-5273.
33. P. Guardia, R. Di Corato, L. Lartigue, C. Wilhelm, A. Espinosa, M. Garcia-Hernandez, F. Gazeau, L. Manna and T. Pellegrino, ACS Nano, 2012, 6, 3080-3091.
34. A. Meffre, B. Mehdaoui, V. Kelsen, P. F. Fazzini, J. Carrey, S. Lachaize, M. Respaud and B. Chaudret, Nano Lett., 2012, 12, 4722-4728.
35. C. Yang, H. Zhao, Y. Hou and D. Ma, J. Am. Chem. Soc., 2012, 134, 15814-15821. 36. Z. Yang, T. Zhao, X. Huang, X. Chu, T. Tang, Y. Ju, Q. Wang, Y. Hou and S. Gao,
Chem. Sci., 2017, 8, 473-481.
37. Z.-Y. Wu, X.-X. Xu, B.-C. Hu, H.-W. Liang, Y. Lin, L.-F. Chen and S.-H. Yu, Angew.
Chem. Int. Ed., 2015, 54, 8179-8183.
38. S. Y. Hong, D. H. Chun, J.-I. Yang, H. Jung, H.-T. Lee, S. Hong, S. Jang, J. T. Lim, C. S. Kim and J. C. Park, Nanoscale, 2015, 7, 16616-16620.
39. K. Xu, B. Sun, J. Lin, W. Wen, Y. Pei, S. Yan, M. Qiao, X. Zhang and B. Zong, Nat.
Commun., 2014, 5, 5783.
40. F. Dumestre, B. Chaudret, C. Amiens, P. Renaud and P. Fejes, Science, 2004, 303, 821. 41. C. Desvaux, C. Amiens, P. Fejes, P. Renaud, M. Respaud, P. Lecante, E. Snoeck and B. Chaudret, Nat. Mater., 2005, 4, 750-753.
42. L.-M. Lacroix, S. Lachaize, A. Falqui, M. Respaud and B. Chaudret, J. Am. Chem. Soc., 2009, 131, 549-557.
29
43. A. Meffre, S. Lachaize, C. Gatel, M. Respaud and B. Chaudret, J. Mater. Chem., 2011,
21, 13464-13469.
44. A. Bordet, L.-M. Lacroix, K. Soulantica and B. Chaudret, ChemCatChem, 2016, 8, 1727-1731.
45. B. Mehdaoui, A. Meffre, L. M. Lacroix, J. Carrey, S. Lachaize, M. Gougeon, M. Respaud and B. Chaudret, J. Magn. Magn. Mater., 2010, 322, L49-L52.
46. Y. Sun, Q. Wang, Z. Qu and M. Shi, Key Eng. Mater., 2012, 512-515, 1424-1428. 47. X. Batlle, M. G. Del Muro and A. Labarta, Phys. Rev. B: Condens. Matter, 1997, 55, 6440-6445.
48. M. Mikhaylova, D. K. Kim, N. Bobrysheva, M. Osmolowsky, V. Semenov, T. Tsakalakos and M. Muhammed, Langmuir, 2004, 20, 2472-2477.
49. V. Connord, B. Mehdaoui, R. P. Tan, J. Carrey and M. Respaud, Rev. Sci. Instrum., 2014, 85, 093904/093901-093904/093908.