HAL Id: hal-03086660
https://hal.archives-ouvertes.fr/hal-03086660
Submitted on 22 Dec 2020
HAL is a multi-disciplinary open access archive for the deposit and dissemination of sci-entific research documents, whether they are pub-lished or not. The documents may come from teaching and research institutions in France or abroad, or from public or private research centers.
L’archive ouverte pluridisciplinaire HAL, est destinée au dépôt et à la diffusion de documents scientifiques de niveau recherche, publiés ou non, émanant des établissements d’enseignement et de recherche français ou étrangers, des laboratoires publics ou privés.
of 14N16O2
Agnès Perrin, L. Manceron, J.-M. Flaud, F. Kwabia-Tchana, R. Armante, P.
Roy, D. Doizi
To cite this version:
Agnès Perrin, L. Manceron, J.-M. Flaud, F. Kwabia-Tchana, R. Armante, et al.. The new nitro-gen dioxide (NO2) linelist in the GEISA database and first identification of the ν1+2ν3-ν3 band of 14N16O2. Journal of Molecular Spectroscopy, Elsevier, 2020, pp.111394. �10.1016/j.jms.2020.111394�. �hal-03086660�
The new nitrogen dioxide (NO2) linelist in the GEISA database and first
iden-tification of the ν1+2ν3-ν3 band of 14N16O2
Agnès Perrin, L. Manceron, J.-M. Flaud, F. Kwabia-Tchana, R. Armante, P. Roy, D. Doizi
PII: S0022-2852(20)30162-4
DOI: https://doi.org/10.1016/j.jms.2020.111394
Reference: YJMSP 111394
To appear in: Journal of Molecular Spectroscopy
Received Date: 21 September 2020 Revised Date: 30 October 2020 Accepted Date: 21 November 2020
Please cite this article as: A. Perrin, L. Manceron, J.-M. Flaud, F. Kwabia-Tchana, R. Armante, P. Roy, D. Doizi, The new nitrogen dioxide (NO2) linelist in the GEISA database and first identification of the ν1+2ν3-ν3 band of 14N16O
2, Journal of Molecular Spectroscopy (2020), doi: https://doi.org/10.1016/j.jms.2020.111394
This is a PDF file of an article that has undergone enhancements after acceptance, such as the addition of a cover page and metadata, and formatting for readability, but it is not yet the definitive version of record. This version will undergo additional copyediting, typesetting and review before it is published in its final form, but we are providing this version to give early visibility of the article. Please note that, during the production process, errors may be discovered which could affect the content, and all legal disclaimers that apply to the journal pertain.
The new nitrogen dioxide (NO
2) linelist in the GEISA database; first
identification of the
1+2
3-
3band of
14N
16O
2.
Agnès Perrina,*L. Manceron b,c, J.-M. Flaudd, F. Kwabia-Tchana d, R. Armante a P.Royb D. Doizi e
aLaboratoire de Météorologie Dynamique/IPSL, UMR CNRS 8539, Ecole Polytechnique, Université Paris-Saclay,
RD36, 91128 Palaiseau Cedex, France
.b Ligne AILES, Synchrotron SOLEIL, L’Orme des Merisiers, St-Aubin BP48, 91192 Gif-sur-Yvette Cedex,
France.
c Sorbonne Université, CNRS, MONARIS, UMR 8233, 4 place Jussieu, Paris, F-75005 France
d Laboratoire Interuniversitaire des Systèmes Atmosphériques (LISA), UMR CNRS 7583, Université de Paris et
Université Paris Est Créteil, Institut Pierre Simon Laplace (IPSL), 61 Avenue du Général de Gaulle, F-94010 Créteil Cedex, France
e Université Paris-Saclay, CEA, Service d’Etude du Comportement des Radionucléides, 91191, Gif-sur-Yvette,
France
Number of tables: 5 Number of figures: 11
* Corresponding author: agnes.perrin@lmd.ipsl.fr,
Keywords: Nitrogen dioxide; 14N16O
2; Fourier transform spectroscopy; Electron spin-rotation
Abstract
We have generated new lists of line position, line intensity and line shape parameters of nitrogen dioxide (14N16O
2 and 15N16O2), here labeled as “GEISA-19”, which have been included
in the (Gestion et Etude des Informations Spectroscopiques Atmosphériques) GEISA database (https://geisa.aeris-data.fr/). Except for the far infrared and the 13.3 µm regions, all spectral regions of the 1153- 4775 cm-1 spectral domain are significantly modified by this major update
of the GEISA linelist. For the 6.2 µm and 3.4 µm spectral regions, which correspond to the strongest absorption of NO2, we proceed to a complete replacement of the lists for the first hot
bands, 2 + 3-2 and 1 +2 + 3-2, respectively, and to the inclusion, whenever possible, of
higher order hot bands involving the (1,0,0), (0,2,0) and (0,0,1), (1,1,0), (2,0,0) or (0,0,2) states as lower states. Also, the 1 + 3 linelist was improved for high rotational quantum numbers and
the 3 and 1+3 bands for 15N16O2, which is the second most abundant isotopologue of NO2,
are now included in the database. Finally several weak cold bands in the 2.2 to 4.9 µm region were added for the first time to the GEISA linelist. These new vibration rotation transitions were generated using existing literature data or making use of experimental data extracted from high resolution Fourier transform spectra recorded at SOLEIL for the purpose of this study. One outcome of this study was the first identification of the 1+23-3 hot band, leading to the
first determination of the (1,0,2) energy level parameters. Also, an improved set of parameters was derived for the (0,1,1) state. The validation of the GEISA-19 linelist was performed through a detailed comparison at 296K between computed and observed Fourier transform laboratory spectra. Also, the consistency, from one band to another, of the energy levels values was carefully checked. Finally inter-comparisons and verifications were performed using the recent versions of the HITRAN (https://hitran.org/) and HITEMP databases [R.J. Hargreaves, I. E. Gordon, L. S. Rothman, S. A. Tashkun, V. I. Perevalov, A. A. Lukashevskaya, S. N. Yurchenko, J. Tennyson, and H. S.P. Müller. J. Quant. Spectrosc. Radiat. Transf. 232 35
(2019)]. Our conclusions are that, at 296K, GEISA-19 is of better quality than HITRAN2016-updated or HITEMP in the overall 1153- 4775 cm-1 spectral region. As compared to its previous
version, this new linelist will lead to an improved quality of the NO2 retrievals that will be
performed for the future IASI-NG (Infrared Atmospheric Sounding Interferometer New Generation) satellite instrument (https://iasi-ng.cnes.fr/fr). However, contrary to HITEMP, GEISA-19 which does not include transitions involving high rotational quantum numbers or belonging to very high order hot bands cannot be used for hot temperature conditions.
I. Introduction
Because of its important role in the photochemistry of the atmosphere, nitrogen dioxide has been the subject of numerous spectroscopic studies. These led to the generation of linelists which are now included in the GEISA [1], HITRAN [2], and HITEMP [3] databases.
Until very recently (2016), the linelists present in the 2016 version of HITRAN [2] and in the 2015 version of GEISA [1] for nitrogen dioxide did not differ significantly. This 2015 version of the NO2 linelist, which concerns only the 14N16O2 isotopomer, will be noted as
“HITRAN-GEISA-15” in the rest of the text. For the 14N16O
2 species, four spectral regions are
considered in HITRAN-GEISA-15 which correspond to the microwave to far infrared region (pure rotation within the (0,0,0) state), the 13.3 µm (2 band), the 6.2 µm (the strong 3 band
and the weaker 1 and 22 dark resonating bands) and 3.4 µm (the rather strong 1+3 band and
the weaker 1+22 dark resonating band) regions, respectively. Together with these cold bands,
the HITRAN-GEISA-15 list includes in all four regions lines from the first hot bands which involve the (0,1,0) state as lower vibrational state. These linelists were generated at different time, and with different accuracy, and as it will be discussed in this paper, HITRAN-GEISA-15 presents clear deficiencies.
The most recent version of the HITEMP (“HIgh-TEMPerature molecular spectroscopic database") linelist includes NO2 for the first time [3]. The aim of HITEMP is to model gas phase
spectra for high-temperature applications. For NO2, a composite HITEMP linelist was
generated in the 0- 4775 cm-1 by extending the current HITRAN linelist [2] (here labelled as
HITRAN2016-updated”)1 using inputs from the recent “Nitrogen Dioxide Spectroscopic
Databank” (NDSD-1000) [4,5] line list. These additional inputs concern all spectral regions except the pure rotations bands (microwave to far infrared). For the vibrational transitions already considered in HITRAN, the NDSD-1000 has provided extension of the current list up to the higher N (N100) and Ka values. HITEMP also includes linelists for several cold and hot
bands2 which, up to now, were missing in HITRAN-GEISA-15. Up to now, HITEMP does not
include linelists for the 15N16O
2 (second) isotope species of nitrogen dioxide.
Subsequently, the “HITRAN2016-updated”, the 2020 version of HITRAN, was created [6]. The 1153-4775 cm-1 spectral range now include lines from several weaker
vibration-rotation bands present in HITEMP which were not considered previously in HITRAN-GEISA-15 [1,2]. More recently, the spectral range for NO2 has been extended to include transitions
between 5720-8000 cm-1, with the addition of several combination and overtone bands [7-&15].
Finally, HITRAN2016-updated now includes line parameters for the 3 band of 15N16O2 [16]
which is the most abundant daughter isotopologue of NO2.
Therefore, as compared to the previous version of HITRAN [2], both HITRAN2016-updated and HITEMP [3] databases were significantly extended. However, the existing deficiencies in HITRAN-GEISA-15 were not corrected.
The purpose of the present work was to generate a new version of GEISA linelist for NO2, here identified as ‘GEISA-19”, which now includes NO2 lines parameters for the 0 –
4775.3 cm-1 region.3 As far as the line positions and intensities are concerned, this update does
not concern the microwave to far infrared region, while all other spectral regions took benefit of new parameters generated during this work.
For the 6.2 µm and 3.4 µm regions which correspond to the strongest NO2 infrared
absorption, we process to the replacement of the cold and of «first» hot bands, and GEISA-19 now includes, when possible, line parameters from higher order hot bands. We also implement in GEISA-19 linelists for several weak cold bands that absorb in the 2000- 4775 cm-1 spectral
range. In addition, GEISA-19 includes linelists for the 3 and 1+3 bands for the 15N16O2
isotopic species.
Therefore, it is clear that the GEISA-19 linelist differs from HITRAN-GEISA-15, HITRAN2016-updated [6], and HITEMP [3].
The present work was performed using, as input to our calculations, not only the spectroscopic data available in the literature but also additional data issued from two recent spectroscopic 2 In the rest of the paper, we will designate as “first”, “second”, “third” and “fourth” hot bands the
vibrational bands involving, as lower vibrational state, the (0,1,0) state, one of the states belonging to the first triad {(1,0,0),(0,2,0),(0,0,1)}, second triad {(1,1,0),(0,3,0),(0,1,1)}, or first hexade {(2,0,0),(1,2,0),(1,0,1), (0,4,0), {(0,2,1), (0,0,2)} of interacting states of NO2, respectively.
studies (Refs. [17] and [18]), or obtained from the analysis of two new FTS spectra recorded during this work.
Before going into detail description of the work, we will define the vibrational and rotational quantum numbers and the energy levels used in this paper. Then we will describe the theoretical models used for the computations.
II General considerations
II-A The NO2 vibrational and rotational quantum numbers
Nitrogen dioxide (14N16O
2) is an asymmetric rotor, with three vibrational modes, 1, 2,
which are symmetric and 3 which is antisymmetric, and the vibrational modes are noted as
(v1,v2,v3). As a matter of consequence, the vibrational states are grouped in polyads of
interacting states. When necessary, the rovibrational interactions were accounted for in order to reproduce the measured line positions and intensities, and the present computations were performed polyad by polyad.
This molecule possesses an unpaired electron, and the electron spin-rotation interaction causes a doublet structure which is usually observable in the infrared. In addition, the hyperfine structure due to the I=1 nuclear spin is observable in the microwave, far infrared and 13.3 µm regions [19, 20]. This work deals with the computation of line positions and intensities in the 1000- 4775.3 cm-1 spectral range. Therefore, only four (N, K
a, Kc, and J) rotational quantum
numbers are considered for the upper and lower energy levels. The N, Ka and Kc are the main
rotational quantum numbers. Because the electronic spin-rotation interaction has to be considered, the J quantum number (associated to J=N+S (with S=1/2)) is indicated by a “+” and “-“ flag.
II B Definition of the upper EU and lower EL state energy levels.
Each given vibration spin-rotation transition located at a position is then identified by its
v1U,v2U,v3U
NU,KaU,KUc ,JU
and
v1L,vL2,vL3
NL,KaL,KcL,JL
upper and lower state vibration and rotational quantum numbers. For each considered transition, the HITRAN-GEISA-15, HITRAN2016-updated and HITEMP databases include the value of the lower stateconsidered transition (EU=EL+). Within these databases one should expect that the individual
values of EL (resp. of EU ) should be consistent from one given vibration –transition band to the
other one, provided that they involve the same lower
v1L,vL2,v3L
NL,KaL,KLc,JL
(resp. same upper
v1U,vU2 ,vU3
NU,KaU,KcU,JU
) vibrational spin-rotational level.III Line position, line intensity and line shape parameters
During this work the linelists for numerous vibration – rotation bands were generated in the 1153- 4775.4 cm-1 spectral region, and the theoretical models used to compute the line
positions and intensities account both for the spin- rotation resonances and for various vibration – rotational resonances.
III-A Line positions
For the computation of the energy levels, the Hamiltonian matrix involves in its v- diagonal blocks the sum of Watson’s type rotational [21] and of electronic spin rotational interaction operators [22]. These v- type operators are written for an A-type reduction and in an Ir representation. The
v- off diagonal operators are Fermi-type orC-3 2 1,v ,v
v
v1',v'2,v3'
type Coriolis operators, for |v3|=even and |v3|=odd, respectively. Starting with the first triad
of interacting states {(1,0,0),(0,2,0),(0,0,1)}, strong second order C-type Coriolis resonances are coupling together the spin-rotational levels of the (v1, v2, v31) and (v1, v22, v3) vibrational
states. In addition, a first order C-type Coriolis resonance may have to be accounted for the (v1
1, v2, v31) and (v1, v2, v3) resonating energy levels involving rather high Ka values [23, 18].
In the rest of the paper, the generic term “energy level parameters” will designate the set of vibrational energies, rotational, spin- rotation, and coupling constants which are associated to a given block of interacting vibration states of NO2.
Several of the computations performed during this study were done using the energy level parameters quoted in the literature, and the form of the Hamiltonian matrices used during these calculations are explicitly described in the attached papers. However, during this work we could make use of new FTS spectra recorded at 6.3 µm and 4.8 µm during this work and of a spectrum recorded at 3.4 µm in Ref. [18] which allowed a detailed investigation of several hot bands. Using these results, we could perform an update of the energy level parameters for the {(0,3,0),(0,1,1)} interacting states and generate the first existing set of energy level parameters
for the {(1,2,1),(1,0,2)} interacting states. The Hamiltonian matrices used during these two computations are given in Table 1.
III-B Line intensities
A detailed description of the method which is used to compute the NO2 line intensities was
given in Refs. [23, 24]. The intensity, , of a line of a pure 14N16O
2 isotopic sample is
T kN
~
given (in cm–1/(moleculecm–2)) by :
Eq.(1)
U L L L 0 3 iso N ~ R T Z g kT ~ exp 1 kT E p ex hc 3 4 ~ π 8 a T k In this expression, aiso is the isotopic concentration of the considered isotopic species
(a14=0.991616 and a15=0.00364 for 14N16O2 and 15N16O2, respectively [25]).
EUE / hcL
is the wavenumber of the transition, and EL and EU are the energies of lower and upper levels ofthe transition (in cm-1). The total partition function, Z(T) = Z
vib(T)Zrot(T), is Z14(296 K) =
13618 for 14N16O
2 which includes the nuclear spin contribution (g14Nuclear 2I13) (resp.
Z15(296 K)=9324.7, and g15Nuclear 2I12, for 15N16O2).
Finally, Uis the square of the matrix element of transformed transition moment operator for
L
R
the considered band. Let us remind that, as for line positions, the intensity computations account of the vibration-rotation resonances, of the centrifugal distortion effects, and of the electron- spin rotation resonances.
For the line intensities of the strong 3 band at 6.2 µm and for the rather strong 1+3 at
2.3 µm of 14N16O
2 and 15N16O2 we used the expansion of the transition moment parameter given
in Ref. [23] and Ref. [26], respectively. For the transition moment operators of the hot bands associated to 3 and 1+3 bands, at 6.2 µm and 2.3 µm, we used the harmonic approximation,
which leads to:
Eq. (2-a)
and Eq.( 2-b) ' Z 1 , 0 , 1 0 , 0 , 0 3 1 ' Z 1 v , v , 1 v v , v , v1 2 3 1 2 3 v v
During this work, several weak cold bands were also considered for GEISA-19, and details on the line intensity parameters that we used for these bands are given in the text.
III-C Line shape parameters
In Ref. [27], Benner et al. measured a very complete set of accurate line shape parameters for the 3 band of NO2. Following these results, polynomial expansions in ‘m’
(m=Nlower for P or Q lines, and m= Nupper for the R transitions) were proposed for the air-
broadening linewidths (Air ) and their associated “n”- temperature dependences and for the
pressure shift (0) parameters.
The polynomial expressions achieved for Air and “n” in Ref. [27] for the 3 band were
implemented for all vibrational bands in the GEISA-19 database. This means that we assume that the vibrational dependence of Air and “n” is negligible. More precisely, the air broadening
linewidths (Air ) were computed using the ‘m’ polynomial expressions that are quoted for Ka=0
to Ka=8 in Figs. 5 of Ref. [27], and for larger Ka values ( Ka >8) we used the Ka=8 expression.
These polynomial expressions can lead, for large “m” values, to unreasonably weak values for Air : in such conditions, we fixed Air to a default value (DefaultAir =0.06 cm-1/atm) which
corresponds to the asymptotic behaviour of the plots presents on Figs. 5 of Ref. [27]. For the air broadening associated “n”- temperature dependences, we used the expression quoted in Fig. 8 of Ref. [27].
As far as the 0 pressure shifts are concerned, we used the “m”- expansions given on
Fig. 9 of Ref. [27] for the 3 bands of the 14NO2 and 15NO2 species, while for other vibrational
bands, the pressure shifts were set to a (default) zero value. This is because it was established that the results on pressure shifts for the 3 band are not transferable to any other vibrational
band [28]. Finally, the default value Self=0.095 cm-1/atm [29] was set up for the self-broadening
parameters.
This strategy clearly differs clearly from the one which was adopted in HITRAN2016-updated and HITEMP, where a vibrational dependence of the air- broadening and self linewidths, of the “n”- temperature dependence of air- broadening linewidth, and of the pressure
line shift parameters was computed (see Ref. [3] and Ref. [5] and references therein), starting from the experimental results of Ref. [27].
Therefore, our computed line shape parameters differ from those quoted in HITEMP and HITRAN2016-updated.
IV. Experimental details
Three high-resolution absorption spectra (FTS12, FTS3 and FTS3bis) of nitrogen dioxide were recorded on the Bruker IFS125HR Fourier transform spectrometer of the AILES Beamline at Synchrotron SOLEIL, coupled to the newly developed corrosive gas multipass cell [30] set to a 10.88 m path length. For the spectrum in the 1+ 2 region, (FTS12) the cell path
length was set to 10.88 m, the interferometer was equipped with a Si/CaF2 beam splitter and an
InSb detector. The spectral resolution was chosen to give an apparatus function (0.0028 cm-1)
smaller than the Doppler width (ca. 0.0048 cm-1) in the considered spectral domain. The instrument was operated with a 1.3mm diameter entrance aperture and a quartz-halogen source, as the synchrotron source presents no advantage at this resolution in this spectral domain. For the second spectrum, in the 3 region, (FTS3 and FTS3bis), the cell path length was set to 2.72m
and a Ge/KBr beamsplitter, a home-made 4K-cooled HgCdTe with a 1180-1880 cm-1 cold band
pass filter and 1.2 mm aperture [31] were used. The instrument was operated with a 1.3mm aperture and at 0.002cm-1 resolution, well below the Doppler width. The spectrometer was
evacuated to about 5×10⁻⁵ hPa in order to minimize H
2O and CO2 absorptions. Spectra were
ratioed against single channel background spectra of the empty cell, recorded at a resolution of 0.04 cm-1 in order to ensure the best possible signal-to-noise in the ratioed spectrum. For the
Fourier transform, a Mertz-phase correction with 2 cm-1 phase resolution, a zero-filling factor
of 2 and no apodization (boxcar option) were applied to the averaged interferograms (880 scans). The spectra were calibrated with residual CO2 or H2O lines observed in the spectra with
their wavenumbers taken from HITRAN database [2]. The standard deviation after calibration with well isolated reference gas lines is 0.00005 cm-1(1). Thus, the estimated frequency
accuracy of our measured lines is thus close to the lines reported accuracy (0.0001 cm-1),
The NO2 gas bottle used (Sigma-Aldrich, France 99.5%) was found to contain NO, N2O and
other impurities at a much higher level than the stated purity. It was then first purified following the standard procedure [23] by pumping on the frozen solid at about 200K until the bluish colour due to N2O3 disappeared. This eliminated most of the impurities. We thus added a further step
by letting 5 mmoles of the gas mixture react with about 0.5 mmole of ozone, prepared separately from 99.999% pure O2. The remaining ozone and oxygen were removed by pumping above the
mixture re-cooled to about 210K. This successfully removed the NO and N2O traces. The total
pressures were measured using a Pfeiffer 10 hPa capacitive gauge. A small contamination due to CO2 remained visible, but could be estimated to about 0.2% of the gas sample, using IR
integrated intensity measurements.
In the near infrared, 1+2 region, the sample gas pressure used was 5.1± 0.1 hPa. Assuming a
negligible contribution of foreign gases, the total pressure can be attributed to the mixing of the monomer (NO2) and dimer (N2O4) forms of nitrogen dioxide. These two forms exist in
equilibrium, according to the equation (O2 N2O4), with: P2 (NO
2) = KP P (N2O4) Eq. (3)
where KP is the equilibrium constant between NO2 and N2O4, whose value depends on
temperature [32] (at 296K, Kp = 123.3 hPa) P(NO2) and P(N2O4) are the partial pressures of the
monomer and dimer, respectively. In such conditions, the monomer (NO) and dimer (N2O4)
partial pressures can be estimated in the at about P(NO2) 4.9± 0.1 hPa, P(N2O4) ≤ 0.2 hPa.
For the second (FTS3) and third (FTS3bis) spectra, in the 3 mid-infrared range, the sample gas
pressure was much lower, (0.20 hPa and 0.62 hPa, respectively) and although N2O4 is
detectable, due to the long optical path length its partial pressure can be estimated to be quite low, on the order of 0.001 hPa and 0.003 hPa, respectively.
Fig. (A1) and (A2) give overviews of the FT3 and FT12 spectra. While saturated in its central part, the FTS3 and FRS3bis spectra were used in its P branch to identify lines belonging to hot bands and test the quality of the GEISA-19, HITRAN2016-updated, and HITEMP databases. The FTS12 spectrum corresponds to the B-type 1+2 band.
Also, we used FTS spectra, or portions of spectra, recorded during previous NO2
investigations. Table 2 summarizes the information on these spectra (FTS13, FTS23. FTS33, FTS113 and FTS333) which are associated to the investigation of the 21 and 1+3 bands [18],
the 2+3 band [29], the 22+3 2, and 3 [34] interacting bands, and the 21+3 and 3
bands [35]. All spectra were recorded on Bruker instruments, type IFS125HR (FTS12, FTS3, FTS3bis, FTS13) or FTS120HR (other spectra), at a resolution ranging as R=0.002 - 0.003 cm-1,
and at room temperature conditions.
Some additional comments concern spectra FTS113 and FTS333 which were used to perform the most recent line positions and (relative) line intensities investigations for the 21+3
and 33 bands of NO2 [35]. Hargreaves et al. [3] pointed out that the experimental intensities
measured for these two bands in Ref. [35] lead to cross sections which are, on the average, 3.5 times weaker than those delivered at 25°C by the Pacific Northwest National Laboratory (PNNL) [36]. At the present time we decided to adopt the strategy suggested by Hargreaves et al. [3], this means that in GEISA-19, the intensities of the 21+3 and 33 bands were calibrated
on the absolute scale using the PNNL cross sections.
V The GEISA-19 database in the far infrared and 13.3 µm region, and status of the energy
parameters for the (0,0,0), (0,1,0) and {(1,0,0),(0,2,0),(0,0,1)} states of 14N16O
2:
V-A The microwave to far infrared region and the 13.3 µm regions.
In HITRAN-GEISA-15 the microwave and far infrared region, involves rotational transitions within the (0,0,0) and (0,1,0) vibrational state [19,20, 37]. The 13.3 µm region considers the lines belonging to the 2 band [20] and its associated 22-2 «first» hot band [33,
20]. The details on the line intensities calculations, models and parameters, are given in Refs. [19] [20] and [33]. As far as the line positions and intensities, these microwave to far-infrared and 13.3 µm linelists were not updated during the present work because we do not have any new spectroscopic data or a new model which encourage us to perform such modification.
V-B Status of the (0,0,0), (0,1,0) and {(1,0,0),(0,2,0),(0,0,1)} energy levels parameters At this level, it is necessary to justify the choice of the energy level parameters used during this work for the computation of energy levels of the (0,0,0), (0,1,0) vibrational states and for those of the first triad of {(1,0,0),(0,2,0),(0,0,1)} interacting states.
The (0,0,0), (0,1,0) vibrational states
During the present update of GEISA-19 we used the (0,0,0) and (0,1,0) energy level parameters quoted in Ref. [37] and [20], respectively, for the whole set of line position computations. These parameters were derived from combined fits of experimental data extracted from high resolution Fourier transform infrared spectra and from microwave measurements. Indeed those (0,0,0) and (0,1,0) energy level parameters are significantly more accurate than those quoted in Ref. [38]: at that time the investigation was performed using infrared grating spectra or diode laser measurements, and the spin- rotation resonances were accounted only through second order perturbation.
The {(1,0,0),(0,2,0),(0,0,1)} interacting states:
As far as the {(1,0,0),(0,2,0),(0,0,1)} energy levels are concerned, the 22-2 linelist at
13.3 µm is not consistent with the 1, 22, and 3 linelist at 6.2 µm. This is because two different
sets of energy level parameters, Ref. [33] at 13.3 µm, and Ref. [23] and 6.2 µm, were used at the computation of the upper state energy levels. Historically, a first set of energy level parameters for the first triad of 14NO
2, was obtained in Ref. [23] using as input to the least
squares fit calculation experimental energy levels for the {(1,0,0),(0,2,0),(0,0,1)} interacting states that were obtained during the investigation of high-resolution FTS spectra at 6.2 µm. At that time, the identification of the 1 and 3 bands was very extended, while for 22, only several
series were observed, which involves for the (0,2,0) vibration state only the Ka=0-2 and Ka=6
rotational quantum numbers. The additional missing information for the Ka=3,4 and 5 series of
(0,2,0) could be filled through the latter identification of the 22-2 hot band in high resolution
spectra recorded at 13.3 µm [33]. Therefore, in Ref. [33] the energy levels parameters for the first triad of 14NO
2 were refined during a least squares fit which combined together the
experimental spin- rotation energy levels of the (0,0,1), (1,0,0) and (0,2,0) states originating from both analyses, at 6.2 µm [23], and at 13.3 µm [33]. This justify the choice of the parameters of Ref. [33] rather than those of Ref. [23] for the computations the (0,0,1), (1,0,0) and (0,2,0) upper or lower state energy levels in the whole GEISA-19 database.
VI The GEISA-19 database in the 1153-4775 cm-1 spectral region
For wavenumbers greater than 1153 cm-1, GEISA-19 was largely modified as compared
which were the only originally present in HITRAN-GEISA-15 at 6.2 and 3.4 µm. Also, we add new linelists which concern (i) higher order hot bands in the 6.2 µm and 3.4 µm regions (ii) several weaker bands in the 2.3 to 4.9 µm region, and (iii) the 3 and 1+3 bands for the 15N16O2
isotopic species of nitrogen dioxide.
For GEISA-19, we tried to generate accurate vibration- rotation bands each time this proved to be “technically possible”. The limitation concerns the quality of line position and line intensity parameters that we had at our disposal. For example, the very weak 1+23 weak cold
band at 2.2 µm, present in HITRAN-2016 and HITEMP, is absent in GEISA-19 because we do have at our disposal intensity parameters for this band. Contrary to HITEMP, GEISA-19 does not includes lines involving very high rotational quantum numbers, and numerous higher order hot bands are missing.
VI-A Updates of the lists included in HITRAN-GEISA-15
V-A-1 The cold bands in the 6.2 µm and 3.4 µm regions for 14N16O 2.
The 6.2 µm bands
For GEISA-19 a new linelist was generated for the 1, 22, and 3 interacting bands at
6.2 µm using the energy level parameters of Ref. [33]. Let us mention that the 3 and 1 bands
are only weakly affected in this new calculation as compared to the previous linelist [39]. In fact, only the very weak Ka=3-5 series, or those with Ka 7 of the dark 22 band have their
positions significantly modified. The 3.4 µm bands:
The recent update of the 1+3 band at 3.4 µm was presented in details in Ref. [18]. Let us recall
that this recent analysis unable to assign 1+3 lines up to N=75 and Ka= 14 (instead of N= 55
and Ka= 10, in Ref. [26]). In addition, a new investigation of the 21 band was performed. The
energy level computation involves six interacting states {(2,0,0),(1,2,0),(1,0,1), (0,4,0),(0,2,1),(0,0,2)}, instead of two {(1,2,0),(1,0,1)} previously [26]. Also, detailled line intensity measurements and calculations were performed for the 21 band [18]. Indeed, this
band exibits an “unusual” intensity behaviour for a B-type band, with, for example, a very weak P- branch. The progress achieved for the 1+3 and 21 linelists [18] as compared to their
counterparts in HITRAN2016-updated [6] and HITEMP [3] are resumed shortly latter in the text.
VI-A-2 The “first” hot bands in the 6.2 µm and 3.4 µm regions for 14N16O 2.
We will present the updates performed for the “first” hot bands associated to the strongest absorbing bands of NO2 in the 6.2 µm and 3.4 µm regions.
The 6.2 µm bands and update of the energy level parameters for the {(0,3,0),(0,1,1)} interacting states.
As far as the line positions are concerned, the list for the 2+3-2 hot band present in
HITRAN-GEISA-15 was generated using for the {(0,3,0),(0,1,1)} upper and (0,1,0) lower states the energy level parameters quoted in Ref. [38]. Let us remind that these parameters were achieved using a composite set of experimental data (grating and diode laser spectra). In addition, the spin- rotation resonances were only accounted for through a second order treatment. This 2+3-2 list, which is unchanged in HITRAN2016-updated, was only extended
in HITEMP up to higher values of the N and Ka rotational quantum numbers.
For the preparation of GEISA-19 we generated a new version of the linelist for this hot band. In a preliminary step, the line positions were computed using the upper and lower state energy level parameters of Refs. [29] and [20] for the {(0,3,0),(0,1,1)} and (0,1,0) states, respectively. The comparison between calculated spectrum and the observed one (the FTS3 or FTS3bis spectra in the P branch region) proved that this preliminary 2+3-2 linelist was
already more precise than the existing one in HITRAN-GEISA-15, although not perfect. Indeed, we notice that the 2+3-2 transitions involving high Ka values (11 Ka 9) differ
from their predicted positions. We used these 2+3-2 new assignments to generate an
additional set of 37 experimental spin-rotational energy levels for the (0,1,1) state by adding the 2+3-2 line positions to the calculated (0,1,0) state energy levels [20]. These additional
set of (0,1,1) levels were combined with those already measured during the investigation of the 2+3 band [29], and these data were introduced in a least squares fit calculation to get refined
values for the {(0,3,0)(0,1,1)} interacting states parameters. These constants which are given, together with their associated uncertainties in Table 3, were used to generate the final linelist for the 2+3-2 band which is quoted in GEISA-19.
The list of assigned 2+3-2 transitions involving high Ka values (11 Ka 9), and the
results of the energy level computation for the {(0,3,0)(0,1,1)} state are given in the Supplementary data of this article.
The 3.4 µm bands:
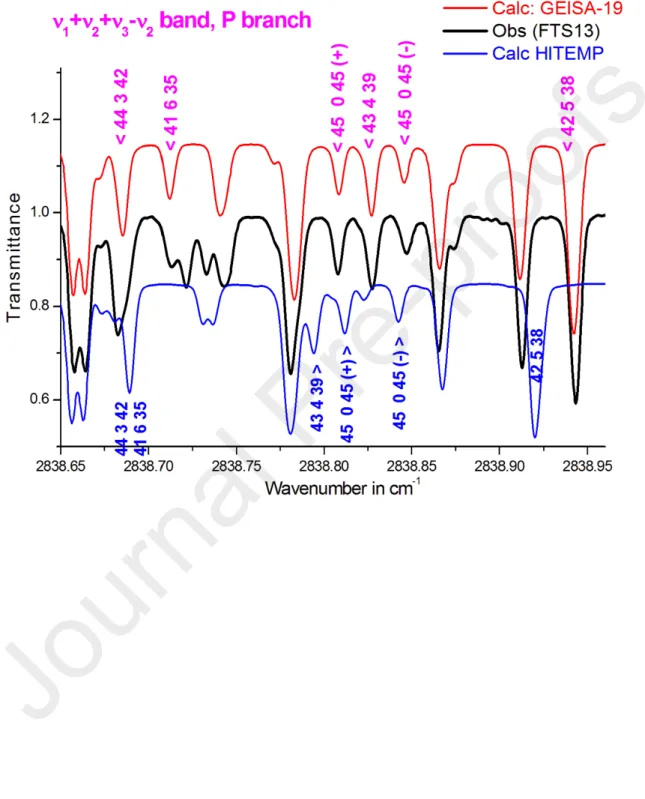
In HITRAN2016-updated the list for the 1+2+3-2 band, located at 2888.191 cm-1,
coincides with HITRAN-GEISA-15’s. This list, which is restricted to the 2850.082 - 2917.363 cm-1 spectral region, was generated using for the energy positions in the upper {(1,2,0),(1,1,1)}
and lower (0,1,0) states the parameters quoted in Ref. [40] and [38], respectively. As for its 2+3-2 counterpart at 6.2 µm, this list is not very accurate for the same reasons (low quality
of the theoretical model and of the experimental data used as input to the calculation). For HITEMP the 1+2+3-2 linelist was extended to include lines involving higher N and Ka
values.
For GEISA-19, the generation of the new linelist for the 1+2+3-2 band was
performed using for the line positions the upper {(2,1,0),(1,3,0),(1,1,1)} and lower (0,1,0) energy level parameters collected in Ref. [17] and [20], respectively.
VI-B New input in GEISA-19: higher order hot band in the 6.2 µm and 3.4 µm regions
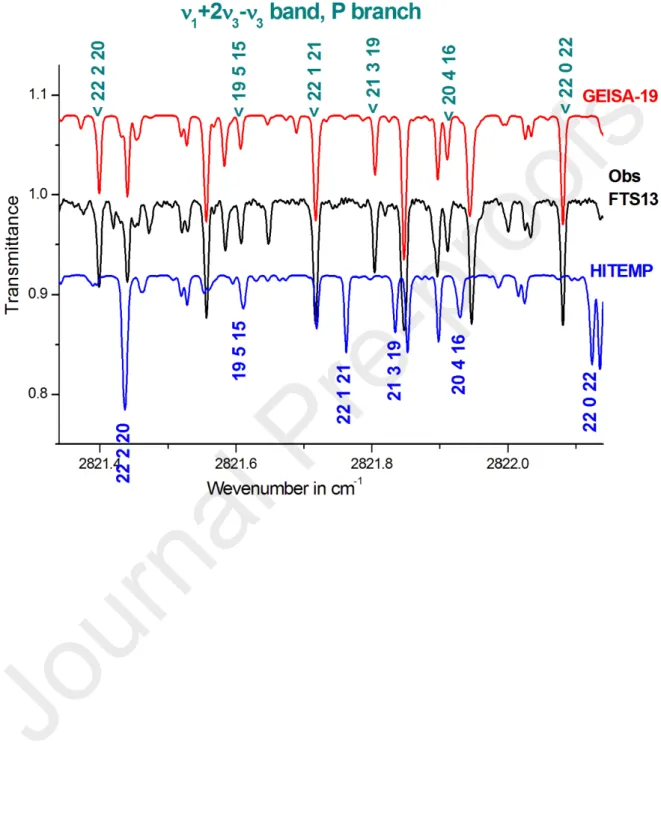
VI-B-1 Higher order hot bands in the 3.4 µm region, and first investigation of the 1+23-3
hot band:
In the 3.4 µm region, the three stronger second order hot bands are the 21+3-1,
1+23-3, and 1+22+3-22 hot bands, located at (about) 2860.144, 2844.218 and 2870.76
cm-1, with a relative intensity at 296K of 0.32%, 0.077%, and 0.065%, respectively as
compared to the cold 1+3 band (located at 2906.074 cm-1)
It was rather easy to generate a linelist for the 21+3-1 band using for the computation
of the upper and lower state levels the energy level parameters of Refs [35] and [33], respectively. In this way, lines of the 21+3-1 hot band could be identified in the FTS13
spectrum within strong lines of the P branch of the 1+3 band
On the other hand, the situation for the 1+23-3 and 1+22+3-22 hot bands was not
so simple since, to our knowledge, the very weak 1+23 and 1+22+3 bands were never
investigated at high or medium resolution. The only existing information concerns the band centers which were measured by laser fluorescence spectroscopy [41] at 4461.07 and 4369.10 cm-1 for the (1,0,2) and (1,2,1) vibrational states.
Therefore, the right method was to try to identify these hot bands in the congested FTS13 spectrum which was recorded for a large (pressure path length) product (see Ref. [18]),
because numerous lines were unidentified at that time. To solve this problem, we generated predictive line lists for the 1+23-3 and 1+22+3-22 bands.
We were unfortunately not able to identify the 1+22+3-22 band which is located in
a congested part of the FTS13 spectrum. Fortunately, we were luckier for the 1+23-3 hot
band, as the line prediction helped us to perform several assignments. The calculated (0,0,1) state energy levels [33] were added to the first observed 1+23-3 line positions to get a
preliminary set of (1,0,2) experimental spin-rotational energy levels. These upper state levels were then introduced in a least squares fit calculation to get refined values for the {(1,0,2)(1,2,1)} energy level parameters, and therefore perform new assignments, and then improve the accuracy of the parameters, allowing then further new assignments. This iterative process was performed until no further assignments of 1+23-3 lines could be possible.
Altogether, about 550 lines (resolved or unresolved spin doublets) were assigned with Ka and
N values such that (0 Ka 8 ) (0 N 45), leading to the determination of 394 energy levels
of the (1,0,2) state.
The final set of vibrational energies, spin rotation, rotational and interacting constants for the {(1,0,2)(1,2,1)} interacting states are collected in Table 3. During this computation, the Ev (vibrational energy) of the (1,2,1) was maintained at the value proposed by Delon and
Jost [41] (E121= 4369.10 cm-1). The EV value of the (1,0,2), E102= 4460. 8648 0.0003 cm-1 is
in reasonable agreement with the laser fluorescence value proposed by Delon and Jost [41] (E102= 4461.07 cm-1). We also notice that the Ka=4 levels of the (1,0,2) state are resonating
with Ka=5 levels of (1,2,1), and that the mixing of the energy levels grows up to 44% for
N=44. We used these energy level parameters together with the first triad constants of Ref. [33] to generate the line positions of the 1+23-3 hot band. The associated intensities were
computed using the method described previously.
The complete list of assignments and the results of this calculation are provided as supplementary data of this article.
VI-B-2 Higher order hot bands in the 6.2 µm region
In the 6.2 µm region, the second order hot bands which lead to relative strong contributions are those associated to |v3|=1 i.e. the 22+3-22, 23-3 and 1+3-1 hot
the energy level parameters of Ref. [18] and of Ref. [33] for the upper and lower states respectively.
Whenever possible, we generated also higher order hot bands. This was possible in the 6.2 µm region for the 1+2+3-(1+2), 21+3-21, 1+23-(1+3) and 33-23 hot bands.
For the upper state energy levels we used the energy level parameters of the (1,1,1) (Table 3 of Ref. [17]), (2,0,1), and (0,0,3) (Table 3 and 4 of Ref. [35]), and for (1,0,2) those in Table 3 of this work, while for the (1,1,0) and {(2,0,0),(1,2,0),(1,0,1), (0,0,2), (0,4,0),(0,0,2)} states, we used the parameters quoted in Table 1 of Ref. [42] and Table 4 of Ref. [18], respectively. VI-C New input in GEISA: weak cold bands in the 2.2 to 4.9 µm spectral regions :
The new versions of HITRAN2016-updated [6] and HITEMP [3] databases include linelists for numerous weak bands which were not considered in HITRAN-GEISA-15. For several of these rather dark bands, this is now the case for GEISA-19.
¤ The 21 band centered at 2627.34 cm-1 was already the subject of an extensive study
(positions and intensities) in Ref. [18], leading to a linelist now included in GEISA-19.
¤ GEISA-19 includes linelists from the 1+2 band [42], 22+3 and 23 bands [34,14],
and 21+3 and 33 bands [35], located at 2063.12, 3092.48, 3201.44, 4179.94, and 4754.21
cm-1, respectively together with some lines associated to their dark interacting bands. For these
bands we used, without modifications, the energy level parameters and the expansion of the transition moment operators which are quoted in the original papers. The only exception concerns the intensities of the 21+3 and 33 bands which were calibrated relative to the PNNL
cross sections for NO2 [36].
¤ GEISA-19 includes linelists from the 2+3 band located at 2355.15 cm-1. For this
computation we used the improved energy level parameters achieved for the {(0,3,0),(0,2,1)} interacting states during this work (see Table 3) for the computation of the (0,1,1) upper levels, and the expansion of the 2+3 transition parameter quoted in Ref. [29] for the 2+3 intensities.
¤ The very weak 1+2+3 band located at 3637.848 cm-1 [17] is not included in
HITEMP or HITRAN2016-updated. The FTS123 Fourier transform spectrum used in Ref. [17] was recorded without purification of the NO2 sample. So, the presence of impurities prevents
to use this spectrum for line intensities measurements. However, Fig.1 in Ref. [17] shows that the band intensity pattern of the + + band does not differ from what is expected for a
classical A –type band of nitrogen dioxide, without any significant distortion effect. Therefore, only the first order term in the expansion of the 1+2+3 transition moment operator is
necessary to compute the line intensities for this band. Its value was estimated to be : 0.27 10-2 D (+/ - 20 %) 4, Eq.(4) ' 1 000 , 111
using the PNNL cross section data [36]. The uncertainty quoted in Eq. (4) is set up according to the noise level (~5.E-22 cm2/molecule) in the PNNL cross section data.
VI-D New inputs in GEISA-19: The 3 and 1+3 bands for 15N16O2:
The linelists for the 3 and 1+3 bands of 15N16O2, located at 1582.1029 and 2858.7088
cm-1,5 respectively, were included in GEISA-19. We used the line positions and intensities
gathered in Refs. [16], and [43], respectively. The computed partition functions for 15N16O 2 at
different temperatures (T=50K to T=500K) are also provided as Supplementary data of the present article.
VI-E Final description of the GEISA-19 database in the 1153- 4775 cm-1 spectral region:
The GEISA-19 database for nitrogen dioxide is available on the freely accessible https://geisa.aeris-data.fr/ website. Also, in the 1153-4775 cm-1 spectral range, which is the
object of this study, this linelist is provided as supplementary data of this work. Table 4 gives a global description of this linelist, with, for each vibrational band and isotopic species (14N16O
2
and 15N16O
2), the vibrational assignment, the number of lines, an approximate band center, the
wavenumber range (in cm-1), the band intensity and the minimum and maximum values of the
individual line intensities intensity (in cm-1/(molecule.cm-2) at 296K), the maximum N values
and the range for the Ka rotational quantum numbers in the upper vibrational state.
4in Debye (1 D = 3.33564 10-30 C m), 5 The actual band center of the
1+3 band is 2858.7088 cm-1 instead of 2858.7077 cm-1 in Ref. [43].
Also the Z15(296K)= 9324.7 value was used during the intensities computations for the 1+3 band,
It is necessary to estimate the accuracy attached to the computed line positions and intensities. In GEISA-19, each of vibration – rotation linelist was generated through calculations. It is obvious that extrapolations far away from the range of the lower or upper states experimental data used during this computation can be uncertain. To document this point, Table 4 provides for each vibrational band the maximum N value and the Ka range for the upper
and lower states experimental energy levels used during the computation.
One can estimate at about 0.001- 0.003 cm-1 the accuracy of the line position for
transitions involving rotational quantum numbers within the range of the observed energy levels. For transitions outside these limits, the line position accuracy is decreasing with increasing rotational quantum
As far as the line intensities are concerned, the information describing the quality and accuracy of these data are provided in the literature articles which are referred in this paper.
VII-Validations of the new GEISA-19 database.
Two different types of validations for the GEISA-19, HITEMP and HITRAN2016-updated linelists were performed. First the existing laboratory FTS spectra (see Table 2) were used to check these linelists through inter-comparison between observed and calculated spectra. In a second step, we checked, within these databases, the internal consistency of the computed energy levels in term of the Rydberg–Ritz combination principle.
VII-A Validation with the observed laboratory spectra at 296K.
To validate GEISA-19 we compared the calculated and observed spectra using the laboratory FTS spectra at our disposal (see Table 2). The same intercomparison was performed using the HITEMP or HITRAN2016-updated linelist.
VII-A-1 The 6.2 µm region:
We used the FTS3 and FTS3bis spectra recorded during this work to validate our computations.
Figures 1 to 5 detail the computations for several vibrational bands which were computed for GEISA-19 during this work.
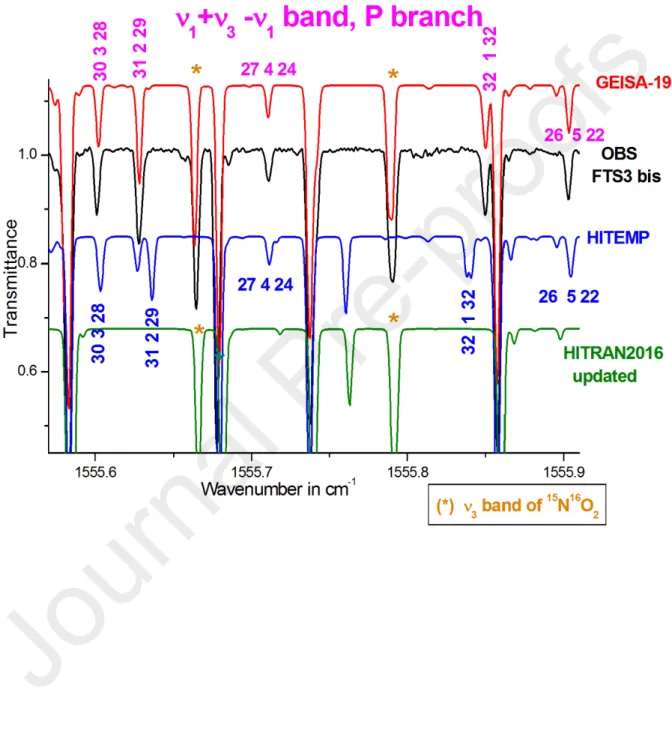
Figure 1 presents a portion of the spectrum in the 1557 cm-1 region where lines from the 2
Figure 2, 3, and 4 present a portion of the same spectrum in the 1555, 1561 and 1572 cm-1 spectral ranges where lines from the P branches of the 1+3-1, 23-3 and 22+3-22 hot
bands are clearly visible.
Finally, Figure 5 present a portion of the P- branch of the 3 band in the 1559.1 cm-1 region.
In this case a global comparison GEISA-19 versus HITEMP and HITRAN2016-updated is performed.
VII-A-2 The 2.3 µm region:
For this validation we used the FTS13 spectrum recorded in Ref. [18].
Figures 6, 7, and 8 give portions of FT13 spectrum in the 2838.8 cm-1, 2821.6 cm-1 and 2834.8
cm-1 spectral ranges, and the comparisons focus specifically on the
1+2+3-2, 1+23-3
and 21+3-1 hot bands, respectively.
Finally, Figure 9 presents a portion of the 2820 cm-1 spectral region. In this region, lines from
the 1+3 band of 15N16O2 are also observable, together with numerous lines from the hot
bands from the main species. The comparison of GEISA-19 with HITEMP and
HITRAN2016-updated is performed. Note than in HITRAN2016-updated the linelist for the 1+2+3-2 hot band is restricted to the 2850.08 -2917.36 cm-1 spectral region.
VII-A-3 The weak bands:
During this work several weak bands were added to the GEISA linelist for NO2.
Fig. 10 presents a portion of the FTS13 spectrum in the 2814.4 cm-1 spectral range,
where lines from the R branch of the 21 band are easily observable within from those from the
P- branches of the 1+3 band and associated hot bands. The agreement (positions and
intensities) between the observed and calculated spectra is excellent when using GEISA-20 both for the 21 lines and for the 1+3 band (and for the associated hot bands), while this is not
the case for HITEMP. For this figure, Table TA1 (Supp-5 in the supplementary data) provides the assignments, line positions and line intensities for several 14N16O
2 lines. As far as the 1+3,
GEISA-20 are in good agreement, while for the 21 lines, the intensities in HITEMP are about
two times weaker than in GEISA-20. This is also evidenced on Fig. A9 which presents an overview of the 21 band. Also Fig. A9 in the archive (Supp-5 in the supplementary data)
presents an overview of the 2500- 3000 cm-1 region of the FTS13 spectrum which corresponds
to the 21 and 1+3 bands of 14N16O2, it is clear that that HITEMP underestimates the 21 band
line intensities by a factor of about two, and that the strange intensity pattern of the 21 band is
not accounted for.
For the other weak “cold” bands, the figures presenting intercomparisons are accessible in Supp-5 of the supplementary data of this paper.
Figures A3, A4, A5, A6, A7 and A8 present inter-comparisons for the 1+2 band near 2090.7
cm-1 (FTS12),
2+3 band near 2365.2 cm-1 (FTS23), 22+3 band near 3069.68 cm-1 (FTS223),
1+2+3 band near 3650 cm-1 (FTS111), 21+3 band near 4155.2 cm-1 (FTS113) and 33 band
near 4774.8 cm-1 (FTS333).
Except for 1+2+3, all these weak bands are included in HITRAN2016-updated and
HITEMP.
VII-A-4 Conclusion for the intercomparison between observed and calculated spectra:
We notice that the agreement between the observed and calculated spectra is better in all spectral regions when using GEISA-19 rather than with HITRAN2016-updated or HITEMP. However, the line position differences between databases depend on the considered vibrational transitions.
The 3 band was not significantly updated. For the 1+3 band, the most significant
discrepancies (more than ~0.01 cm-1) concern lines involving high rotational quantum numbers
(Ka= 0 and N ≥69; Ka= 5 and N ≥55; or Ka=10 and N ≥47) [18].
For vibrational transitions involving only excitations in the 3 vibrational mode, like the 33
weak cold band at 2.1 µm, the 23-3 and 33-23 hot bands at 6.2 µm, the differences are in
general weaker than for other type of vibrational transitions. However, differences larger than ~0.005 cm-1 concern the lines involving N and K
a quantum numbers such that Ka=1 and N ≥35
of 33-23; Ka=1 and N ≥49 for 23-3 and 23 ); Ka=1 and Ka=2 and N ≥41 for 33.
(50-Ka) or Ka ≥ 9 of 2+3-2; for Ka≤8 and N≥ (42-Ka ) or Ka≥ 9 for 1+2+3-2). Let us
remind that the 2+3-2 and 1+2+3-2 hot bands give rise to the strongest NO2 infrared
signature in the 6.3 µm and 3.4 µm region after their associated 3 and 1+3 associated cold
bands.
As expected, larger line position differences (larger than ~0.02 cm-1) between the
databases concern bands involving the (2,0,0) or (1,0,2) vibrational states in the upper or lower state of the vibrational transition. However it is clear that these bands are extremelly weak, except for hot bands (21+3-21, 1+23-23 , etc…) for NO2 spectra in very very high
temperature conditions.
VII-B Consistency of the GEISA-19 database for the EL or EU as energy levels values
(Rydberg–Ritz combination principle).
Within the HITRAN-GEISA-15, HITRAN2016-updated or HITEMP databases one should expect that the individual values of EL (resp. of EU ) lower (resp. upper) state energy
level values to be consistent from one given vibration –transition band to the other one, provided that they involve the same lower
v1L,vL2,v3L
NL,KaL,KLc,JL
(resp. same upper ) vibrational spin-rotational energy level. However, this not
U
3 U 2 U 1 ,v ,v v
NU,KaU,KUc ,JU
the case because these linelists were generated by merging numerous unrelated data sources. Table 5 provides several examples of vibration spin- rotation transitions for which this is not the case in HITEMP or HITRAN2016-updated. For example, the computed positions of the (0,2,0) [21,3,19] spin rotational levels are different in the 22, 22-2, and 22+3-22 bands.
This is the case also for the (1,1,0) [42,0,42] or (1,1,0) [33, 1, 33] levels in the 1+2 and 1+2
-2 bands, for the (0,1,1) [31, 9, 22], (0,1,1) [35, 8,27], (0,1,1) [45, 4, 41], or (0,1,1) [27, 10,
17], in the 2+3 and 2+3 -2 bands, or for the (0,2,1) [20,3,18] spin rotational levels in the
22+3, 22+3-2, and 22+3-22 bands. This problem was solved in GEISA-19, and to
validate these corrections, Table 5 provides, each time it was possible, the observed line positions which were either observed during previous investigations (see the literature) or identified during the present work.
VII-C Comparison with the PNNL cross-sections.
In Fig. 11, we compared the cross-sections computed using the HITEMP and GEISA-19 linelists with the PNNL NO2 cross sections [36]. Althought remaining absorption due to the
N2O4 dimer are quite observable (in the 1263, 1751, 2630 and 2971 cm-1 spectral regions) in
the PNNL spectra, we can notice the following points.
- In GEISA-19, the 21 band is significantly stronger than in HITEMP, and this is in
agreement with the PNNL data.
- GEISA-19 includes data for the 1+2+3 band at 3637 cm-1, while this linelist is absent
in HITEMP.
- HITEMP includes data for the 1+23 band at ~4500 cm-1, while this linelist is absent
in GEISA-19. This is because we do not have reliable intensity data for this very weak band which, in Fig. 11 is masked in the noise level (about 5×10-22 cm2/molecule) of the PNNL
cross-section.
Conclusion
During this work, a new version of the line by energy level parameters (line positions, intensities and shape) for nitrogen dioxide was generated for the 0- 4700 cm-1 spectral range
and implemented in the (Gestion et Etude des Informations Spectroscopiques Atmosphériques) GEISA database (https://geisa.aeris-data.fr/). Except for the far infrared and 13.3 µm regions all spectral regions are significantly affected by this major update.
For the main (14N16O
2) isotope species, the updated lists involve the main cold bands (1, 22
and 3 and ν1 + ν3, respectively) together with their associated «first» hot bands, and, whenever
possible, higher order hot bands. One of the outputs of this work was the first identification of the 1+23-3 hot band, leading to the first determination of the energy level parameters for the
(1,0,2) vibrational state of 14N16O
2. Also, the quality of the (0,1,1) energy level parameters was
improved during the investigation of the 2+3-2 hot band. In addition, the linelists for several
weak cold bands were implemented in GEISA-19 for the first time. For 15N16O
2, which is the
most abundant daughter isotopologue of nitrogen dioxide, we included in GEISA-19 the line parameters for the and + bands.
These new lists, were validated using high resolution Fourier transform spectra recorded at SOLEIL at 296K or during previous laboratory studies. It appeared that, as compared to HITRAN2016-updated and HITEMP, GEISA-19 leads to better agreements between calculated and observed spectra in all spectral regions. In term of line position calculations, GEISA-19 proved to be more consistent than HITRAN2016-updated and HITEMP. However, GEISA-19, which does not include transitions involving very high rotational quantum numbers or belonging to higher order hot bands, is not suitable for uses at high temperatures.
Acknowledgments
The authors acknowledge support from synchrotron SOLEIL (project 99200018). This work was supported by the French National program LEFE « Les Enveloppes Fluides et l’Environnement » through the « MEANSPECFORUM » project. It is also funded by the French National program ANR (ANR-19-CE29-0013) through the « QUASARS » project. Also, we thank the reviewer for his very valuable comments.
APPENDIX-A: description of the supplementary data
Supp-1: The GEISA-19 linelist in the 1153-4775 cm
-1spectral range (in the
HITRAN’s type format [2]).
Supp-2: Results of the calculation of the {(0,1,1),(0,3,0)] energy levels. List of
assignments for the
2+
3-
2hot band. List of assignments for the (0,1,1)-(0,1,0)
hot band.
Supp-3: Results of the calculation of the {(1,0,2),(1,2,1)] energy levels, and list
of assignments for the
1+2
3-
3hot band. List of assignments for the
(1,0,2)-(0,0,1) hot band.
Supp-4: Partition function for
15N
16O
2.
Supp-5: Table TA1 and list of nine figures (A1-A9).
Comparison of the line positions and intensities in the 2814-2815 cm-1 spectral range of the
FTS13 spectrum (see Fig. 10)
Fig A1 : Overview of the FTS3 spectrum (3 band spectral region)
Fig A2:Overview of the 1+2 band (FTS12).
Fig A3: Portion of the R branch of the 1+2 band in the 2090 - 2093 cm-1 region (FTS12).
We give some [N, Ka,Kc] (J=N1/2 ) rotational assignments for the 1+2 band. A comparison
between the model provided by GEISA-19 and HITRAN2016-updated (or HITEMP) is given. Fig. A4 : Portion of the R branch of the 2+3 band in the 2365.2 cm-1 region (FTS23). In the
bottom part of the figure, the quoted [N, Ka, Kc] (and eventually J) assignments are for the
(0,1,1) upper sate energy levels. A comparison between the model provided by GEISA-19 and HITRAN2016-updated (or HITEMP) is given.
Fig. A5 : Portion of the P- branch of the 22+3 band near 3079.8 cm-1 (FTS223). In the
upper part of the figure, the quoted [N, Ka, Kc] (and eventually J) assignments are for the
(0,2,1) upper energy levels. The GEISA-19 and HITEMP (or HITRAN2016 -updated) linelists are compared.
Fig. A6: Portion of the R- branch of the 1+2+3 band of NO2 in the 3650 cm-1 region
(FTS111 spectrum). Several N’ assignments in the upper state are given for, [N,Ka = 0,Kc =
N] = [N-1, 0, N-1] (triangles). This band is not considered in the HITEMP or HITRAN2016-updated databases.
Fig. A7 : Portion of the R- branch of the 21+3 band near 4155.2 cm-1 (FTS113). In the
bottom part of the figure, the quoted [N, Ka, Kc] (and eventually J) assignments are for the
(2,0,1) upper energy levels of the 21+3 band. Due to a local resonance the
[23,3,21]-[24,0,24] transition of the dark 21+22 band are observable on the spectrum. The GEISA-19
Fig. A8 : Portion of the R- branch of the 33 band near 4774.8 cm-1 (FTS333). In the bottom
part of the figure, the quoted [N, Ka, Kc] (and J, eventually) assignments are for the (0,0,3)
upper energy levels of the 33 band. The GEISA-19 and HITEMP linelists are compared.
Fig. A9 : Overview of the FTS13 spectrum in the 2500-3000 cm-1 spectral region of the NO 2
absorption region. For NO2, this spectral region corresponds to the 21 band and to the 1+3
band and its associated hot bands. In this spectral region absoptions due the 1+11 and 5+11
bands of the N2O4 dimer are quite observable at 2630 and 2971 cm-1, respectively. For NO2, the
comparison of the line by line model generated using the GEISA-19 and HITEMP databases are also presented. As noticed in Ref. [18] the 21 (B-type) band exibits an “anusual” intensity
behaviour, with a very weak P- branch. In HITEMP, the line intensities of the 21 band are
References
[1] N. Jacquinet-Husson, R. Armante, N.A. Scott, A. Chédin, L. Crépeau, C. Boutammine, A.Bouhdaoui, C. Crevoisier, V. Capelle, C. Boonne, N. Poulet-Crovisier, A. Barbe,
D.C.Benner, V. Boudon, L.R. Brown, J. Buldyreva, A. Campargue, L.H. Coudert, V.M. Devi, M.J. Down, B.J. Drouin, A. Fayt, C. Fittschen, J.-M. Flaud, R.R. Gamache, J.J. Harrison, C. Hill C, Ø. Hodnebrog. S.M. Hu, D. Jacquemart, A. Jolly, E. Jiménez, N. Lavrentieva, A.W. Liu, L. Lodi, O.M. Lyulin, S.T. Massie, S. Mikhailenko, H.S.P. Müller, O.V. Naumenko, A. Nikitin, C.J. Nielsen, J. Orphal, V. Perevalov, A. Perrin, E. Polovtseva, A.Predoi-Cross, M. Rotger, A.A. Ruth, Y. Shanshan, K. Sung, S. Tashkun, J. Tennyson, V.G. Tyuterev, J. Vander Auwera, B. Voronin, and A. Makie. J. Mol. Spectrosc. 327 (2016) 31-72.
[2] I.E. Gordon, Rothman LS, Hill C, Kochanov RV, Tana Y, Bernath PF, Birk M, Boudon V, Campargue A, Chance KV, B.J. Drouin, J.-M. Flaud, R.R. Gamache, J.T.Hodges, D. Jacquemart, V.I. Perevalov, A. Perrin, Shine KP, Smith MA, Tennyson J, Toon GC, Tran H, Tyuterev VG, A. Barbe, A.G. Császár, V.M. Devi, T. Furtenbacher, J.J. Harrison, J.M. Hartmann, A. Jolly, T.J. Johnson, T. Karman, I. Kleiner, A.A. Kyuberis, J. Loos, O.M. Lyulin, S.T. Massie, S.N. Mikhailenko, N. Moazzen-Ahmadi, H. Müller, O.V. Naumenko, A.V. Nikitin, O.L. Polyansky, M. Rey, M. Rotger, S.W. Sharpe, K. Sung E. Starikova, S.A.Tashkun, J. Vander Auwera, G. Wagner, J. Wilzewski, P. Wcisło, S. Yuh, E.J. Zak. J. Quant. Spectrosc. Radiat. Transf. 203, (2017) 3-69.
[3] R.J. Hargreaves, I. E. Gordon, L. S. Rothman, S. A. Tashkun, V. I. Perevalov, A. A. Lukashevskaya, S. N. Yurchenko, J. Tennyson, and H. S.P. Müller. J. Quant. Spectrosc. Radiat. Transf. 232 (2019) 35-53.
[4] A.A. Lukashevskaya, O.M. Lyulin, A. Perrin, and V. I. Perevalov, Atmospheric and Oceanic Optics, 28 (2015) 216-231.
[5] A.A. Lukashevskaya, N.N. Lavrentieva, A.C. Dudaryonok, and V.I. Perevalov. J. Quant. Spectrosc. Radiat. Transf. 184 (2016) 205-217 ; ibid. 202 (2017) 37-37.
[6] High-resolution transmission molecular absorption database (HITRAN). [https://hitran.org/]
[7] A.A.Lukashevskaya, O.V.Naumenko, S.Kassi, A.Campargue. J. Quant. Spectrosc. Radiat. Transfer. 338 (2017) 91-96.
[8] A.A.Lukashevskaya, S.Kassi, A.Campargue, V.I.Perevalov. J. Quant. Spectrosc. Radiat. Transfer. 202 (2017) 302-307.
[9] A.A.Lukashevskaya, S.Kassi, A.Campargue, V.I.Perevalov. J. Quant. Spectrosc. Radiat. Transfer. 200 (2017) 17-24.
[10] A.A.Lukashevskaya, D.Mondelain, A.Campargue, V.I.Perevalov. J. Quant. Spectrosc. Radiat. Transfer. 219 (2018) 393-398.
[11] O.V.Naumenko, A.A.Lukashevskaya, S.Kassi, S.Béguier, A.Campargue. J. Quant. Spectrosc. Radiat. Transfer. 232 (2019) 146-151.
[12] A.Perrin, S.Kassi and A.Campargue. J. Quant. Spectrosc. Radiat. Transf. 111, (2010) 2246–2255.
[13] D. Mondelain, A.Perrin, S. Kassi, A. Campargue.. J. Quant. Spectrosc. Radiat. Transf. 113 (2012) 1058-1065.
[14] A.A. Lukashevskaya, O.V. Naumenko, A. Perrin, D. Mondelain, S. Kassi and A. Campargue, , J. Quant. Spectrosc. Rad. Trans., 130, (2013) 249-259.
[15] A.A. Lukashevskaya, O.V. Naumenko, D. Mondelain, S.Kassi, J. Quant. Spectrosc. Radiat. Transf. 177 (2016) 225-233.
[17] F. Gueye, F. Kwabia Tchana, X. Landsheere, and A. Perrin. J. Quant. Spectrosc. Radiat. Transf. 138 (2014) 60-69.
[18] A. Perrin, L. Manceron , and F. Kwabia Tchana (2020). Mol. Phys. 118 (2020) DOI: 10.1080/00268976.2019.1711235.
[19] A. Perrin, J.-M. Flaud, C. Camy-Peyret, B. Carli, and M. Carlotti. Mol. Phys. 63 (1988) 791-910.
[20] A. Perrin, C. Camy-Peyret, J.-M. Flaud, and J. Kauppinen. J. Mol. Spectrosc. 130 (1988) 168-182.
[21] J.K.G. Watson, in: J.R. Durig (Ed.), Vibrational Spectra and Structure, vol. 6, Elsevier, Amsterdam, 6 (1997) 1–89.
[22] I. C. Bowater, J. M. Brown, and A. Carrington, F.R.S. Proc. B. Soc. Lond. A. 333 (1973) 265-288.
[23] A. Perrin, J.-M. Flaud, C. Camy-Peyret, A.-M.Vasserot, G. Guelachvili, A. Goldman, F.J. Murcray, and R.D.Blatherwick. J. Mol. Spectrosc. 154 (1992) 391-406.
[24] A. Perrin, M. Ndao, and L. Manceron. J. Quant. Spectrosc. Radiat. Transf. 200 (2017) 12-16.
[25] De Bievre P, Holden NE, Barnes IL. J. Phys. Chem. Ref. Data 13 (1984) 809–891.
[26] J.-Y. Mandin, V. Dana, A. Perrin, J.-M. Flaud, C. Camy-Peyret, L. Régalia, and A. Barbe, J. Mol. Spectrosc. 181 (1997) 379-388.
[27] D. C. Benner, T.A. Blake, L.R. Brown, V. Malathy Devi, M.A.H. Smith, and R.A. Toth. J. Mol. Spectrosc. 228 (2004) 593-619.
[29] A. Perrin, J.-M. Flaud, C. Camy-Peyret, D. Hurtmans, and M. Herman and G.Guelachvili. J. Mol. Spectrosc. 168 (1994) 54-66.
[30] S. Reymond-Laruinaz, M. Faye, V. Boudon, D. Doizi, and L. Manceron, , J. Mol. Spectrosc. 336 (2017) 29-35.
[31] M. Faye, M. Bordessoule, B. Kanouté, J.-B. Brubach, P. Roy, L.Manceron, Rev. Sci. Inst. 87, 063119 (2016).
[32] K. Schofield, Evaluated chemical kinetic rate constants for variuous gas phase reactions. J. Phys. Chem. Ref. Data. 2 (1973) 25-84.
[33] A. Perrin, J.-M. Flaud, C. Camy-Peyret, A. Goldman, J.F.Murcray, R.D. Blatherwick, and C.P. Rinsland. J. Mol. Spectrosc. 160, 456–463 (1993).
[34] A. Perrin, J.-M. Flaud, C. Camy-Peyret, D. Hurtmans, D.Hurtmans, and M. Herman. J. Mol. Spectrosc. 177 (1996) 58-65.
[35] T.M. Stephen, A. Goldman, A. Perrin, J.-M. Flaud, F. Keller, and C.P. Rinsland. J. Mol. Spectrosc. 201 (2000) 134-142.
[36] S.Sharpe, T.Johnson, R. Sams, P.Chu, G.Rhoderick, P.Johnson, Appl. Spectrosc. 58 (2004) 1452– 1461.
[37] N. Semmoud-Monnanteuil, J.-M. Colmont, A. Perrin, J.-M. Flaud, and C. Camy-Peyret, J. Mol. Spectrosc. 134 (1989) 176 -182.
[38] C. Camy-Peyret, J.-M. Flaud, A. Perrin, and K. Narahari-Rao, J. Mol. Spectrosc. 95 (1982) 72-79.
[39] A. Perrin, J. -M. Flaud, A. Goldman, C. Camy-Peyret, W.J. Lafferty, Ph. Arcas, and C.P. Rinsland, J. Quant. Spectrosc. Radiat. Transfer. 60 (1998) 839- 850.
[41] A.Delon, and R.Jost, J. Chem. Phys. 95 (1991) 5686-5700. https://doi.org/10.1063/1.461617
[42] A.Perrin, J.-M.Flaud, C.Camy-Peyret, A. N’Gom, R. M’Biake, H. Gbaguidi, and G. Guelachvili, J. Mol. Spectrosc. 171 (1995) 354-357.
List of figures
Fig. 1 : Portion of the P- branch of the strong 3 band of NO2 near 1557 cm-1 (FTS3 bis).
The prediction provided by the GEISA-19 , HITEMP and HITRAN2016-updated linelists are compared. Transitions belonging to the P branch 2+3-2 hot band are identified by their
upper level (0,1,1) in the upper part of the figure. The corresponding predictions by HITEMP or HITRAN2016-updated are quoted. Note that both HITRAN2016-updated and GEISA-19 include the list for the 3 band of 15N16O2, while this is not the case for HITEMP. The “$”
Fig. 2: Portion of the P- branch of the 3 band in the 1555.7 cm-1 spectral range (FTS3 bis).
The GEISA-19, HITEMP, and HITRAN2016-updated linelists are compared. Transitions belonging to the P branch 1+3-1 hot band are identified by their upper level (1,0,1)
rotational quantum numbers on the GEISA-19 trace. The predictions by HITEMP are also quoted. Note that both HITRAN2016-updated and GEISA-19 include the list for the 3 band
of 15N16O
Fig. 3: Portions of the P- branch of the 3 band in the 1561- 1568 cm-1 spectral range. Two
transitions belonging to the P branch 22+3-22 and 1+3-1 hot bands are identified. The
GEISA-19 and HITEMP linelists are compared. . Note that both HITRAN2016-updated and GEISA-19 include the list for the 3 band of 15N16O2, while this is not the case for HITEMP.