First International Conference on Bio-based Building Materials June 22nd - 24th 2015
Clermont-Ferrand, France
ENVIRONMENTAL PERFORMANCE OF NORTH AMERICAN WOOD PANEL
MANUFACTURING
R. Bergman1*, D. Kaestner2, A. Taylor2
1
USDA Forest Products Laboratory, Madison, Wisconsin, United States
2 University of Tennessee, Center for Renewable Carbon, Knoxville, Tennessee, United States
*Corresponding author; e-mail: rbergman@fs.fed.us
Abstract
Manufacturing building products such as wood panels has environmental impacts, including contributions to climate change. This paper is a compilation of four studies quantifying these impacts using the life-cycle assessment (LCA) method on five wood-based panel products made in North America during 2012. LCA is an internationally accepted and standardized method for evaluating the environmental impacts of products. Using LCA, holistic environmental impacts were calculated based on survey data from mills on emissions to air and water, solid waste, energy consumption, and resource use. The present study incorporated cradle-to-gate production of nonwood materials including additives and energy products, such as natural gas and coal, consumed at the production facilities. In addition, primary transport of wood materials to the production facilities was included. These primary data were entered in LCA modeling software on a production unit of 1 m3 of the panel to estimate manufacturing gate-to-gate life-cycle inventory (LCI) flows and major environmental impacts. The LCI flows and environmental impacts were converted to a functional unit of 1 m2 of the wood panel (i.e., final product) produced. The following products were evaluated with their stated panel thicknesses in millimeters: oriented strandboard (9.5), southeast (SE) and Pacific Northwest (PNW) softwood plywood (9.5), cellulosic fiberboard (12.7), and hardboard (3.2). Results are provided here on cumulative energy consumption and global warming impacts. Cumulative energy consumption was 74.0, 73.5 (SE), 68.7 (PNW), 76.0, and 88.3 MJ/m2, with biomass energy percentage of
50%, 50% (SE), 64% (PNW), 12%, and 47 %, respectively. Global warming impact was 1.97, 1.90 (SE), 1.23 (PNW), 3.91, and 2.47 kg CO2-equivalent/m2, respectively. The panel products
evaluated here are mostly not interchangeable, thus results for the panel products should not be compared. Using woody biomass energy for panel production reduces their impact on climate change.
Keywords:
wood panels, life-cycle analysis, GHG, climate change, building materials
1 INTRODUCTION
The manufacture of building products such as wood panels has environmental impacts, including contributions to climate change. Categorizing these impacts would help in identifying environmental “hotspots” and building products with lower environmental impacts.
Buildings consume approximately 41% of all energy used in the United States [USDOE 2014]. Although much energy is used during building occupation, there is increased interest in reducing the embodied energy—the amount of energy used in manufacturing of building components—as part of the overall goal of reducing the environmental footprint of a building. Green construction practices have evolved considerably over the past 30 years in an effort to reduce energy consumption, improve overall building
performance, and move toward more sustainable practices. In practice, green building began as a series of prescriptions that experts thought were the most vital to move construction toward sustainability goals. Green building has now grown to include life-cycle analysis, which provides insight to improving energy and material efficiency throughout the material production and building construction and operation while lowering the overall environmental burdens throughout the building’s whole life cycle.
Classifying building materials that have positive environmental aspects is one result of the increased attention to green building practices. These practices may include using building materials with lower environmental impacts as well as reusing the old product, recycling the old product into a new one, or reducing the quantity of building materials capable of performing the same function. In addition, building codes and standards such as the National Green
Building Standard are implementing performance-based decision-making based on scientific approaches, including life-cycle analysis [Bowyer et al. 2012].
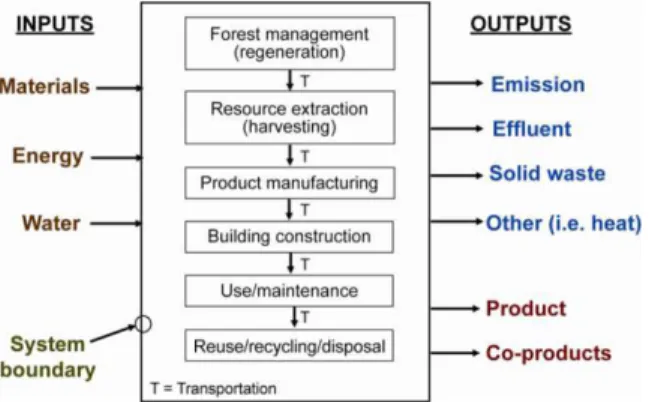
Life-cycle assessment (LCA) is the internationally accepted and standardized method for evaluating the environmental impacts of products. LCA is a scientific approach to measuring the holistic environmental impacts of a product, including resources consumed and emissions released along the associated environmental impacts. A LCA can cover the life of a product from extraction of raw materials to product production point (i.e., “cradle-to-gate”) or through distribution, use, and to its final disposal point (i.e., “cradle-to-grave”) (Fig. 1) [ISO 2006a, b; Wolf et al. 2012].
Fig 1 : Complete life cycle from regeneration of trees to disposal of wood materials.
LCAs are composed of four stages (phases) as defined by the International Organization of Standardization (ISO): (1) goal and scope definition, (2) life-cycle inventory (LCI) analysis, (3) life-cycle impact assessment (LCIA), and (4) interpretation (Fig. 2). An LCA study includes all stages, but an LCI study does not include stage 3. The goal and scope provide the study framework and explain how and to whom results are to be communicated.
Fig 2 : Four stages of life-cycle assessment.
An LCI measures all raw material and energy inputs and associated environmental outputs to manufacture a particular product, process, or service on a per unit basis within carefully defined system boundaries. Many earlier life-cycle analyses for North American wood products were simply LCI studies, not LCA studies, and therefore did not include the LCIA phase. The main focus of these earlier LCI studies and subsequent LCI data developed were to populate LCI databases to be further used by other LCA practioners. LCIAs as part of an LCA study use LCI flows to examine impacts for four areas: human health, social health, resource depletion, and ecosystem function. In the interpretation stage, alternatives for action to reduce impacts are systematically evaluated [ISO 2006a, b; Wolf et al. 2012].
The goal of this paper is to document the gate-to-gate LCA of wood panel production for North America for oriented strandboard (OSB), softwood plywood, cellulosic fiberboard, and hardboard. Softwood
plywood was evaluated for the southeast and Pacific Northwest United States. Hardboard panel product includes engineered wood siding and trim. Some LCI analyses on cellulosic fiberboard and hardboard have been completed and were used in the present study for development of environmental performances [Bergman 2014a, b; Bergman 2015a, b]. We evaluated material flow, energy consumption, and emissions for wood panel manufacturing process on a per-unit basis (i.e., functional unit) of 1 m2. Primary data were collected by visiting the wood panel manufacturers and administering a questionnaire. Peer-reviewed literature referencing pre-existing LCI datasets provided secondary data per Consortium for Research on Renewable Industrial Material (CORRIM) guidelines [CORRIM 2014]. Secondary data sources were used for fuels and electricity. Wood mass balances were constructed with a spreadsheet algorithm using data from primary and secondary sources. From material and energy inputs and reported emissions, SimaPro 8 software (PRé Consultants, Amersfoort, Netherlands) was used to model the estimates for raw material consumption and environmental outputs on a per-functional unit basis [PRé Consultants 2015]. The study used the U.S. LCI Database for secondary LCI data inputs such as fuels and electricity [NREL 2012]. This study includes the LCIA impact categories of global warming (kg CO2-eq), acidification (kg SO2-eq),
eutrophication (kg N-eq), ozone depletion (kg CFC-11-eq), and smog (kg O3-eq) [Bare 2011]. Other impact
measures included cumulative (total) energy demand (primary energy) (MJ-eq), including both biomass and fossil fuel contributions, which were calculated and reported directly from LCI flows. We also tracked fresh water consumption (in L) and renewable and nonrenewable material resource consumption (nonfuel resources). Impact categories and other impact measures were reported per 1 m2 of production. Previous LCA studies have been completed in the United States on softwood panel products. LCI flows for OSB and softwood plywood were estimated more than 10 years ago and thus must be re-inventoried for documentation for LCA-based eco-labels referred to as environmental product declarations [ISO 2006c; Bergman and Taylor 2011; PCR 2013]. The original U.S. LCI studies [Kline 2005; Wilson and Sakimoto 2005] were updated as part of a larger research effort into LCAs. Puettmann et al. [2013a,b,c] reported cumulative energy consumption of 90.7, 58.9, 47.5 MJ/m2, with biomass energy percentage of 41.9%,
59.0%, and 56.0% for Southeastern (SE) U.S. OSB, SE U.S. softwood plywood, and Pacific Northwest (PNW) U.S. softwood plywood, respectively. In addition, global warming impacts (GWIs) of 2.62, 1.27, and 0.98 kg CO2-eq/m2 were estimated, respectively.
Lower than U.S. values, Canadian LCIA results reported cumulative energy consumption for OSB and softwood plywood of 43.8 and 24.2 MJ/m2, respectively, with biomass energy percentage of 54.6% and 60.1%. Additionally, GWIs of 1.07 and 0.49 kg CO2-eq/m2 were estimated, respectively [ASMI
2012a, b]. Electricity consumed for the Canadian production of OSB and softwood plywood is dominated by hydro power.
2 METHOD
This paper is a compilation of four studies quantifying environmental impacts using the LCA method on five
wood-based panel products made in North America during 2012.
2.1 Scope
This study covered the manufacturing stage of wood panel production from forest landing to final product leaving the mill according to ISO 14040 and 14044 standards [ISO 2006a, b; Wolf 2012]. LCA data from this study will help conduct a cradle-to-gate LCA for wood panels in preparation for developing environmental product declarations (EPDs), a Type III LCA-based eco-label [ISO 2006c]. To construct a cradle-to-gate LCA, this manufacturing LCA will be linked to forest resources (upstream) LCA data from the U.S. LCI Database [NREL 2014]. This manufacturing stage LCA provided a gate-to-gate analysis of cumulative energy of manufacturing and transportation of raw materials. Analyses included wood panel’s contribution to cumulative energy consumption and five LCIA impact categories.
2.2 Manufacturing process
Manufacturing engineered wood products such as wood panels requires electricity for breaking down wood raw material (i.e., feedstock) and thermal energy to dry wood raw material and set adhesives. Amount of thermal energy depends on the panel product’s manufacturing process. The following describes the individual panel production processes.
Oriented strandboard
Oriented strandboard (OSB) is an engineered structural panel produced from wood strands and bounded with resin [Stark et al. 2010]. The initial production step requires roundwood, which is debarked and processed into wood strands. The produced green strands are dried with thermal energy produced by by-products, such as wood residues or bark, and fossil energy sources. After the screening process where fines and too-small strands are removed, the strands are blended with resin. The commonly used resin systems are phenol formaldehyde (PF) and methylene diphenyl diioscyanate (MDI). The blended flakes are formed to a mat with cross-directional layers and are pressed under the combination of pressure and temperature to produce a rigid and dense board. The OSB boards are cooled, sawn to appropriate size, grade stamped, staked in bundles, and packaged for shipping. The significant thermal energy needed for production is mainly met by burning wood by-products. For cleaning process air, emission control devices, which require a significant amount of gas or electricity, are employed.
Softwood plywood
Softwood plywood is manufactured of cross-wise layers of peeled veneer and glued together with resin. The delivered logs are debarked and conditioned with hot water or steam to soften the wood structure for the peeling process. The logs are peeled in the lathe, clipped, and sorted by moisture content. The green veneer gets dried to a moisture content of 4% to 8%. In the layup process, resin is applied on the veneer and panels are composed for the hot-pressing process. After pressing, the panels are sawn to appropriate dimensions, stacked in bundles, and packaged for shipping. Burning wood by-products and fossil energy sources met most of the thermal energy needed for conditioning, drying, and pressing.
Cellulosic fiberboard
Cellulosic fiberboard is produced from industrial wood residues (such as shavings, sawdust, and chips produced from primary log breakdown), from whole-tree chips, and from mixed paper and construction waste. Manufacturing cellulosic fiberboard uses a wet process that produces a low-density wood composition panel and is often referred to as insulation board. Density for final products ranges from 12 to 24 lb/ft3 (190 to 380 kg/m3) [Suchsland and Woodson 1986;
USEPA 2002; Stark et al. 2010; ASTM International 2012]. A thermo-mechanical process reduces the wood raw material and binds the fibers with a starch for recombination into cellulosic fiberboard. Other additives may include alum, clay, and wax. Asphalt is added in the mix to improve strength properties. In addition, cellulosic fiberboard may be coated with asphalt for exterior uses. Adding water to the fiber creates a slurry (similar to the paper-making process) that is then transformed into a fiber mat. Presses and large dryers are used to remove water; this process also releases volatile organic compounds. Water usage is of particular concern because plants without any water conservation can use 100 tons of water per ton (22,700 L/m3) of cellulosic fiberboard [Suchsland and Woodson 1986].
Hardboard
Manufacturing hardboard in North America currently uses either a wet- or dry- production process to create high-density wood composition panels [CPA 2012a,b]. In the past, hardboard was produced in North America using a semidry process, but no longer. The semidry process was used to lower resin and water usage while maintaining more of the properties found in wet-process hardboard [Myers 1986]. Density for final products ranges from 800 to 1,100 kg/m3 [USEPA 2002; Bowyer et al. 2007; Gonzalez-Garcia et al. 2009; Stark et al. 2010]. Thermo-mechanical processes reduce the wood chip raw material to fibers. Resins are added to the fiber before or during mat forming, and then the (dry or wet) mats are pressed to create the hardboard panel. Hardboard may be ‘tempered’ with oil and heat after pressing to improve water-resistance properties [Suchsland and Woodson 1986]. Final products made from uncoated hardboard, commonly called “dealer board,” include case-goods, paneling, and pegboard.
2.3 Functional unit
Defining system boundaries sets the unit processes to include standardized material flows, energy use, and emission data. The present study selected a functional unit of 1.0 m2 of wood panels with a specified basis
Tab. 1 lists the reference flows for the wood panels [Bergman 2014a, b; Bergman 2015a, b]. The reference flows transform the functional unit into specific product flows for the product systems. Additionally, panel thickness varied from 3.175 to 12.7 mm for the various wood panel products. Primary data and LCIA results were reported per 1.0 m2 of final product.
2.4 System boundary
Boundary selection helps track the material and energy flows crossing the boundary. To track flows tied to wood panel production, cumulative instead of on-site system boundaries were considered (Fig 3). On-site
system boundaries track only what occurs at the production site, whereas a cumulative system boundary includes what happens not only on-site but off-site as well, including fuel resources used for
cradle-to-gate production of energy, additives, and grid electricity. Off-site emissions come from transporting feedstocks and additives, electricity generation, and
fuels produced off-site but consumed on-site. Ancillary material data, such as motor oil and greases, were collected and were part of the analysis.
Tab. 1 Reference flows for North American wood panels, 1 m2
Fig 3 : System boundary for wood panel production
2.5 Data quality
To ensure high-quality data, the goal of these studies was to survey a minimum of 20% of wood panel production in the given wood panel industry. Survey data were collected from OSB, softwood plywood, cellulosic fiberboard, and hardboard manufacturers at 33%, 43%, 96%, and 42%, respectively.
The researchers collected process-specific (i.e., primary) annual data from each production facility wherever possible. Primary data obtained from the surveyed mills were weight-averaged [Milota 2004]:
(1) where is the weighted average of values reported by the mills, is the reported mill value, and is the fraction of the mill’s value to total production of the surveyed mills for that specific value.
2.6 Allocation rules
All allocations were based on the mass of products and co-products.
2.7 Cutoff rules
According to the Product Category Rule (PCR) for North American Structural and Architectural Wood Products [PCR 2013], if the mass/energy of a flow is less than 1% of the cumulative mass/energy of the model flow, then it may be excluded, provided its environmental relevance is minor. This analysis included all energy and mass flows for primary data. 2.8 Assumptions and limitations
Assumptions and limitations can include omissions of life cycle stages, processes, and input or output flows. Human labor and the manufacturing LCA of the machinery and infrastructure were outside the system boundaries and therefore were not included.
3 RESULTS
Detailed primary data on mass flow, energy consumption, and fuel types were obtained from the wood panel surveys and collated with upstream process data for grid electricity and other inputs included in the SimaPro analysis and databases to produce the LCI and LCIA data for the four wood panel products: OSB, SE and PNW softwood plywood, cellulosic fiberboard, and hardboard. We modeled the weight-averaged survey data to estimate nonwood raw material use, emission data, and environmental impacts on a 1-m2 unit basis.
Using SimaPro 8, the life-cycle data were compiled into impact measures using the TRACI (tool for the reduction and assessment of chemical and other environmental impacts) [Bare 2011] impact estimation method. Other renewables category included wind, solar, geothermal, and hydroelectric. 3.1 Oriented strandboard
Tab. 2 shows environmental impacts of producing 1 m2 of OSB. Cumulative energy consumption was
74.0 MJ/m2, with biomass energy percentage of 50.0%. GWI was 1.97 kg CO2-eq/m2.
Tab. 2 : Environmental performance of 1 m2 9.5-mm-thick oriented strandboard, U.S. average,
gate-to-gate (mass allocation)
Impact category Unit
Global warming kg CO2-eq 1.97
Acidification kg SO2-eq 0.020
Eutrophication kg N-eq 9.49E-04 Ozone depletion kg CFC-11-eq 6.04E-09
Smog kg O3-eq 0.264 Primary energy Consumption Unit Nonrenewable, fossil MJ 31.92 Nonrenewable, nuclear MJ 4.59 Renewable, other MJ 0.49 Renewable, biomass MJ 36.96 Total Primary Energy MJ 74.0 Material resources
consumption (Nonfuel) Unit
Nonrenewable materials kg 0.05 Renewable materials kg 4.97
Fresh water L 1.49
Waste generated Unit
Solid waste kg 0.0320
Southeast softwood plywoodErreur ! Référence non valide pour un signet. shows environmental impacts
Wood panel Density
(oven-dry kg/m3) Panel thickness (mm) Reference flow (m3) Oriented strandboard, southeast United States 597 9.5 0.0095 Softwood plywood, southeast United States 517 9.5 0.0095 Softwood plywood, Pacific Northwest United States 458 9.5 0.0095 Cellulosic fiberboard, North America 254 12.7 0.0127
of producing 1 m2 of SE softwood plywood. Cumulative energy consumption was 73.5 MJ/m2,
with biomass energy percentage of 50.1%. GWI was 1.90 kg CO2-eq/m2.
Tab. 3 : Environmental performance of 1 m2 9.5-mm-thick softwood plywood, U.S. Southeast, gate-to-gate
(mass allocation)
Impact category Unit
Global warming kg CO2-eq 1.90
Acidification kg SO2-eq 0.019
Eutrophication kg N-eq 5.40E-04 Ozone depletion kg CFC-11-eq 1.18E-09
Smog kg O3-eq 0.209 Primary energy Consumption Unit Nonrenewable, fossil MJ 31.72 Nonrenewable, nuclear MJ 4.70 Renewable, other MJ 0.28 Renewable, biomass MJ 36.78 Total Primary Energy MJ 73.5 Material resources
consumption (Nonfuel) Unit
Nonrenewable materials kg 0.03 Renewable materials kg 7.07
Fresh water L 6.69
Waste generated Unit
Solid waste kg 0.119
3.2 Pacific Northwest softwood plywood
Tab. 4 shows environmental impacts of producing 1 m2 of softwood plywood. Cumulative energy
consumption was 68.7 MJ/m2, with biomass energy
percentage of 64.0%. GWI was 1.23 kg CO2-eq/m2.
Tab. 4 : Environmental performance of 1 m2 9.5-mm-thick softwood plywood, U.S. Pacific Northwest,
gate-to-gate (mass allocation)
Impact category Unit
Global warming kg CO2-eq 1.23
Acidification kg SO2-eq 0.014
Eutrophication kg N-eq 4.78E-04 Ozone depletion kg CFC-11-eq 9.60E-10 Smog pot. kg O3-eq 0.189
Primary energy Consumption Unit Nonrenewable, fossil MJ 21.11 Nonrenewable, nuclear MJ 2.23 Renewable, other MJ 1.40 Renewable, biomass MJ 43.99 Total Primary Energy MJ 68.7 Material resources
consumption (Nonfuel) Unit
Nonrenewable materials kg 0.06 Renewable materials kg 6.39
Fresh water L 6.03
Waste generated Unit
Solid waste kg 0.598
Cellulosic fiberboardErreur ! Référence non valide pour un signet. shows environmental impacts of producing 1 m2 of cellulosic fiberboard. Cumulative energy consumption was 76.0.3 MJ/m2, with biomass
energy percentage of 12.2%. GWI was 3.83 kg CO2
-eq/m2.
Tab. 5 : Environmental performance of 1 m2 12.7-mm-thick cellulosic fiberboard, North American
average, gate-to-gate (mass allocation)
Impact category Unit
Global warming kg CO2-eq 3.83
Acidification kg SO2-eq 0.107
Eutrophication kg N-eq 5.58E-03 Ozone depletion kg CFC-11-eq 1.27E-07
Smog kg O3-eq 2.72 Primary energy Consumption Unit Nonrenewable, fossil MJ 57 Nonrenewable, nuclear MJ 5.80 Renewable, other MJ 3.74 Renewable, biomass MJ 9.27 Total Primary Energy MJ 76.0 Material resources
consumption (Nonfuel) Unit
Nonrenewable materials kg 0.039 Renewable materials kg 3.10
Fresh water L 16.5
Waste generated Unit
Solid waste kg 0.072
3.3 Hardboard
Tab. 6 shows environmental impacts of producing 1 m2 of hardboard. Cumulative energy consumption
was 88.3 MJ/m2, with biomass energy percentage of 46.9% (41.7/88.3). GWI was 2.47 kg CO2-eq/m2.
Tab. 6 : Environmental performance of 1 m2 3.2-mm-thick hardboard/EWST, North American average,
gate-to-gate (mass allocation).
Impact category Unit
Global warming kg CO2-eq 2.47
Acidification kg SO2-eq 0.085
Eutrophication kg N-eq 6.81E-03 Ozone depletion kg CFC-11-eq 2.73E-07
Smog kg O3-eq 2.47 Primary energy Consumption Unit Nonrenewable, fossil MJ 40.25 Nonrenewable, nuclear MJ 5.98 Renewable, other MJ 0.650 Renewable, biomass MJ 41.46 Total Primary Energy MJ 88.3 Material resources
consumption (Nonfuel) Unit
Nonrenewable materials kg 0.039 Renewable materials kg 3.10
Fresh water L 16.5
Waste generated Unit
Solid waste kg 0.072
4 SUMMARY
This paper summarizes the environmental impacts associated with gate-to-gate manufacturing of North American wood panel production. The panel products evaluated here are mostly not interchangeable, thus results for the various products should not be compared. Using woody biomass energy for panel production reduces their impact on climate change.
Panel thickness varied between the various wood panel products, ranging from 3.175 to 12.7 mm.
Therefore, LCIA results are better representative when shown by area with a given basis, as in the present analysis.
Over the entire life cycle of wood panel products, the manufacturing stage typically consumes the most energy and releases the highest GHG emissions because of the electricity used for breaking down the raw material and the energy-intensive nature of the drying process. The release of GHG emissions is especially high when fossil fuels are consumed to generate steam (i.e., thermal energy) for the dry kilns. Using woody biomass instead of fossil fuels would lower the GWI of the various wood panel products produced.
5 ACKNOWLEDGMENTS
Primary funding for the cellulosic fiberboard project was through a cooperative agreement between the USDA Forest Service Forest Products Laboratory and the North American Fiberboard Association (13-CO-11111137-017). FPInnovations provided additional funding. Funding for the hardboard project was through a cooperative agreement between the USDA Forest Service Forest Products Laboratory and the Composite Panel Association (13-CO-11111137-014). We especially thank those companies and their employees that participated in the surveys to obtain primary production data. 6 REFERENCES
ASMI; A cradle-to-gate life cycle assessment of Canadian oriented strand board: An update. Athena Sustainable Materials Institute. Ottawa, Canada. 51 pp. 2012a.
ASMI; A cradle-to-gate life cycle assessment of Canadian softwood plywood sheathing: An update. Athena Sustainable Materials Institute. Ottawa, Canada. 51 pp. 2012b.
ASTM International; Standard specification for cellulosic fiber insulating board. American Society for Testing and Materials. ASTM C208-12. West Conshohocken, PA. 58-61. 2012.
Bare, J.C.; TRACI 2.0: the tool for the reduction and assessment of chemical and other environmental impacts 2.0. Clean Technologies and Environmental Policy October 2011, 13:687–696.
Bergman, R.D.; Life-cycle inventory analysis of cellulosic fiberboard production in North America. In: Proceedings, Society of Wood Science and Technology 57th International Convention. June 23-27, 2014. Zvolen, Slovakia: 542-550. 2014a
Bergman, R.D.; Gate-to-gate life-cycle inventory of hardboard production in North America. In: Proceedings, 48th International Wood Composite Symposium. April 30-May 1, 2014. Seattle, WA. 9 p. 2014b.
Bergman, R.D.; Cradle-to-gate life-cycle inventory of cellulosic fiberboard produced in North America. CORRIM Final Report. University of Washington. Seattle, WA. 58 p. 2015a.
Bergman, R.D.; Cradle-to-gate life-cycle inventory of hardboard and engineered wood siding and trim produced in North America. CORRIM Final Report. University of Washington. Seattle, WA. 79 p. 2015b. (In Press).
Bergman, R.D,; Taylor, A.; Environmental product declarations of wood products—An application of life cycle information about forest products. Forest Products Journal 2011, 61(3):192-201.
Bowyer. J.; Howe, J.; Stai, S.; Trusty, W.; et al.; The international green construction code implications for materials selection in commercial construction. Dovetail Partners, Inc. 16 pp. 2012
Bowyer, J.L., Shmulsky, R.; Haygreen, J.G.; Forest products and wood science and—An introduction. Fifth Edition. Blackwell Publishing, Ames, IA. 2007. CORRIM; Research guidelines for life-cycle inventories (draft). Consortium for Research on Renewable Industrial Materials (CORRIM), Inc., University of Washington, Seattle, WA. 40 pp. 2014. CPA; Eco-certified composite sustainability standard CPA 4-11. Composite Panel Association. Leesburg, VA. 12 pp. 2012a.
CPA; American National Standard: Basic hardboard. ANSI A135.4-2012. Composite Panel Association, Leesburg, VA. 12 pp. 2012b.
Gonzalez-Garcia, S.; Feijoo, G.; Widsten, P.; Kandelbauer, A.; et al.; Environmental performance assessment of hardboard manufacture. International Journal of Life Cycle Assessment 2009, 14:456-466. ISO; Environmental management—life-cycle assessment—principles and framework. ISO 14040, ISO, Geneva, Switzerland, International Organization for Standardization 20 pp, 2006a.
ISO Environmental management—life-cycle assessment—requirements and guidelines. ISO 14044, ISO, Geneva, Switzerland, International Organization for Standardization. 46 pp, 2006b. ISO. Environmental labels and declarations—Type III environmental declarations—Principles and procedures. ISO 14025. International Organization for Standardization, Geneva, Switzerland. 25 pp, 2006c.
Kline, E.D.; Gate-to-gate life-cycle inventory of oriented strandboard production. Wood and Fiber Science 2005, 37(CORRIM Special Issue):74-84. ISSN 0735-6161.
Milota, M.R.; Softwood lumber—Pacific Northwest Region. CORRIM Phase I Final Report Module B. University of Washington, Seattle, WA. www.corrim.org/reports/. 75 pp. 2004.
Myers, G.C.; A comparison of hardboards manufactured by semidry-, dry-, and wet-formed processes. Forest Products Journal 1986, 36(7/8):49-56.
NREL; Life-cycle inventory database project. National Renewable Energy Laboratory. www.lcacommons.gov/nrel/search. 2012. (April 29, 2015).
PCR; Product Category Rule (PCR): For preparing an Environmental Product Declaration (EPD) for North American Structural and Architectural Wood Products. UN CPC 31. NAICS 21. 17 pp. 2013. https://fpinnovations.ca/ResearchProgram/environme nt-sustainability/epd-program/Documents/wood- products-pcr-version-v1.1-may-2013-lastest-version.pdf. (April 29, 2015).
PRé Consultants; SimaPro 8 Life-Cycle assessment software package, Version 8. Plotter 12, 3821 BB Amersfoort, The Netherlands. http://www.pre.nl; 2015.
Puettmann, M.; Oneil, E.; Kline, E.; Johnson, L.; Cradle to gate life cycle assessment of oriented strandboard production from the Southeast. CORRIM. University of Washington, Seattle, WA, 34 pp. 2013a.
Puettmann, M.; Oneil, E.; Wilson, J.; Johnson, L.; Cradle to gate life cycle assessment of softwood plywood production from the Southeast. CORRIM. University of Washington, Seattle, WA, 34 pp. 2013b. Puettmann, M.; Oneil, E.; Wilson, J.; Johnson, L.; Cradle to gate life cycle assessment of softwood plywood production from the Southeast. CORRIM. University of Washington, Seattle, WA, 35 pp. 2013c. Stark, N.M.; Cai, Z; Carll, C.; Wood-based composite materials: Panel products, glued-laminated timber, structural composite lumber, and wood–nonwood composite materials. In: Wood handbook—wood as an engineering material. Gen Tech Rep FPL–GTR– 113. U.S. Department of Agriculture, Forest Service, Forest Products Laboratory. Madison, WI pp. 11-1– 11-28. 2010.
Suchsland, O.; Woodson, G.E.; Fiberboard manufacturing practices in the United States.
Agriculture Handbook No. 640. Washington, DC: U.S. Department of Agriculture, Forest Service. 263 pp. 1986.
USDOE; 2011 Buildings Energy Data Book. Chapter 1: Buildings Sector. 1.1 Buildings Sector Energy Consumption. 1.1.3 Buildings Share of U.S. Primary Energy Consumption (Percent); Washington D.C. United States Department of Energy. 2014.
USEPA; AP 42 Section 10.6.4 Hardboard and fiberboard manufacturing. United States Environmental Protection Agency. pp. 10.6.4-1-38. 2002.
Wilson, J.B.; Sakimoto, E.T.; Gate-to-gate life-cycle inventory of softwood plywood production. Wood and Fiber Science 2005, 37(CORRIM Special Issue):58-73. ISSN 0735-6161.
Wolf, M.A.; Pant, R.; Chomkhamsri, K.; Sala, S.; Pennington, D.; The International Reference Life Cycle Data System (ILCD) Handbook. European Commission. Joint Research Centre, 2012. Available at
http://publications.jrc.ec.europa.eu/repository/handle/ JRC66506. (April 29, 2015).