HAL Id: hal-00566226
https://hal.archives-ouvertes.fr/hal-00566226
Submitted on 15 Feb 2011HAL is a multi-disciplinary open access
archive for the deposit and dissemination of sci-entific research documents, whether they are pub-lished or not. The documents may come from teaching and research institutions in France or abroad, or from public or private research centers.
L’archive ouverte pluridisciplinaire HAL, est destinée au dépôt et à la diffusion de documents scientifiques de niveau recherche, publiés ou non, émanant des établissements d’enseignement et de recherche français ou étrangers, des laboratoires publics ou privés.
Stark effect and Franz-Keldysh effect of a quantum wire
realized by conjugated polymer chains of a diacetylene
3NPh2
Gerhard Weiser, Laurent Legrand, Thierry Barisien, Antoine Al Choueiry,
Michel Schott, Sylvain Dutremez
To cite this version:
Gerhard Weiser, Laurent Legrand, Thierry Barisien, Antoine Al Choueiry, Michel Schott, et al.. Stark effect and Franz-Keldysh effect of a quantum wire realized by conjugated polymer chains of a diacetylene 3NPh2. Physical Review B: Condensed Matter and Materials Physics (1998-2015), American Physical Society, 2010, 81 (12), pp.125209-1-125209-11. �10.1103/PhysRevB.81.125209�. �hal-00566226�
Stark e¤ect and Franz-Keldysh e¤ect of a quantum wire realized
by conjugated polymer chains of a novel diacetylene 3NPh2
Gerhard Weiser
Fachbereich Physik, Philipps-Universität Marburg, 35032 Marburg, Germany
Laurent Legrand, Thierry Barisien, Antoine Al Choueiry and Michel Schott Institut des NanoSciences de Paris (INSP), UMR 7588/CNRS,
Université Pierre et Marie Curie (Paris 6),
Campus Boucicaut, 140 rue de Lourmel, 75015 Paris, France
Sylvain Dutremez
Institut Charles Gerhardt Montpellier,
UMR 5253/CNRSUM2-ENSCM-UM1, Equipe CMOS, Université Montpellier II, Place Eugène Bataillon,
34095 Montpellier Cedex 5, France
Abstract
Conjugated polymer chains diluted in monomer single crystals of a novel diacetylene, 1,10-bis(diphenylamino)-4,6-decadiyne, represent quantum wires of long range coherence. They di¤er from most polydiacetylenes by their repeat unit that consists of two C4 units with twisted molecular
planes. The resulting modi…cation of exciton and band states is studied by electroabsorption which resolves an increase of the exciton transition energy to 2.399 eV and of the free electron gap to 3.158 eV. The Stark shift of the exciton reveals a signi…cant reduction of the exciton radius by about 40 % to 6 1 Å which is consistent with a similar increase of the exciton binding energy to 759 meV. The lineshape of electroabsorption spectra at the free electron gap is for …elds larger than 30 kV/cm in accordance with the one-dimensional Franz-Keldysh e¤ect and yields a reduced mass of 0.07 m0 larger than in other PDA. Spectra at smaller …elds are distorted by contributions
of a weak dipole allowed and a forbidden exciton 38 and 12 meV, respectively below the bandgap. Coherent coupling of free electrons and vibrational modes leads to replicas of the Franz-Keldysh e¤ect. Since light polarized parallel to the conjugated chain excites two propagating modes in the monomer crystals the quantitative analysis was restricted to EA spectra taken with perpendicular polarization in samples which transmit only the weakly absorbed polariton mode.
PACS numbers: 78.40.Me, 71.35.Cc, 71.70.Ej, 78.20.Jq.
I. INTRODUCTION
Polydiacetylenes (PDAs) are still unique among conjugated polymers since they can be prepared through solid-state polymerization in a highly ordered state.1 Large sidegroups
attached to the diacetylene molecule reduce interchain interaction while -conjugation delo-calizes the corresponding electron states. As criteria were developed for successful polymer-ization in monomer single crystals2–7two classes of PDAs emerged with a strong fundamental
exciton centered either near 2.0 eV or 2.3 eV which are called blue and red chains by the color of partially polymerized crystals. Despite that di¤erence X-ray and Raman studies indicate the same basic building block, C C C=C . Long range coherence within the polymer chains enables in some cases the detailed study of their electronic structure by electroabsorption spectroscopy as in wide band semiconductors. The free electron gap is resolved by a pronounced Franz-Keldysh e¤ect although its absorption is hidden under vi-bronic progressions of a strong exciton which responds to an external …eld by a quadratic Stark shift.8 The EA spectra yield not only the band gap and an exciton binding energy of about 500 meV but derive from …eld broadening of Franz-Keldysh oscillations a reduced mass of about 0:05mo of blue chains in DCH polymer single crystals9 and those diluted in
monomer single crystals of 3BCMU and 4BCMU,10 much smaller than the free electron mass m0.
Controlled polymerization in single crystals provides -conjugated chains with properties expected for quantum wires of very small radius and luminescence studies on red chains of 3BCMU proved the one-dimensional density of states of the exciton band.11,12 Coherent
coupling of excitons on a single chain to a propagating laser …eld was veri…ed by micro-‡uorescence13 and by spatially coherent emission of a single chain.14,15 By increasing the
density of blue chains coherent coupling of excitons to radiation modes of the monomer crys-tal leads to a tightly bound polariton which enables transmission of light in resonance to the exciton through thick crystals of 3BCMU.16,17Despite such unique properties the very same
C4 building block leaves little room for variation of these quantum wires. A promising
mod-i…cation is doubling the repeat unit as in poly-THD (1,6-bis(diphenylamino)-2,4-hexadiyne) where C4 units are alternatively tilted by 7.5 degrees relative to their average plane.18,19
The large thermal reactivity of this monomer prevented studies of highly diluted chains but electrore‡ectance spectra of opaque crystals resolved the exciton at 2.171 eV and the band
TABLE I: Crystal parameter of 3NPh2 at 180 K.20 a (Å) b (Å) c (Å)
9.9484 16.0893 16.7643 98.697o Z=4, V= 2652.5 Å3, M=468.62 gmol-1
gap at 2.727 eV.19 Although the exciton transition energy is larger than that of blue chains the binding energy 0.56 eV is similar and lends no support to a signi…cant change of the electronic structure.
Synthesis of several analogues of THD led to 3NPh2, (1,10-bis(diphenylamino)-4,6-decadiyne), as material of proper reactivity for controlled polymerization. Two pairs of molecules with twisted molecular planes stack along the a-axis of the monomer crystal and polymerization proceeds along that axis. The inequivalent molecules in the host crystal double the polymer repeat unit and calculations indicate substantial tilting of the C4 units
by 20 degrees.20 Absorption and luminescence spectra submitted in context with the present paper show a remarkable increase of the exciton transition energy to 2.4 eV, larger than in any other PDA.21 We present here supplementary electroabsorption spectra which
despite unexpected birefringence e¤ects con…rm not only the anticipated change of the elec-tronic structure but show an excellent agreement of the spectra at the bandgap with the Franz-Keldysh e¤ect of a one-dimensional energy band.
II. EXPERIMENTAL DETAILS
The molecules crystallize in the monoclinic space group P21/n with Z = 4 (table 1) and pile up along the a-axis with alternating stacking distance of 4.917 Å and 5.329 Å. The lattice constant a = 9.948 Å is slightly larger than twice the usual C4 repeat unit of relaxed
PDA chains. Details of the structure and polymerization of 3NPh2 are given elsewhere.20,21 Crystals were grown in the dark from a solution in acetone at 4 C reaching about 5 mm length along the a-axis and their thickness, 0.2 –0.4 mm, was measured by focusing a microscope on the front and back surface. The small initial polymer content was increased by -irradiation from a137Cs source with a dose of 5 krad/min. Cr/Al contacts were evaporated
onto the 0.5-0.7 mm broad (010) face, which as largest face was chosen to apply a sinusoidal …eld of 1 kHz frequency along the polymer backbone. Light from a tungsten halide lamp
or a Xenon arc was dispersed by a single pass monochromator with band pass of 4 Å and 2 Å, respectively, polarized by a calcite polarizer and focused onto the sample which was mounted onto the cold …nger of a He cryostat. The transmitted light was collected by a photomultiplier and its intensity measured by a voltmeter. The modulated part I was analyzed by a lock-in ampli…er tuned to twice the frequency of the applied …eld. The ratio of peak voltage and electrode gap of 0.5 mm de…nes the …eld strength and the change of the absorption constant was derived from the ratio of the relative change of transmitted light intensity and thickness d of the sample.
= 1 d
I
I (1)
Since the lock-in ampli…er returns the e¤ective value of the selected Fourier component the reading has been scaled to the amplitude of I by an appropriate factor which is 2p2 in case of a quadratic response to a sinusoidal …eld.
III. EXPERIMENTAL RESULTS
A. Samples with low polymer content
1. Absorption and electroabsorption spectra
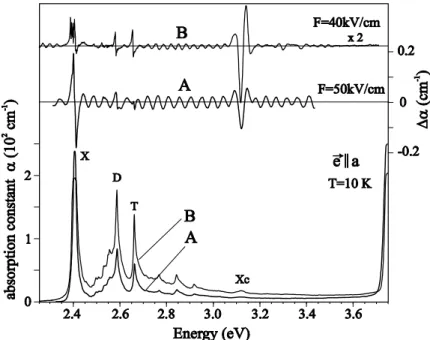
Transmission studies with light polarized parallel to the conjugated chain, !e k a, re-quire samples with low polymer concentration. Fig. 1 compares spectra of samples A and B exposed to -radiation for 1 and 3 min, respectively. All features below the monomer absorp-tion threshold at 3.7 eV belong to transitions of conjugated chains. The absorption spectra show an exciton peak X at 2.4 eV with strong satellites D and T due to coupling to stretch modes of double and triple bond. These features are typical for polydiacetylene and the narrow linewidth con…rms an excellent quality of the samples. Combination modes lead to more peaks at higher energy and additional vibronic excitons appear about 100 meV above the exciton. The spectra show also a small peak Xc at 3.12 eV which does not …t into a vibronic progression. The apparently smaller exciton peak in sample B is an artefact caused by its larger thickness. The corresponding transmittance is about 1 % for the 190 m thick sample A but only 0.07 % for the 360 m thick sample B which is not much above the background of scattered light.
FIG. 1: Absorption and electroabsorption spectra with light polarized parallel to the conjugated chains in samples A and B exposed for 1 and 3 min to -radiation. The EA spectrum of sample B is enlarged as indicated to …t into the scale.
The upper traces in …g. 1 display the electroabsorption spectra. The exciton of sample A responds by a quadratic Stark shift which leads to the derivative-like shape of . Another strong signal of di¤erent lineshape and weaker …eld strength dependence appears at 3.1 eV. Similar signals far above the exciton in other PDA have been attributed to the Franz-Keldysh e¤ect at the free electron gap.8 A new feature is the regular pattern with 46.2 meV period
and almost constant amplitude which is distorted only by the response of the strong vibronic excitons. Sample B with larger polymer concentration shows a similar pattern of 32.6 meV period but smaller amplitude which allows resolving the response of the vibronic excitons D and T. The noisy spectrum at 2.4 eV shows some splitting of the exciton which is also observed in sample A. The most prominent feature occurs again far above the exciton with the strong negative peak at the same energy as the weak absorption peak Xc at 3.12 eV.
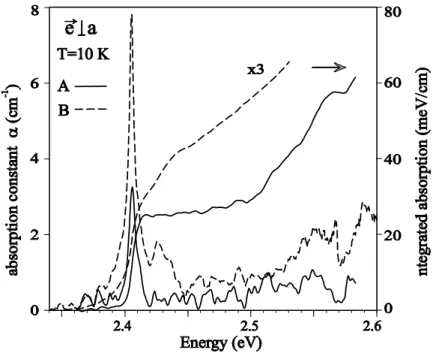
Absorption spectra for light polarized perpendicular to the chain are presented in …g. 2 together with the integrated absorption. The exciton peak of sample A is with 3 cm-1 about
100 times smaller than for polarization parallel to the chain and has smaller linewidth.21 We therefore use the integrated absorption, S = 5.2 eV/cm and 0.027 eV/cm for polarizations parallel and perpendicular to the chain, respectively to derive an optical anisotropy close
FIG. 2: Absorption and integrated absorption for polarization of light perpendicular to the chain.
to 200. The sum rule of the oscillator strength f provides also an estimate of the polymer content xp. f = 4mc 2" 0 hce2 n N Z peak (E)dE = xp fP DA (2)
N = 1:5 1021cm 1 is the density of diacetylene molecules. With n = 1.5 as refractive index
of the host crystal and the typical oscillator strength fPDA= 0.5 of the exciton the fraction
of polymerized diacetylene molecules in sample A is xp = 6 10 5. Since the exciton peak
of sample B is obviously truncated we derive the polymer content xp = 13:2 10 5 from
the peak height of the vibronic satellites D and T which exceeds those in sample A by a factor 2.2. These concentrations yield a polymerization rate dxp=dt = 3:6 10 5=min which
corresponds to a rate of 0.72 %/MRad in satisfactory agreement with the rate 0.75 %/MRad obtained from the weight of insoluble material of -irradiated crystals.21
2. Optical birefringence
The periodic pattern of the EA spectra and the saturated optical density of the exciton for light polarized along the chain in samples of higher polymer content results from opti-cal birefringence of the monoclinic crystal. The saturation cannot result from undamped
propagation of a tightly bound polariton state of exciton and photon as in 3BCMU since it is independent of temperature.16 Light of polarization !e k a provides best coupling to the transition dipoles of the chain but excites on the ac face two propagating electromag-netic waves of orthogonal polarization since only the b-axis de…nes a principal axis of the dielectric tensor.22 The other axes lie in the ac plane and electric …elds polarized along these
axes propagate with refractive indices n1 and n3. If the axis n1 is rotated by out of the
a-axis the orthogonal mode with refractive index n3 acquires the fraction sin2 of light with
polarization !e k a (…g. 3). Measurements with crossed polarizers indicate a rotation by = 2:5o 1o which couples 0.2 % of light of polarization !e
k a into the weakly absorbed mode. Since light polarized perpendicular to the chain, !e ? a,.excites also the strongly absorbed mode its absorption is enhanced which reduces the optical anisotropy further. The true anisotropy of the exciton therefore is obscured by the birefringence of the crystal since the exciton dipole ! k a is a source for the electric …eld of either propagating wave.
When the waves arrive at the back of the sample their …elds add up to the polarization !e of transmitted light. This polarization deviates from !e k a at the front surface due to di¤erent loss and the phase di¤erence accumulated along the optical path of length d:
!e = exp(in1kd i!t) [!e1+ !e2exp (i )] (3)
= (n3 n1)kd = (n3 n1)
! cd
The transmitted light is linearly polarized in the ac plane and the …eld vector rotates
ac-FIG. 3: Polarization of propagating modes excited by light polarized parallel to the a-axis on the ac face of a monoclinic crystal. Di¤erent attenuation and phase rotate the polarisation of transmitted light within the shaded cone.
cording to the phase di¤erence within a cone de…ned by being an even or odd multiple of which opens up with decreasing amplitude of the strongly absorbed mode. Since the …elds of the propagating modes are orthogonal the phase has no e¤ect on the transmitted light intensity which, c and "0 denoting the speed of light and vacuum permittivity, is the
sum of the intensities of both modes.
I = c"0!e !e = c"0 n j!e1j 2 +j!e3j 2 + 2!e1 !e3cos o (4)
The phase is important if the polarization !P = "0 !e as part of a propagating wave
couples to the modulation …eld !F. The tensor of the optical susceptibility rotates the polarization with respect to the driving …elds !e1 and !e3 and the …eld-induced change !P
of the polarization, given by the coupling strength !P !F, accumulates along the optical path. The emitted …eld-modulated intensity I is described by tensor components Sj of a
non-linear susceptibility which depend on products of the polarization !e of the propagating waves and the applied …eld !F.
I = S1 !e1 !F 2
+ S2 !e3 !F 2
+ 2S3 !e1 !F !e3 !F cos (5)
Two terms in eqn.5 are proportional to the intensity of the modes but the third term depends on their phase di¤erence . The phase increases with the frequency of light and maxima appear in the modulated transmittance when the phase di¤erence is a multiple of 2 . Negligible dispersion of the refractive indices below the absorption edge of the monomer leads in samples of small polymer concentration to a periodic pattern of I with the period given by the di¤erence of the refractive indices and the crystal thickness d:
(n3 n1) !j c d = j 2 =) ~! = hc (n1 n3) d (6)
The periodicity 46.2 meV for the 190 m thick sample A and 32.6 meV in for 360 m thick sample B yields similar values jn3 n1j = 0:14 and 0:11, respectively which depend
sensitively on the sample thickness. The periodic signal thus results from the optical Kerr e¤ect, the …eld-induced change of refractive indices, and the almost constant amplitude indicates that it is mainly a response of the host crystal.
B. Samples with large polymer content
1. Survey of absorption and electroabsorption spectra
The periodic pattern due to optical birefringence vanishes if one mode is completely ab-sorbed. Consequently, better …eld-modulated spectra are expected from samples of larger polymer content and with polarization !e ? a. Fig. 4 displays absorption and electroab-sorption spectra of the 200 m thick sample C exposed for 2h to -irradiation with polymer fraction xp = 0:46%. It is emphasized that neither the concentration nor the thickness of
the sample enter into the evaluation of the …eld-response of the chain.
The absorption spectrum reproduces all features observed with polarization !e k a. It shows an absorption background which increases towards higher energy and may result from light scattering by polymer chains. The periodic pattern of has vanished as expected and the EA spectrum resolves many sharp structures and the largest signal occurs above 3.1 eV at the position of the absorption peak Xc. All features at lower energy increase
FIG. 4: Absorption and electroabsorption spectra of sample C exposed for 2h to -radiation. Part of the EA spectrum is enlarged by the factor 5 to resolve the vibronic replicas of the strong features. Polymer concentration ' 0:5%.
TABLE II: Transition energies of the exciton X and some vibronic satellites and of the peak Xc in sample C with 0.5% polymer concentration.
Transition X 1 2 3 D T Xc
Energy (eV) 2.4025 2.4956 2.5070 2.5293 2.5846 2.6595 3.120 di¤erence to X (meV) - 93.1 104.5 126.8 182.1 257.0 718
quadratically with the …eld strength and without change of their lineshape in agreement with the quadratic Stark e¤ect. The strong signal above 3.1 eV has weaker dependence on the …eld and shows …eld-broadening as expected for the Franz-Keldysh e¤ect in the high …eld regime.
Table 2 presents the transition energies of the exciton X, with some of its weak satellites j
and strong satellites D and T and of the absorption peak Xc. The exciton splits into several narrow lines separated by a few meV and the vibronic energies are taken from the distance of the respective peaks to the main exciton line. With the high energy signal attributed to the free electron gap the exciton binding energy exceeds 700 meV and the absorption peak Xc could arise from the singularity of the density of states at the gap of a one-dimensional band.
Absorption spectra of this sample with polarization !e k a are shown in …g. 5. The ‡at absorption above 2.4 eV corresponds to the total loss of the strongly absorbed mode. The residual transmittance, 0.045 %, is due to the simultaneously excited weakly absorbed mode which by its absorption generates the small features on top of the saturation level. Addi-tional states are observed below 2.4 eV and the derivative lineshape of their EA spectrum is attributed to the Stark shift of excitons with transition energies of 2.2475, 2.2815 and 2.3798 eV. Similar …eld-sensitive excitons of unknown origin have been observed in 3BCMU and 4BCMU.10 The spectrum at room temperature shows again the thermal broadening and
blue shift of the absorption edge.
2. Temperature and …eld-strength dependence
The thermal broadening of the exciton and blue shift is shown elsewhere21 and appears also in the electroabsorption spectrum. Fig. 6 presents spectra above 3.1 eV for several temperatures. They shift with increasing temperature to higher energy at a rate which
FIG. 5: Absorption and electroabsorption spectra for polarization parallel to the chain in sample C with 0.5 % polymer content.
agrees with the shift of the exciton and thermal broadening decreases the signal until at 297 K only the most prominent peaks survive. It is mentioned that thermal broadening of this spectrum obtained with a large …eld increases much less than the width of the excitonic features in absorption and electroabsorption spectra.
FIG. 7: Variation with …eld strength of the EA spectrum near 3.12 eV. Spectra at high temperature on top are enlarged as indicated.
Field-broadening of the EA spectrum above 3.1 eV is demonstrated in …g. 7. Although expected for the Franz-Keldysh e¤ect24 it has been observed at similar …elds only in semi-conductors with small reduced mass like Ge,25 GaAs26 and InGaAs27 but also in fully
poly-merized DCH9and on blue chains in 3BCMU and 4BCMU monomer single crystals.10
Field-broadening leads to a redshift of the …rst peak at 3.10 eV and a blueshift of all peaks above 3.15 eV. The very small shift of the dominant negative peak at 3.12 eV is consistent with the Franz-Keldysh e¤ect. However, the distorted lineshape at very small …elds and the fairly stable position of the strong positive peak near 3.145 eV suggests that additional e¤ects contribute to the EA spectrum.
The series of additional peaks of the EA spectrum at higher energy is shown in …g. 8 which by their distance from the negative peak at 3.12 eV are attributed to vibronic replicas of the Franz-Keldysh e¤ect of the fundamental gap. The strongest satellites near 3.30 and 3.37 eV show also some …eld-broadening. The peak at 3.20 eV which shifts with the …eld belongs to the Franz-Keldysh e¤ect of the gap but not the negative peaks at 3.215 eV and 3.265 eV which keep their position.
FIG. 8: Field strength dependence of the EA spectrum in the range of vibronic bandgaps.
IV. EVALUATION OF THE ELECTROABSORPTION SPECTRA
A. Stark e¤ect of the exciton
Inversion symmetry of 3NPh2 leads to dipole selection rules of the electrons based on the parity of states. The …eld F couples the dipole allowed exciton X to states of even parity and energy Ej which by second order perturbation theory leads to the quadratic Stark shift.
EX =P j
!j !F 2 EX Ej
(7)
The energy denominators determine the sign of the contributions and reduce coupling to distant states jji. One dipole moment j often dominates and for Wannier-type excitons
which couple primarily to the free electron gap at EC the corresponding transition dipole is
given by the exciton radius, e!r, which simpli…es its Stark shift.
EX =
e !r !F 2 EX EC
(8)
By coupling to states of even parity the exciton loses oscillator strength f and this loss involves the same transition dipoles as the Stark shift but depends quadratically on the
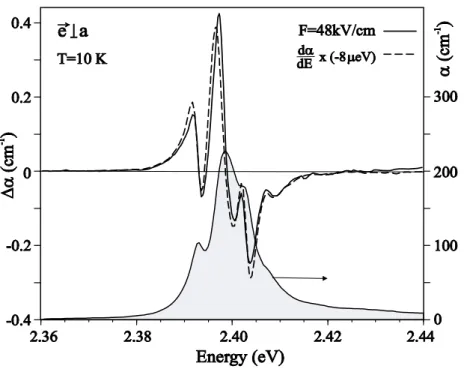
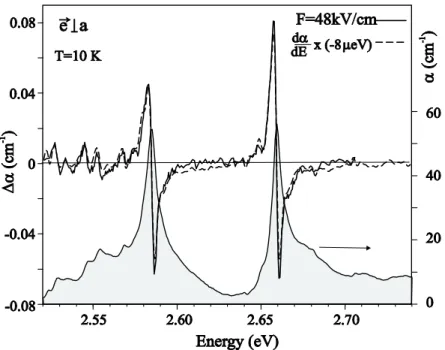
FIG. 9: Comparison of the EA spectrum and the derivative of the exciton absorption (shaded area) scaled to a redshift by 8 eV.
energy denominators. f f = P j !j !F 2 (EX Ej) 2 (9)
In case of large binding energy, (EX EC) EX, the redshift dominates and the excitonic
electroabsorption spectrum is proportional to the derivative of the absorption.
Fig. 9 presents the exciton absorption peak with its …ne structure that can be …tted to four narrow Lorentzians at 2.3926, 2.3985, 2.4024 and 2.4075 eV. The EA spectrum at 48 kV/cm on top is reproduced by the derivative of the absorption band with a redshift by 8 eV. Similar agreement is found with the sum of derivatives of the Lorentzians. The common shift of all transitions proves that the four states are not mixed by the electric …eld but belong to di¤erent chains or chain segments.
The same Stark shift is observed for the vibronic satellites D and T at 2.5885 eV and at 2.6591 eV and even for the weaker satellites as shown in …g. 10. Consequently, all these features result from coupling the same exciton to forbidden states at higher energy or to the continuum of ionized electron-hole pairs. The …rst EA signal which is not part of the exciton occurs at 3.12 eV. Lineshape and …eld strength dependence exclude the quadratic
FIG. 10: Comparison of the EA spectrum and the derivative of the absorption of the strong vibronic excitons D and T.
Stark e¤ect as origin but agree with the signal of a free electron bandgap. With the energy separation by 0.72 eV and …eld of 48 kV/cm inserted into eqn.8 the redshift by 8 eV yields an exciton radius of 5.0 Å. Scaling to the derivative of a narrow absorption spectrum depends on the spectral resolution and the shift is likely to be larger since the absorption has been measured with narrower bandpass. The Stark shift by 6 eV and 8 eV in a …eld of 36 kV/cm derived from the broadened spectra at 100 K and at room temperature yield an exciton radius of 5.8 Å and 6.7 Å, respectively. The EA spectrum in …g. 1 taken with 50 kV/cm and polarization !e k a matches a redshift by 14 eV which corresponds to an exciton radius of 6.4 Å. We conjecture that the exciton radius in poly-3NPh2 is (6 1) Å which is about 40 % smaller than the average value of 10 Å found in other PDAs.8,10 This
signi…cant change of the exciton radius is supported by a similar increase of the exciton binding energy from about 0.5 eV to 0.72 eV.
B. Franz-Keldysh e¤ect of the bandgap
1. Franz-Keldysh e¤ ect a one-dimensional band gap
The Franz-Keldysh e¤ect describes the optical interband polarization in presence of an electric …eld. The plane wave envelope of Bloch states in a periodic potential is replaced by the Airy function Ai(z) as eigenstate of a free electron in a constant electric …eld.24 The
energy W = eF r which electrons gain by moving in the …eld is eliminated by rescaling the kinetic energy E Eg of an electron-hole pair to an energy ~ which depends on the reduced
mass and on the …eld.
~ = e 2 ~2F2 2 1=3 (10)
Scaling to a …eld-dependent energy leads to …eld-broadening of the modulated spectra with the peculiar dependence on F2=3. Lifetime broadening by which limits the range of coherent
motion enters as imaginary part of the renormalized energy z28
z = + i = Eg E
~ + i~ (11)
and results in the …eld-induced absorption of a one-dimensional continuum that can by:29,30 (E) = B 2n!p~ 2 exp i 3Ai(z)Ai(w) H( z) p z (12) w = z exp 2 i 3 , B = p 2 e2 "0m2!2~jP j 2
The …eld-independent part B of the amplitude accounts for the interband momentum matrix element P and the refractive index n enters when the imaginary part of the dielectric response function is replaced by the absorption constant . The unity step function H represents the …eld-free case with the 1=pE Eg singularity of the density of states. The
…eld generates an exponential absorption tail below the gap and oscillations at higher energy extend over the range of energy gained by coherent acceleration. A corresponding expression for isotropic matter describes the electroabsorption spectrum of a cubic semiconductors over more than 0.4 eV.31
Fig. 11 compares calculated absorption spectra with and without …eld of one-dimensional bands with small reduced mass and a gap at 3.12 eV. Field and mass correspond to ~ = 21:2meV and de…ne the argument of the Airy functions which were taken from the Handbook
FIG. 11: Absorption spectra of a one-dimensional band with and without an electric …eld.
of Mathematical Functions.32 The broadening parameter = 10meV softens the singularity at the gap and the …eld-free absorption resembles an asymmetric absorption peak. The …eld shifts the absorption peak to higher energy and the subsequent oscillations re‡ect the redistribution of the interband polarization. The di¤erence to the …eld-free absorption predicts an electroabsorption spectrum with a large negative peak at Egwhich is followed
by a strong positive peak and weaker oscillations. These oscillations vanish rapidly as ~ gets smaller than the broadening parameter . Changes below the gap are small and generate a broad and rather weak positive peak of . EA spectra with the peculiar dependence on F2=3were observed for blue chains of polydiacetylene and yield the reduced mass t 0:05mo.
However, all these spectra show a strong positive peak below the gap of similar size as the negative peak at Eg which does not comply with the predicted lineshape of the
Franz-Keldysh e¤ect at a one-dimensional bandgap.9,10
2. Spectra at large electric …elds
The one-dimensional Franz-Keldysh e¤ect reproduces the EA spectrum of poly-3NPh2 almost perfectly for large …elds as shown in …g. 12. The broadening parameter = 10meV was chosen to match the width of the leading peaks and mass, amplitude and energy gap are listed in tab. 3. The gap occurs at 3.12 eV at the energy of the weak absorption peak Xc which supports its assignment to the density of states of one-dimensional bandgap. The
FIG. 12: EA spectra (full lines) for large …elds compared with spectra of a one-dimensional Franz-Keldysh e¤ect (dashed lines): = 10meV , = 0:08m0. Weak signals at higher energy are enlarged
by a factor of 5. The shaded area shows the absorption peak Xc with the background subtracted.
Franz-Keldysh e¤ect reproduces also the small positive peak of below the gap and the position of all oscillations up to 3.22 eV. Peaks above 3.16 eV are smaller than predicted but faster damping with increasing carrier velocity has been observed in semiconductors31 and is anticipated if the energy of an electron-hole pair gets resonant to vibrational modes. Vibrational excitons appear in absorption spectra 100 meV above the exciton. They limit unperturbed Franz-Keldysh oscillations to a range of 100 meV which in a …eld of 30 kV/cm corresponds to coherent motion over more than 300 Å.
The calculated spectra use scaling energies ~ of 22.93, 19.68 and 16.24 meV, respectively which correspond to a reduced mass = 0:08m0. A mass of 0:09m0 reproduces the peak
positions at 50 kV/cm too while a smaller mass of 0:07m0improves the …t to the spectrum at
30 kV/cm. Such small reduced mass is consistent with …eld-broadening of the EA spectrum which requires …elds that exceed the perturbation regime, ~ > . It is emphasized that the mass of 0:05m0 derived from …eld-broadening of the EA spectra of DCH and 3BCMU is far
FIG. 13: Electroabsorption spectra at moderate …elds compared to spectra of the one-dimensional Franz-Keldysh e¤ect (dashed lines).
3. Spectra at small electric …elds
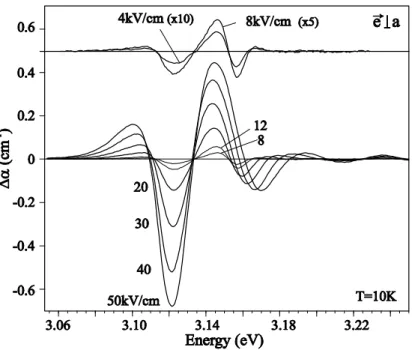
Since the Franz-Keldysh e¤ect neglects all correlation e¤ects its excellent agreement with the data indicates that …elds exceeding 30 kV/cm diminish other perturbations of free elec-tron states. Coulomb coupling of elecelec-tron and hole should show up in spectra at smaller …elds as deviation from the spectral lineshape of the Franz-Keldysh e¤ect. Such deviations appear at moderate …elds as presented in …g. 13. The leading positive and negative peaks are still reproduced with a slight increase of the gap to 3.122 eV but not the peaks at higher energy. The calculations predict narrower spectra and above 3.14 eV smaller peaks than actually observed. Spectra at 12 kV/cm show these distortion quite clearly by an experi-mental spectrum that extends beyond the Franz-Keldysh oscillations of a gap at 3.122 eV. It should be mentioned that by shifting the second positive peak of the Franz-Keldysh e¤ect to the experimental peak at 3.146 eV the position of the subsequent peaks is reproduced again which points to a larger gap at smaller …eld.
Spectra at very small …elds, 8 kV/cm and 4 kV/cm are displayed in …g. 14. Franz-Keldysh oscillations of a gap at 3.122 eV vanish 30 meV above the gap where the data still show a strong positive peak at 3.146 eV. Subsequent peaks shift with the …eld strength and, as
FIG. 14: EA spectra at small …elds compared with the Franz-Keldysh e¤ect of gaps at 3.122 eV (dashed-dotted) and 3.158 eV (dashed). =10meV. The shaded area shows the weak absorption peak at 3.12 eV reduced by a factor 500 to …t into the scale of the ordinate.
shown by the dashed lines, their position is reproduced by the Franz-Keldysh e¤ect if the gap is increased to 3.158 eV. The resulting lineshape, a leading strong positive peak followed by a negative peak of similar size and weaker oscillations at higher energy is that observed for blue chains of 3BCMU and DCH. The most likely explanation for the large positive peak below the gap is a dipole-forbidden exciton which gains oscillator strength by mixing with the free electron continuum33 and such shallow dipole forbidden state has been predicted by theory.34,35 We conjecture that the bandgap of poly-3NPh2 lies at 3.158 eV and is de…ned
by the Franz-Keldysh e¤ect at small …elds. This assignment yields a satisfactory description of the spectrum above 3.15 eV.
This assignment requires another interpretation of the high …eld spectra with the gap at 3.120 eV and of the absorption peak Xc. Coulomb interaction of electron and hole generates not only bound states but transfers oscillator strength of electron-hole pairs from the continuum to bound states.36 It is likely that the strong coupling of electron and hole
gap which explains the absence of a corresponding absorption peak in conjugated polymers. We therefore attribute the absorption peak Xc to a dipole-allowed exciton at 3.120 eV which has about 5 % of the strength of the fundamental exciton. Field-induced coupling of this exciton to a forbidden state near 3.146 eV and to the free carrier continuum passes from the low …eld regime of the quadratic Stark e¤ect to a high-…eld regime where bound excitons are ionized and become part of the continuum.37–40 The gradual transition from the Stark
e¤ect of a bound exciton to …eld ionization has been observed in cubic semiconductors.27 The excitonic signal changes its lineshape to that of a …eld-broadened state which joins the continuum when the …eld-induced potential across the exciton radius is about half the binding energy. With further increasing …elds the exciton state is no longer resolved but marks the …rst negative peak of Franz-Keldysh oscillations. Distortion of the Franz-Keldysh e¤ect is evident in the spectra at 20 kV/cm and attributed to decoupling the exciton at 3.120 eV from that at 3.146 eV which is still part of the continuum. Taking 20 kV/cm as critical …eld for strong mixing estimates the exciton radius to 60 Å.
The exciton Xc at 3.120 eV responds to very small …eld by the quadratic Stark e¤ect. A …eld of 4 kV/cm shifts an exciton of 60 Å radius and 38 meV binding energy by 0.15 meV and transfers almost 1 % of its oscillator strength. Corresponding shift and decreasing size of the absorption peak predict an EA spectrum with an asymmetric negative peak of 0.15 cm-1 amplitude. The negative EA peak at 3.122 eV is smaller by a factor 3 which points to a smaller radius of about 40 Å. The spectrum is also narrower and weak …ne structure around 3.13 eV suggests some splitting of exciton Xc, similar as the fundamental exciton at 2.4 eV. We conjecture that the EA spectrum at small …eld resolves a weak dipole allowed exciton at 3.120 eV of large radius, 40 - 60 Å, and a forbidden exciton at 3.146 eV which distorts the lineshape of the Franz-Keldysh e¤ect of the gap at 3.158 eV.
4. Vibronic replica of the Franz-Keldysh e¤ ect
EA spectra above the gap are described by the superposition of the Franz-Keldysh e¤ect of four vibronic gaps with the same mass and broadening as for the gap itself (…g. 15). The strongest replica D and T generate their own Franz-Keldysh oscillations with gaps at 3.301 eV and 3.374 eV, respectively and the vibronic energies of 181 meV and 254 meV, counted from the high-…eld gap of 3.120 eV, are in accordance with the energies derived
FIG. 15: EA spectrum at vibronic gaps (full curve) compared with the sum of four vibronic replica of the Franz-Keldysh e¤ect (dashed curve). Their individual contribution is shown below with the corresponding energy gaps marked by arrows.
from the exciton spectra. The negative peaks at 3.264 eV and 3.215 eV correspond to vibrational energies of 144 meV and 95 meV and represent the joint response of two groups of modes which are better resolved in the exciton spectra. The vibronic spectra overlap with the last member of Franz-Keldysh oscillation from the gap at 3.20 eV. Additional os-cillations at higher energy are suppressed by resonant scattering of an electron-hole pair by vibrational modes and are substituted by oscillations of a correspondingly shifted gap. Sim-ilar to vibronic excitons coupling of free electron-hole pairs and vibrational modes provides resonances for the interband polarization which generates vibronic replicas of the energy gap. Field-broadening of these replicas is observed only if they are su¢ ciently separated as in case of double and triple bonds. It is pointed out that the EA spectrum presented in …g. 4 resolves replica at 3.559 eV and 3.641 eV which are attributed to combination modes D+T and 2T, respectively and appear also in the excitonic spectrum.
The vibrational replicas D and T at 12 kV/cm have the lineshape of the Franz-Keldysh e¤ect in the low …eld regime (…g. 8 ), two positive peaks framing a strong negative peak at the gap. The reference energy for the vibronic energies is the still the high-…eld gap at
3.12 eV, the energy of an ionized exciton state as part of the free electron continuum. Since the signal decreases rapidly at smaller …elds it was not possible to observe the separation of weakly bound excitons from the gap in the vibronic spectra.
V. SUMMARY AND CONCLUSIONS
Electroabsorption spectra of -conjugated chains of 3NPh2 reveal signi…cant changes of the electronic structure if the polymer repeat unit consists of two non equivalent C4 units.
The optical gap, de…ned by a strong exciton has increased to 2.399 eV, larger than in any other polydiacetylene. Even larger is the increase of the band gap to 3.158 eV and of the exciton binding energy to 759 meV, compared to 485 meV in DCH9 and 560 meV in blue chains of 3BCMU10 and of THD19 Consistent with the increased binding energy is the
decrease of the exciton radius to 6 Å. The exciton is still of the Wannier type since it extends over 5 conjugated bonds. These changes are attributed to reduced coupling of the C4 units
due to their twisted molecular planes. The twisting angle should be larger than the value of 7:5o reported for THD18 since in that material the exciton shows only a moderate increase of the transition energy to 2.171 eV and no signi…cant change of the binding energy.
Poorer overlap of the neighboring C4 units reduces the corresponding charge transfer
integral and the width of the free carrier bands. Since the bonds have not changed, the splitting of and states which broaden to the valence and conduction bands is the same but a reduction of the band width increases the fundamental gap at the centre of the Brillouin zone. Doubling the polymer repeat unit reduces the size of the Brillouin zone while the number of subbands increases as band states are folded back into the reduced Brillouin zone. New gaps appear on the edge of this Brillouin zone which decrease the curvature of conduction and valence band at the centre of the Brillouin zone. We propose that this e¤ect and the smaller band width due to a reduced transfer integral between rotated C4 units increases the reduced e¤ective mass at the gap of poly-3NPh2 compared to the mass in blue chains.
The large exciton binding energy is consistent with its increased reduced mass and moves the bandgap well beyond the range of vibrational excitons which enabled a detailed study of free electron states in a one-dimensional system. The excellent agreement of the EA spectra at …elds exceeding 30 kV/cm with the lineshape of the Franz-Keldysh e¤ect points
TABLE III: Parameters used to …t the one-dimensional Franz-Keldysh e¤ect to the electroabsorp-tion spectrum above 3.1 eV: the energy gap Eg, the electro-optic energy ~ with the corresponding
reduced mass . The normalized amplitude represents the …eld-independent part.
F (kV/cm) 50 40 30 20 12 8 4
Eg (eV) 3.120 3.120 3.122 3.122 3.122 3.158 3.158
~ (meV) 22.83 19.68 16.24 12.96 9.22 7.04 4.43 (m0) 0.08 0.08 0.08 0.07 0.07 0.07 0.07
amplitude 1.0 0.9 0.7 0.44 0.28 0.22 0.14
to strongly reduced electron correlation e¤ects. Resonant coupling to molecular vibrations limits the range of unperturbed Franz-Keldysh oscillations to about 100 meV which yields a coherence range of bandstates larger than 300 Å, equivalent to 120 conjugated bonds.
Matching the Franz-Keldysh e¤ect to the experimental spectra yields the parameters in tab. 3. The scaling energy ~ determines the spectral lineshape if it exceeds the broadening parameter = 10 meV and yields the reduced mass = 0:08m0. The small mass supports
wide energy bands predicted by bandstructure calculations.34,41,42 Assuming the same elec-tron and hole mass yields a free carrier mass of 0.16 m0 and an exciton mass of M = 0:32m0
for the centre of mass motion which is in accordance to the value 0:3m0 estimated from the
radiative lifetime of excitons in red chains of 3BCMU.11,12 The amplitude of the EA spectra
which is de…ned by the interband matrix elements has been …tted to the leading peaks of Franz-Keldysh oscillations and is normalized to the value at the highest …eld. The amplitude nevertheless decreases with decreasing …eld since the imaginary part = =~ of the renor-malized energy of electron-hole pairs increases. Their Coulomb coupling leads to weakly bound excitons states which are ionized in high …elds and become part of the free carrier continuum. The energy gap at high …elds which denotes the threshold to that continuum therefore occurs at 3.120 eV, the energy of an ionized exciton state with 38 meV binding energy. A small but distinct absorption peak indicates that this exciton is dipole allowed. It is emphasized that such weakly bound dipole allowed exciton has not been observed in other polydiacetylenes. The exciton decouples from bandstates in low …elds and the correspond-ing spectra yields a gap at 3.158 eV with Franz-Keldysh oscillations which match a slightly smaller mass of 0:07m0. These spectra show a strong positive peak at 3.146 eV which is
attributed to the …eld-induced gain of oscillator strength of a dipole forbidden exciton of 12 meV binding energy. This state provides a resonance in the free electron continuum which modi…es the shape of the Franz-Keldysh e¤ect. This dipole forbidden exciton seems common to polydiacetylene chains since their EA spectra at the gap have the same lineshape as observed for poly-3NPh2 at small …elds.
Acknowledgments
Partial …nancial support of this work by the Agence Nationale pour la Recherche, France is acknowledged (Grant ANR-06-NANO-013). We are indebted to Mrs Charlotte Bourgeois from INSP for performing some of the -ray irradiations.
1 G. Wegner, Z. Naturforsch. B 24, 824 (1969)
2 R.H. Baughman, J. Polym. Sci., Polym. Phys. 12, 1511 (1974) 3 G. Wegner, Pure Appl. Chem. 1977, 49, 443 (1977)
4 R.H. Baughman, K.C. Yee, J. Polym. Sci., Macromol. Rev. 13, 219 (1978)
5 D. Bloor, in Developments in Crystalline Polymers-1, ed. D.C. Bassett, Appl. Sci. Publ. London
1982, Chapter 4, pp 151
6 D. Bloor, Mol. Cryst. Liq. Cryst., 93, 183 (1983) 7 V. Enkelmann, Adv. Polym. Sci. 63, 91 (1984) 8 G. Weiser, Phys. Rev. B 45, 14 076 (1992)
9 L. Sebastian and G. Weiser, Phys. Rev. Lett. 46, 1156 (1981)
10 A. Horvath, G. Weiser, C. Lapersonne-Meyer, M. Schott, and S. Spagnoli, Phys. Rev. B 53,
13507 (1996)
11 F. Dubin, J. Berréhar, R. Grousson, T. Guillet, C. Lapersonne-Meyer, M. Schott, and V.
Voliotis, Phys. Rev. B 66, 113202 (2002)
12 R. Lécuiller, J. Berréhar, J. D. Ganière, C. Lapersonne-Meyer, P. Lavallard, and M. Schott,
Phys. Rev. B 66, 125205 (2002)
13 F. Dubin, J. Berréhar, R. Grousson, M. Schott, and V. Voliotis, Phys. Rev. B 73, 121302 R
14 F. Dubin, R. Melet, T. Barisien, R. Grousson, L. Legrand, M. Schott, and V. Voliotis, Nature
Physics 2, 35 (2006)
15 L. Legrand, A. Al Choueiry, J. Holcman, A. Enderlin, R. Melet, T. Barisien, V. Voliotis, R.
Grousson, and M. Schott, Phys. Stat. Sol. (b) 245, 2702 (2008)
16 G. Weiser and J. Berréhar, Phys. Rev. Lett. 99, 196401 (2007)
17 G. Weiser, J. Berréhar and M. Schott, Phys. Rev. B 76, 205201 (2007) 18 V. Enkelmann, G. Schleier, G. Acta Crystallogr. B 36, 1954 (1980)
19 T. Barisien, L. Legrand, G. Weiser, J. Deschamps, M. Balog, B. Boury, S.G. Dutremez, and M.
Schott, Chem. Phys. Lett. 444, 309 (2007)
20 J. Deschamps, M. Balog, B. Boury, M. Ben Yahia, J.-S. Filhol, A. van der Lee, A. Al Choueiry,
T. Barisien, L. Legrand. M. Schott, S.D. Dutremez, submited to Chemistry, European Journal of Chemistry
21 A. Al Choueiry, T. Barisien, J. Holcman, L. Legrand, M. Schott, G. Weiser, M. Balog, J.
Deschamps, S.G. Dutremez, J.-S. Filhol, submitted as accompanying paper
22 M. Born and E. Wolf, Principles of Optics, Cambridge University Press, 1997 23 M. Schott, S. Spagnoli and G. Weiser, Chem. Phys. 333, 246 (2007)
24 D.E. Aspnes, Phys. Rev. 147, 554 (1966)
25 P. Handler, S. Jasperson and S. Koeppen, Phys. Rev. Lett. 5, 1387 (1969)
26 C. Van Hoof, K. Dene¤e, J. DeBeck, D.J. Arent and G. Borgh, Appl- Phys. Lett 54, 13 (1989) 27 A. Jaeger and G. Weiser, Phys. Rev. B 58, 10 674 (1998)
28 D. E. Aspnes, Phys. Rev.153, 972 (1967)
29 D. E. Aspnes and N. Bottka, in Semiconductors and Semimetals Vol. 9: Modulation techniques,
ed. R.K. Willardson and A.C. Beer, Academic Press New York, London 1972, Chapter 6.
30 G. Weiser and A. Horvath, in Primary photoexcitations in conjugated polymers: Molecular
versus Semiconductor band model, ed. N.S. Sariciftci, World Sienti…c, Singapore 1997, Chapter 12
31 A. Jaeger, G. Weiser, P. Wiedemann, I. Gyuro and E. Zielinski, J. Physics C: Condensed Matter
8, 6779 (1996)
32 R. Abramovich and I. A. Stegun, Handbook of Mathematical Functions, Appl. Math. ser. 55, p.
446 ¤ (Nat. Bureau of Standards 1966)
34 S. Abe, J. Phys. Soc. Jpn. 58, 62 (1989)
35 D. Guo, S. Mazumdar, S.N. Dixit, F. Kajzar, F.J arka, Y. Kawabe and N. Peyghambarian,
Phys.Rev. B 48, 1433 (1993)
36 R. J. Elliott, Phys. Rev. 108, 1384 (1957) 37 H. I. Ralph, J. Phys. C 2, 378 (1968)
38 J. D. Dow and D. Red…eld, Phys. Rev. B 1, 3358 (1970) 39 D. F. Blossey, Phys. Rev. B 2, 3976 (1970)
40 D. F. Blossey, Phys. Rev. B 3, 1382 (1971) 41 S. Suhai, Phys. Rev. B 29, 4570 (1984)