Received: 30 October 2002 Accepted: 13 March 2003 Published online: 7 May 2003 © Springer-Verlag 2003
Abstract Background: One of the
most challenging practical and daily problems in intensive care medicine is the interpretation of the results from diagnostic tests. In neonatology and pediatric intensive care the early diagnosis of potentially life-threaten-ing infections is a particularly impor-tant issue. Focus: A plethora of tests have been suggested to improve di-agnostic decision making in the clin-ical setting of infection which is a clinical example used in this article. Several criteria that are critical to ev-idence-based appraisal of published data are often not adhered to during the study or in reporting. To enhance the critical appraisal on articles on diagnostic tests we discuss various measures of test accuracy: sensitivi-ty, specificisensitivi-ty, receiver operating characteristic curves, positive and negative predictive values,
likeli-hood ratios, pretest probability, post-test probability, and diagnostic odds ratio. Conclusions: We suggest the following minimal requirements for reporting on the diagnostic accuracy of tests: a plot of the raw data, multi-level likelihood ratios, the area under the receiver operating characteristic curve, and the cutoff yielding the highest discriminative ability. For critical appraisal it is mandatory to report confidence intervals for each of these measures. Moreover, to al-low comparison to the readers’ pa-tient population authors should pro-vide data on study population char-acteristics, in particular on the spec-trum of diseases and illness severity.
Keywords Diagnostic tests ·
Sensitivity · Specificity · Receiver operating characteristic curve · Likelihood ratio · Infection
Joachim E. Fischer Lucas M. Bachmann Roman Jaeschke
A readers’ guide to the interpretation
of diagnostic test properties: clinical example
of sepsis
Introduction
Intensivists must rely on the correct interpretation of di-agnostic data in a variety of clinical settings. One of the most challenging practical and daily problems in neona-tology and pediatric intensive care is the diagnosis of infection [1]. Because of the consequences of delayed di-agnosis [2, 3], physicians have low thresholds to initiate antibiotic therapy [4]. A plethora of tests has been sug-gested to improve diagnostic decision making in differ-ent clinical situations including sepsis, which is the ex-ample in this contribution [5, 6, 7].
To enhance the critical appraisal on articles of new di-agnostic tests we discuss various concepts to measure
test accuracy. A section is devoted to the importance of reporting on confidence intervals. Further problems in conducting and reporting of studies result from various sources of bias. Since these problems have been ad-dressed in detail elsewhere, we limit the discussion to two particular issues threatening the validity of the con-clusions in studies on markers of infection in neonatolo-gy and pediatric intensive care: the problem of the case-control design and the spectrum bias.
J. E. Fischer (
✉
) Department of Pediatrics, University Children’s Hospital, Steinweisstrasse 75, 8032 Zurich, Switzerland e-mail: [email protected] Tel.: +41-1-2667751 Fax: +41-1-2667164 L. M. Bachmann Horten Centre,Bolleystrasse 40 Postfach Nord, 8091 Zurich, Switzerland R. Jaeschke
Department of Medicine, McMaster University, Hamilton, Ontario, Canada
Prerequisites for reporting on test accuracy
To allow determination of test accuracy a gold standard criterion must be present which allows discrimination of patients into two groups: one with infection and one without infection [8]. Ideally there should be no other difference between patients with infection and those without infection that may influence the tests results [9, 10]. The study should include all potential patients and be carried out as a cohort study [11]. Unfortunately, the reality of neonatal and pediatric intensive care enforces relevant deviations from these prerequisites. The positive blood culture does not satisfy the criterion of a gold stan-dard since blood cultures yield positive and false-negative results. Despite this fact many researchers use the positive blood culture plus clinical signs of infection as a positive gold standard, and patients without any clinical evidence plus a negative blood culture as the negative gold standard. This forces all patients to be omitted who cannot be classified unambiguously from the analysis [6]. Such analysis probably circumvents the problem of misclassification bias, at the price of intro-ducing a new bias. Most clinicians are able to distinguish between a severely ill patient with suspected sepsis and a healthy control hospitalized in the same unit without any additional testing. Clinicians seek help from testing ex-actly for the ambiguous cases, which are omitted in the analysis as described above. Despite decades of research no one has as yet offered a suitable solution to this prob-lem. The situation is much easier if an established meth-od (e.g., blometh-od glucose determined by the laboratory) is compared to a new method measuring the same variable (e.g., blood glucose determined by bedside tests).
Measures of test accuracy
Sensitivity and specificity
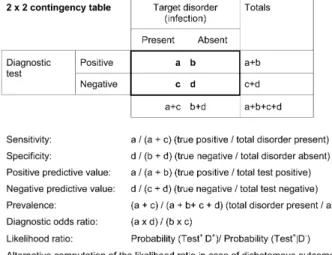
Originally 2¥2 tables were defined to analyze dichoto-mous outcomes (e.g., death vs. survival, infected vs. noninfected) and their association with an equally di-chotomous predictor variable (e.g., surfactant given vs. no surfactant, or a positive vs. a negative blood culture). Most authors still summarize test results into a 2¥2 table (Fig. 1). In the situation of dichotomizing outcomes, when the test provides quantitative results, a cutoff must be chosen that distinguishes negative from positive test results. The choice of the cut-off has an important bear-ing on the calculated measures of test accuracy, an issue discussed below. For the moment it is assumed that an appropriate cutoff has been chosen. Once the data are tabulated, the sensitivity describes the proportion of pa-tients with positive test results among those who are in-fected. The specificity denotes the proportion of patients with negative test results among those who are not
in-fected. Calculation of sensitivity and specificity requires knowledge about the presence or absence of infection, determined by an independent gold standard (columns in the 2¥2 table). However, in the clinical setting physi-cians do not know whether infection is present or absent when tests are ordered. Physicians need to make infer-ences about the presence or absence of infection from an obtained test result (rows in the 2¥2 table). There are two ways to quantify this inference: predictive values and likelihood ratios.
Fig. 1 A 2¥2 contingency table for diagnostic tests. Above The
calculation matrix, below a hypothetical example for plasma levels of C-reactive protein for the diagnosis of sepsis choosing a cutoff at 20 mg/l as the discrimination criterion. The prevalence was set at 15%
Predictive values and likelihood ratios
Likelihood ratios and predictive values provide informa-tion about the probability that a patient with a given test result is actually infected [9, 10]. The traditional concept of predictive values (Fig. 1) presents the absolute proba-bility that infection is present (positive predictive value) or absent (negative predictive value). Figure 2 illustrates that a major determinant of the predictive values is the prevalence of infection [12]. The same hypothetical test yields a predictive value of 85% when the prevalence is 47% but a predictive value of only 13% when the preva-lence is 2.2%. Thus the predictive values depend not on-ly on the test’s properties but also on the prevalence of disease in the population. Therefore they do not offer a single measure to describe the test’s inherent accuracy.
To remove the difficulty arising from interpretation of predictive values decision analysts have suggested an al-ternative method to assess the predictive properties of a test: the likelihood ratio [10, 13, 14, 15]. Conceptually the likelihood ratio is the ratio of two probabilities, namely the probability that a specific test result is ob-tained in patients with the disease divided by the proba-bility of obtaining the same test result in patients without the disease. Returning to the example provided in Fig. 1, the probability of obtaining a C-reactive protein (CRP) value exceeding 20 mg/l in patients with infection is 23/26, or 0.88. The probability of obtaining a CRP value exceeding 20 mg/l in patients without sepsis is 20/145, or 0.17. The likelihood ratio of 6.41 is obtained by divid-ing the two numbers. As Fig. 2 illustrates, increasdivid-ing the number of controls and thereby decreasing the preva-lence does not alter the likelihood ratio. This theoretical independence from prevalence (unlike predictive values) is the first advantages of likelihood ratios. A common-sense translation of a likelihood ratio of 6.41 would be: a CRP value exceeding 20 mg/l is obtained approximately six times more often from a patient with sepsis than from a patient without sepsis. A likelihood ratio of 1 implies that the test result is equally likely to occur among pa-tients with the disease as in papa-tients without the disease.
In the case of dichotomous test measures, the likelihood ratios have a direct relationship to sensitivity and specifici-ty: the likelihood ratio for a positive test result (LHR+)
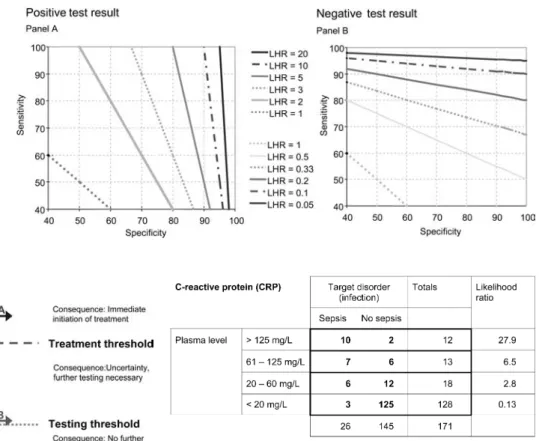
could be calculated as sensitivity divided by 1 minus the specificity value. The likelihood for a negative test result (LHR-) is obtained as (1-sensitivity) divided by specifici-ty. Figure 1 provides the mathematical equations; Fig. 3 shows a simple conversion graph for readers wanting to convert sensitivity and specificity data to likelihood ratios.
Multilevel likelihood ratios
So far we have assumed that test results are dichotomi-zed. The disadvantage of dichotomizing is the loss of
useful information. A test result may be returned from the laboratory as negative, indeterminate, or positive. Most new parameters for the diagnosis of sepsis quanti-tatively determine plasma compounds, with a wide range of possible results. Given the same clinical presentation, most neonatologists would consider sepsis more likely if the CRP is 130 mg/l than if it is 25 mg/l. The additional information value is discarded if deliberations stop at a “positive result” (defined as plasma levels above 20 mg/l). Figure 4 shows the example from Fig. 1 spread to a 4¥2 table. The table shows that a result above 125 mg/l yields a likelihood ratio of 27.9 compared to a result between 20 and 60, which has a likelihood ratio of 2.8. The example illustrates that reporting of multilevel likelihood ratios adds important information: it allows which levels of test results to be discerned that yield clinically important information, and which levels of test
Fig. 2 Dependence of the predictive values on the prevalence of
infection. The example of Fig. 1 (middle) is varied to increase prevalence by reducing the number of controls in the study (above) or by increasing the numbers of controls (below). Sensi-tivity and specificity are held constant. As the prevalence decreas-es (lower two tabldecreas-es) the positive predictive value drops. A clini-cal equivalent to the lower panel would be work-up or tachypneic newborns for ruling out infection. In the lower table, a positive test result raises the probability of infection (the positive predic-tive value) only to 13%. Unlike the predicpredic-tive values, the likeli-hood ratio as a measure of test accuracy theoretically remains in-dependent of prevalence. In the real world, however, the likeli-hood ratio may differ accross various clinical settings (e.g. due to spectrum bias, Fig. 7)
results do not [9]. Unfortunately, there are no strict rules at which likelihood ratio a test result becomes clinically useful. In the present example of newborn sepsis much depends on the clinicians’ prior assessment of the pa-tient: if the level of suspicion for sepsis is already high, little additional confirmation is needed to warrant pre-scription of antibiotics. If the infant is deemed healthy, clinicians require much stronger evidence to alter the course of treatment. In terms of test theory, this prior judgment about the possibility that the patient has the disease is referred to as the pretest probability.
Bayes’ theorem
For combining clinical judgment (the pretest probability) with a test result, likelihood ratios have an advantage over predictive values. In contrast to predictive values, likelihood ratios allow individual test results to be inte-grated with the physicians’ judgment about the probabil-ity of infection in the patient under consideration (judg-ment prior to obtaining the test result). This integration is achieved by Bayesian calculations [16]. Published
nomograms or algorithms facilitate these computations [14, 17]. Numerically the pretest odds are multiplied by the likelihood ratio to obtain the posttest odds. Disease odds and disease probability are related as follows: odds=probability/(1-probability). The posttest probabili-ty resulting from Bayesian computations is an individu-alized positive or negative predictive value. Instead of being based solely on the study prevalence, as are the predictive values, the posttest probability resulting from Bayesian calculations allows all pieces of information to be considered that are available from the individual pa-tient and clinical situation toward determining the pretest odds or pretest probability. Useful tests generate changes from prior probability estimates to the posttest probabili-ty that alter treatment decisions [10, 14]. Figure 5 illus-trates these calculations for a clinical example. However, Bayesian calculations should be used to derive the
post-Fig. 3 Conversion graph for
determination of likelihood ratios from sensitivity and specificity
Fig. 5 Probabilistic reasoning in the context of suspected
infec-tion. If infection is more likely than the probability denoted by the testing threshold, immediate initiation of antibiotics without fur-ther waiting optimizes outcomes. If the absence of infection is pre-sumed with a certainty below the testing threshold, the risks of blood withdrawal (e.g., iatrogenic blood loss in extremely prema-ture infants) outweighs the small risk that infection is present. Test A provides useful information by removing uncertainty (change from the pretest probability to above the treatment threshold). Test result B was clinically useless, because it did not sufficiently re-move uncertainty. The steepness of the slopes a and b corresponds to the likelihood ratio. A likelihood ratio of 1 would result in a straight horizontal line
Fig. 4 Multilevel likelihood ratios. The example from Fig. 1 is
ex-panded to a 4¥2 table. The likelihood ratio differs according to the stratum of test results
test probability only when applying a single test. Bayes-ian chain calculations to combine multiple tests are war-ranted only if the tests are conditionally independent. In clinical reality test results are often correlated. A new-born found to have elevated plasma levels of interleukin-8 is very likely also to show elevated levels of interleu-kin-6. Hence the information gain from additional mea-suring interleukin-6 when the interleukin-8 result is already known is certainly less than if the interleukin-6 level were determined alone. This phenomenon is known as the conditional likelihood ratio. In practice computa-tions become awkward, and clinicians seeking to use multiple tests to establish a diagnosis should look out for studies employing logistic regression analysis. As ex-plained below, this type of analysis is able to consider the additional diagnostic gain of each test while consid-ering the others simultaneously.
The receiver operating characteristic curve and the diagnostic odds ratio
A single measure that summarizes the discriminative ability of a test across the full range of cutoffs, and which is independent of prevalence is the area under the
receiver operating characteristic curve (ROC). Conceptu-ally the ROC is a plot of sensitivity against specificity for all possible cutoff values (Fig. 6). The cutoff point with the best discrimination is the point on the curve closest to the upper left corner of the graph. Areas under the curve may also be calculated for dichotomous tests, for example, the result from blood cultures. When areas under the curve are reported with standard errors or con-fidence intervals, they allow valuable statistical compari-son of diagnostic tests [18, 19], particularly if applied to the same patient population as to the same diagnostic question. However, again some limitations to area com-parisons require mention. Particularly for tests with intermediate to good discriminative properties (e.g., ar-eas of 0.75–0.85) the shape of the curve requires consid-eration. An example from newborn sepsis is the result of blood cultures. Cultures remain negative in a consider-able proportion of patients in whom Gram-negative sep-sis can be confirmed by histology. Thus the sensitivity is far from perfect. On the other hand, blood cultures rarely report false positive Gram-negative growth. Therefore most clinicians take a positive report of Gram-negative growth as proof. However, the area under the curve may only be around 0.7. When interpreting curves of imper-fect tests, clinicians may therefore focus on the part of interest of the curve, as marked by boxes in Fig. 6.
An alternative way to compare tests is by means of the diagnostic odds ratio. The diagnostic odds ratio is calculated as (sensitivity ¥ specificity)/[(1-sensitivi-ty)¥(1-specificity)] or as LHR+ divided by LHR- [11].
Researchers can employ multivariate techniques to iden-tify the cutoff with the best diagnostic odds ratio. Poten-tially useful tests tend to have diagnostic odds ratios well above 20 (e.g., a LHR+ of 7 and a LHR- of less than
0.3). It can be shown mathematically that the diagnostic odds ratio is relatively independent of changes in both spectrum and prevalence. Therefore the diagnostic odds ratio provides a robust measure for dichotomous out-comes and test results. However, in the case of a test re-turning continuous data, the diagnostic odds ratio hinges on the chosen cutoff value.
Characteristics of useful tests
Perfect tests yield an area under the curve of 1.0. As a rule of thumb a test with an area under the curve greater than 0.9 has high accuracy, while 0.7 – 0.9 indicates moderate accuracy, 0.5–0.7 low accuracy, and 0.5 a toss-up (chance result) [20]. If likelihood ratios are reported, tests with a LHR+ greater than 10 or a LHR- less than
0.1 have the potential to alter clinical decisions. Tests with likelihood ratios between 5 and 10 or 0.1 and 0.2 often provide useful additional information. Tests with likelihood ratios ranging from 0.33 to 3 rarely alter clini-cal decisions [9]. Tests usually provide the largest gain in
Fig. 6 Receiver operating characteristic curve. For each possible
cutoff the sensitivity and specificity is determined, starting with very high values in the lower left corner down to very low cutoff values in the upper right corner (numbers in the example corre-spond to interleukin 6 plasma concentrations, unpublished data). The closer the curve approximates the left upper corner, the better the test. Straight dotted line Curve of a chance results (area=0.5). Accepting a margin of error of 5% (sensitivity or specificity >95%), cutoff values of the curve falling into rectangle A are use-ful to rule-in infection. Values corresponding to points on the curve falling into rectangle B assist in ruling-out infection
information, if the probability of disease prior to apply-ing the test is intermediate (>10%). In the screenapply-ing mode for rare diseases, extremely good test characteris-tics are required to avoid large numbers of false positive results (a very high specificity).
Occasionally clinicians wish to confirm the presence or absence of infection. Positive blood cultures growing Gram-negative pathogens obtained from symptomatic pa-tients are regarded as such proof. Because it is extremely rare to obtain positive cultures growing Gram-negative bacteria from two independent sites in patients who are not infected, a positive culture for Gram-negative patho-gens has a very high specificity or a high LHR+.
Al-though cultures remain negative in some cases of true in-fection (low sensitivity, poor LHR-), a positive growth of Gram-negative pathogens practically rules in sepsis.
Sometimes the clinical task is to verify the absence of infection. Almost all newborns with bacterial infection develop tachypnea or other respiratory symptoms at some stage of the infection. It is very rare to observe normal breathing patterns in newborns with infection who are left untreated. Translated into terms of test anal-ysis, respiratory symptoms are a clinical sign with high sensitivity or a very low LHR-. However, there are many other reasons for respiratory symptoms which are not re-lated to infection, for example, the specificity of respira-tory symptoms is low and the LHR+ is poor. While the
absence of respiratory symptoms for more than 48 h af-ter initial suspicion of infection practically rules out the disorder, the presence does not confirm infection.
Considering multiple variables
Often clinicians want to apply more than one test [21]. Unfortunately, results from different tests are usually not independent of each other. Patients with elevated procalci-tonin levels often also have elevated interleukin-8 levels. Neutropenic newborns with sepsis are more likely to pres-ent with thrombocytopenia [21]. As noted above, the lack of independence renders it inappropriate to perform sim-ple sequential Bayesian calculations. More sophisticated statistical methods must be employed that control for in-terdependence or colinearity [22]. This is achieved by multivariable logistic regression analysis [23]. Conceptu-ally such analysis estimates the predicted probability that infection is present, simultaneously considering more than one variable. Multivariable regression analysis not only controls for potential interdependence of variables but also allows additional variables to be considered that may confound the results. For example, premature infants may respond with less pronounced increases in cytokine levels than term newborns. On the other hand, premature infants may be more likely to be infected than term newborns. An analysis not controlling for the effect of gestational age may underestimate the diagnostic accuracy of a parameter.
Logistic regression analysis provides regression coef-ficients for each variable. Positive regression coefcoef-ficients and confidence intervals that do not include zero indicate that a higher level of the variable or the parameter is associated with an increased probability of infection. Confidence intervals that include zero imply that the variable does not significantly contribute to the predic-tion. The regression coefficients also allow cumulative diagnostic information to be determined when more than one variable is considered. An example is the Pediatric Risk of Mortality III score for predicting mortality. The score points, which are assigned to each criterion, were derived directly from the regression coefficients.
A limitation to entering multiple variables into the re-gression analysis is the requirement for sample size. If fewer than ten cases of infection are available per vari-able entered into the model, regression coefficients tend to become imprecise. An accepted practice to evaluate regression models is to divide the whole dataset into a derivation dataset (from which the prediction model is developed) and a smaller validation dataset in which the models predictive performance is tested [23].
Confidence intervals
It should be mandatory to report confidence intervals for any measure of diagnostic accuracy, including regression coefficients in multivariable regression models. The lower and upper limits of the 95% confidence intervals inform the reader about the interval in which 95% of all estimates of the measure (e.g., sensitivity, likelihood ra-tio or area under the curve) would fall if the study was repeated over and over again. This somewhat tricky, but mathematically correct definition, should be interpreted as following: If there is no bias distorting the observed data, it is also likely that the true population parameter lies between the lower and upper limit of the 95% confi-dence interval with a probability of 95%. If bias is pres-ent, the true population parameter may lie anywhere (for example, if someone measured the blood pressure in 1000 infants using the wrong cuff size, the true arterial pressure of the general population of similar infants may well lie outside the obtained narrow confidence interval). When likelihood ratios are reported, confidence inter-vals that include 1 indicate that the study has not shown statistically convincing evidence of any diagnostic value of the investigated parameter. Therefore the reader does not know whether a test with a LHR+ of 18 and a 95%
confidence interval of 0.8–85 is useful. A study report-ing a LHR+of 5.2 with a 95% confidence interval of 4.6
– 6.0 certainly provides more precise evidence than an-other study arriving at a LHR+ of 9 with a 95%
confi-dence interval of 2 – 19.
Narrow confidence intervals imply that a very large number of patients with and without disease were
ob-served. If the number of patients with and without dis-ease differs widely, the width of the confidence interval hinges on the smaller group. Usually the sample size in pediatric studies is small, leading the very wide confi-dence intervals. Likewise, most of the studies in new-borns or critically ill children are underpowered to allow statistically sound inferences about the differences in test accuracy. The invalidity of drawing conclusions from an area under the curve of 0.83 compared to an area of 0.80 becomes immediately apparent when confidence inter-vals are reported such as: 0.83 (95% CI 0.69 – 0.96) vs. 0.80 (95% CI 0.66 – 0.94).
Sources of systematic biases
Several important source of bias exist that may lead to overestimation of the test accuracy. First, due to the dif-ficulty to adjudicate on the presence or absence of infec-tion in all patients most studies on diagnostic markers of infection rely on undisputable definitions of cases (in-fected patients) and controls (unin(in-fected patients), while all episodes with potentially ambiguous classification are omitted from the analysis. The consequence is a case-control design. In a recent meta-analysis investigators assessed the influence of various features of the study design on the diagnostic odds ratio. They identified the case-control design as the most important source of bias for overestimating test accuracy (relative diagnostic odds ratio 3.0; 95% confidence interval, 2.0–4.5). Deviation from other desirable features of the ideal study on diag-nostic tests, for example, the lack of blinding, had less bearing on the estimates of the diagnostic accuracy [11]. The effect of the case-control study bias on more famil-iar terms of test accuracy is illustrated in the following example: Assuming a true likelihood ratio of a test of 5.7 for a positive result and of 0.17 for a negative result (e.g., specificity and sensitivity of 85%, respectively), according to the analysis by Lijmer and coworkers [11], the case-control design bias might inflate the likelihood ratio to 10 for a positive result and to 0.1 for a negative result (e.g., sensitivity and specificity of 91%).
Having considered the above points regarding report-ing of test accuracy study, readers want to know in the end whether the study data are applicable to their own patients. This is the time to critically ask: did the study investigate a similar spectrum of severity of disease as well as potential differential diagnoses as encountered in the readers setting? It is a prudent question to ask, since any of the patient characteristics related to severity of ill-ness, comorbidity or closely related pathologies may af-fect the results of the tests. Returning to the example of CRP measurements, most intensivists share the observa-tion that patients who are more seriously ill tend to yield higher plasma levels. The consequence is that the test appears more sensitive in very ill patients than in the less
severely ill (e.g., at a cutoff of 20 mg/l). This propensity is illustrated in the upper panel of Fig. 7 (first row) as a descending sensitivity with decreasing illness severity. Assuming that two investigators conduct two studies on the sensitivity of CRP, one in an outpatient emergency department, the other in the pediatric intensive care unit of the same hospital, and both admit 100 consecutive cases, the reported results are likely to differ, as illustrat-ed by the second and third row of the upper panel. The reader must decide which population does more closely matches the own mix of illness severity.
Unfortunately, spectrum bias affects not only sensitiv-ity. The lower panel of Fig. 7 presents the specificity of CRP with various differential diagnosis of sepsis. Con-sider a third study being conducted in the neonatal inten-sive care unit of the hospital. Because physicians do not admit patients after surgery to this unit, the differential diagnosis “postsurgical inflammation” is virtually absent
Fig. 7 Spectrum bias. Above The influence of disease severity.
Plasma levels of cytokines in patients with sepsis tend to be in-crease with severity. Thus for different strata of illness severity the sensitivity differs (if the cutoff is held constant). Therefore the overall sensitivity in the study population depends on the case-mix of severity, as shown in columns 2 and 3. Below The influence of disease spectrum. If the control population contains few patients, who show elevated cytokine concentrations (e.g., after surgery), the specificity is high. If the list of differential diagnoses to be consid-ered includes conditions that are associated with positive test re-sults, specificity drops. Holding all other factors constant, either ef-fect alone can profoundly change likelihood ratios, the area under the receiver operating curve, and the diagnostic odds ratio
from the list of alternative diagnoses. The lack of other possible cause for CRP elevation boosts specificity (sec-ond row), unlike in the pediatric intensive care unit (third row) where postsurgical inflammation is common. In summary, the mix of severity of illness is likely to af-fect sensitivity, while the mix of alternative diagnosis may affect specificity. Moreover, if sensitivity and speci-ficity are affected by case mix and severity, so is the likelihood ratio. To allow critical appraisal of the appli-cability of a report, authors should therefore be required to provide sufficient data on patients who were not in-cluded as well as indicators for severity of disease, case mix, and other potential sources of spectrum bias.
Summary
In conclusion, articles on the diagnostic accuracy of new tests should provide the following technical information: a plot of the raw data, multilevel likelihood ratios, a plot showing the relationship between sensitivity and speci-ficity for various cutoff levels (the receiver operating characteristic curve) and a computation of the area under the curve. All measures should be reported with confi-dence intervals. To allow comparison to more traditional reports, the sensitivity and specificity for the cutoff yielding the highest discriminative ability (defined as the cutoff point on the receiver operating characteristic curve closest to the upper left corner of the graph) should be reported. This review discusses the assessment of test accuracy in the context of quantitative tests to aid decision making in pediatric patients with suspected in-fection. The principles laid out in this overview can also be applied to the interpretation of clinical symptoms and nonlaboratory tests (e.g., the value of computed tomog-raphy scans for the diagnosis of appendicitis).
The criteria for assessing studies on diagnostic tests in infection can be summarized in the following set of question that can be put to individual studies [18]: – Criteria related to conduction and report of the study – Were the criteria for outcome adjudication (infected
vs. not infected) adequately described to permit their replication?
– Was the outcome assessed blind to the results of the test under investigation?
– Did the results of the test being evaluated influence the decision to perform the reference standard (e.g., obtaining blood cultures)?
– Has the diagnostic test been evaluated in a patient sample that included an appropriate spectrum of dis-ease severity, treated and untreated patients and indi-viduals with disorders considered as differential diag-nosis?
– Was the sample obtained at the time when a decision had to be made?
– Were the inclusion and exclusion criteria for patients adequately described?
– Was the reproducibility of the test result (precision) described?
– Criteria related to the applicability of the study to concurrent patients
– Have the methods for carrying out the test been de-scribed (including sampling techniques) detailed enough to permit their exact replication?
– Would the results change the management of the pa-tients?
– Will a patient be better off as a result of the test? – Criteria related to the technical report of test accuracy – Was a plot of the raw data provided?
References
1. Escobar GJ (1999) The neonatal “sepsis work-up”: personal reflections on the development of an evidence-based approach toward newborn infec-tions in a managed care organization. Pediatrics 103:360–373
2. Stoll BJ, Gordon T, Korones SB, Shankaran S, Tyson JE, Bauer CR, Fanaroff AA, Lemons JA, Donovan EF, Oh W, Stevenson DK, Ehrenkranz RA, Papile LA, Verter J, Wright LL (1996) Early-onset sepsis in very low birth weight neonates: a report from the National Institute of Child Health and Human Development Neonatal Research Network. J Pediatr 129:72–80
3. Benitz WE, Gould JB, Druzin ML (1999) Preventing early-onset group B streptococcal sepsis: strategy develop-ment using decision analysis. Pediat-rics 103:e76
4. Hammerschlag MR, Klein JO, Her-schel M, Chen FC, Fermin R (1977) Patterns of use of antibiotics in two newborn nurseries. N Engl J Med 296:1268–1269
5. Berner R, Niemeyer C, Leititis J, al. e (1998) Plasma levels and gene expression of granulocyte colony-stimulating factor, tumor necrosis factor-a, interleukin (IL) 1-b, IL-6, IL-8, and soluble intercellular adhesion molecule-1 in neonatal early onset sepsis. Pediatr Res 44:469–477
6. Kuster H, Weiss M, Willeitner AE, Detlefsen S, Jeremias I, Zbojan J, Geiger R, Lipowsky G, Simbruner G (1998) Interleukin-1 receptor antago-nist and interleukin-6 for early diagno-sis of neonatal sepdiagno-sis 2 days before clinical manifestation. Lancet 352:1271–1277
7. Chiesa C, Panero A, Rossi N, Stegagno M, De Giusti M, Osborn JF, Pacifico L (1998) Reliability of procalcitonin concentrations for the diagnosis of sepsis in critically ill neonates. Clin Infect Dis 26:664–672
8. Isaacman DJ, Karasic RB, Reynolds EA, Kost SI (1996) Effect of number of blood cultures and volume of blood on detection of bacteremia in children. J Pediatr 128:190–195
9. Jaeschke R, Guyatt GH, Sackett DL (1994) Users’ guides to the medical literature. III. How to use an article about a diagnostic test. B. What are the results and will they help me in caring for my patients? The Evidence-Based Medicine Working Group. JAMA 271:703–707
10. Jaeschke R, Guyatt G, Sackett DL (1994) Users’ guides to the medical literature. III. How to use an article about a diagnostic test. A. Are the
results of the study valid? Evidence-Based Medicine Working Group. JAMA 271:389–391
11. Lijmer JG, Mol BW, Heisterkamp S, Bonsel GJ, Prins MH, van der Meulen JH, Bossuyt PM (1999) Empirical evidence of design-related bias in stud-ies of diagnostic tests. JAMA
282:1061–1066
12. Smith JE, Winkler RL, Fryback DG (2000) The first positive: computing positive predictive value at the ex-tremes. Ann Intern Med 132:804–809 13. Dujardin B, Van den Ende J, Van
Gompel A, Unger JP, Van der Stuyft P (1994) Likelihood ratios: a real im-provement for clinical decision making? Eur J Epidemiol 10:29–36 14. Pauker SG, Kassirer JP (1980) The
threshold approach to clinical decision making. N Engl J Med 302:1109–1117 15. Weinstein MC, Fineberg HV (1980)
Clinical decision analysis. Saunders, Philadelphia
16. Pauker SG, Kopelman RI (1992) Interpreting hoofbeats: can Bayes help clear the haze? N Engl J Med 327:1009–1013
17. Fagan TJ (1975) Nomogram for Bayes theorem. N Engl J Med 293:257 18. Hanley JA, McNeil BJ (1983) A
method of comparing the areas under receiver operating characteristic curves derived from the same cases. Radiolo-gy 148:839–843
19. McNeil BJ, Hanley JA, Funkenstein HH, Wallman J (1983) Paired receiver operating characteristic curves and the effect of history on radiographic interpretation. CT of the head as a case study. Radiology 149:75–77
20. Swets JA (1988) Measuring the accura-cy of diagnostic systems. Science 240:1285–1293
21. Mahieu LM, De Muynck AO, De Dooy JJ, Laroche SM, Van Acker KJ (2000) Prediction of nosocomial sepsis in neonates by means of a computer-weighted bedside scoring system (NOSEP score). Crit Care Med 28:2026–2033
22. Tosteson AN, Weinstein MC, Wittenberg J, Begg CB (1994) ROC curve regression analysis: the use of ordinal regression models for diagnos-tic test assessment. Environ Health Perspect 102 [Suppl 8]:73–78 23. Bagley SC, White H, Golomb BA
(2001) Logistic regression in the medical literature: standards for use and reporting, with particular attention to one medical domain. J Clin Epide-miol 54:979–985