Concentration of 17 Trace Elements
in Serum and Whole Blood of Plains
Viscachas (Lagostomus maximus)
by ICP-MS, Their Reference Ranges,
and Their Relation to Cataract
R. F
ORRER,*
,2C
H. W
ENKER,
2K. G
AUTSCHI,
1 ANDH. L
UTZ1 1Clinical Laboratory, Department of Internal Veterinary
Medicine; and
2Division of Zoo Animals and Exotic Pets,
University of Zurich, Winterthurerstrasse 260,
CH-8057 Zurich, Switzerland
Received August 5, 2000; Revised October 30, 2000; Accepted November 11, 2000
ABSTRACT
The reference ranges of the trace elements Al, As, Be, B, Cd, Co, Cu, Fe, Mn, Mo, Ni, Pb, Li, Rb, Se, Sr, and Zn were determined by inductively coupled plasma–mass spectrometry (ICP-MS) in sera of a group of free-ranging plains viscachas of the pampa grasslands of Argentina. The values were compared with those of a small group of captive plains viscachas of the Zurich Zoo with diabetes and bilat-eral cataracts. In addition, a method for digestion of whole-blood samples is described for the trace element determination. Significant differences in the concentration of trace elements in the two groups of animals are discussed. No correlation was found between the lev-els of selenium and of other trace elements compared to the forma-tion of cataracts.
Index Entries: Trace elements; plains viscacha (lagostomus
max-imus); cataract; diabetes; serum; whole blood; reference ranges;
ICP-MS; aluminum; arsenic; beryllium; boron; cadmium; cobalt; copper; iron; manganese; molybdenum; nickel; lead; lithium; rubidium; sele-nium; strontium; zinc.
0163–4984/01/8101–0047 $14.00
INTRODUCTION
Plains viscachas (Lagostomus maximus) are large rodents living in the pampa grasslands of Argentina, Bolivia, and Paraguay. Several viscachas kept in the Zurich Zoo became blind as a result of severe cataracts. It was postulated that the cataracts may have been caused by diabetes mellitus, which, in turn, may have been induced by a diet too rich in carbohy-drates or by the disturbance of the metabolism of some trace elements. For this reason, it was decided to determine important blood parameters, including trace elements, both in the zoo-kept animals and in viscachas living in their natural habitat.
Trace elements are essential for the normal function of different meta-bolic processes in the body. The trace elements most often determined in the clinical laboratory are copper, zinc, selenium, and aluminum. Others are toxic even in very low concentrations, like lead, cadmium, and arsenic. Trace elements receive more and more clinical interest raised by the following:
1. The discovery that abnormalities of the metabolism of spe-cific elements are involved in the pathogenesis of human and animal diseases
2. The documentation that deficiencies can occur under ordi-nary dietary conditions and the increasing awareness of the risk of excessive environmental or occupational exposure to certain elements
3. The observation that various clinical conditions (e.g., myocardial infarction, liver cirrhosis, renal insufficiency, and others) are associated with measurable abnormalities of trace element levels
4. The increasing sensitivity and reliability of the analytical methods and the possibility of obtaining results in a short time
There are many well-known diseases related to trace element ab-normalities: Wilson’s disease (hepatolenticular degeneration, copper storage disease), Menkes’disease (steely hair sydrome, abnormalities in the collagen–elastin structures in copper deficiency), Danbolt’s disease (acrodermatitis enteropathica, a disorder of zinc metabolism), and White Muscle disease (Se deficiency), which is well known in ruminants.
In trace element analysis, it is essential to prevent contamination of the sample with exogenous trace sources (i.e., those not native to the sample but originating from dust, water, utensils, containers, equipment, and laboratory personnel). After it became possible to determine trace elements in the ppb and ppt ranges, this became a very important fea-ture. To avoid contamination, a proper collection and preparation of the samples is crucial. Until now, the atomic absorption spectroscopy was the most popular analytical intrument used for the quantification of trace
elements. This method, in general, allowed the determination of one ele-ment at the time, with an individual sample preparation for each eleele-ment and the need of a defined volume of material for each element. At present, there are only a few multielement atomic absorption systems available.
In this article, a high-technology method with a multielement analyt-ical system, the inductively coupled plasma–mass spectrometer (ICP-MS), was applied. This equipment is available since 1984, but it has been used, for the most part so far, for analysis of victuals and soil samples. The advantages of this method are the simultaneous analysis of different ele-ments, the low detection limits and the wide range of linearity, the avail-ability of the results in a shorter time, and the reduced need of material because all elements are measured in the same sample volume and with a minimum of errors (1,2). The disadvantage is that the interferences of the sample matrix is greater because it needs to be overcome for every element measured simultaneously. Very high levels of carbon in biologi-cal materials produce many interfering ions.
The goal of this work was to apply the previously described, opti-mized method of simultaneous analysis of trace elements (2) for the determination of the following 17 parameters: aluminum, arsenic, boron, beryllium, cadmium, cobalt, copper, iron, lead, lithium, manganese, molybdenum, nickel, rubidium, selenium, strontium, and zinc in sera of free-ranging plains viscachas. In addition, a nitric acid digestion method was developed that was based on microwave treatment of whole blood and that allowed the determination of the concentrations of trace ele-ments in this material. The reference ranges of the 17 eleele-ments for serum and for some of them also in whole-blood samples of plains viscachas are established and discussed. Finally, the values of the trace elements of captive diabetic plains viscachas were compared with the established ref-erence ranges.
MATERIALS AND METHODS
Study Animals, Sample Collection,
and Preparation
The study animals were free-ranging plains viscachas (Lagostomus
maximus; Rodentia, Chinchillidae), a large rodent species, living in the
pampa grasslands in the Department of San Javier in the northern part of the Santa Fe Province, Argentina. During a translocation project, 41 animals were captured and anesthetized with a ketamine–xylazine com-bination. Details of this field work are described by one of the authors
(3). Each animal received a complete physical examination and all were
considered to be apparently healthy. Under anesthesia, blood was collected from the saphenous vein. Blood contact with the rubber stoppers was minimized to prevent contamination of samples. Immediately following
venipuncture, blood was transferred to vacutainer tubes especially coated with silicon and equipped with a special trace-element-free rub-ber plug with and without heparin (Vacutainer System Europe B. P. Nr. 36-7735 resp. 37-38241, Meylan Cedex France).
Immediately after coagulation of the blood samples without additive, the samples were centrifuged at 2000g and the serum was transferred to another trace element vacutainer tube. Both sera and heparinized blood samples were placed for storage in a styrofoam box with dry ice for the transportation to our laboratory in Switzerland, where they were stored at−20°C until analysis.
In addition, serum and whole-blood samples were collected from seven captive plains viscachas from the Zurich Zoo, and the concentra-tions of trace elements were compared with those of the free-ranging plains viscachas. As now we know, the zoo animals suffered from a dia-betic condition characterized by obesity, hyperglycemia, glucosuria, and bilateral cataracts. For the separation of the serum from the blood sam-ple, serum–plasma separators were used (Sure-Sep. II Jr. Organon Teknika Corporation, Durham, NC, USA).
Solutions, Standards, and Reference Sera
Deionized 18 MΩ water was prepared by Elgastat Maxima (Elga Ltd., Wycombe, Bucks, UK) and used for sample dilution and standard prepa-ration. Acetic acid (Microselect, Art. # 45726, Fluka AG, Buchs, Switzer-land) served to acidify standards and serum samples as described previously (1). Merck ICP–MS multielement standard solution (Merck VI, Darmstadt, Germany) was used for external calibration. Rhodium (John-son Matthey GmbH, Karlsruhe, Germany) was used as the internal stan-dard throughout all measurements. Triton X-100 (Sigma, Art. # 90002-93-1) was added as detergent to all measured solutions at a concentration of 0.1% (v/v).
For digestion of whole-blood samples, nitric acid 65 % (p.a. grade) subjected to distillation (Merck, Switzerland Art. Nr. 1.00456.100) and hydrogen peroxide solution 31% of ultrapure quality (Merck, Switzer-land, Art. Nr. 1.06097.1000) were used. Nitric acid was added to the sam-ples and standards to a final concentration of 20% (v/v).
Freeze-dried reference sera, normal and elevated levels, from UTAK Laboratories Inc. (Valencia, CA 91355, USA) and Nycomed (Nycomed Pharma, Oslo, Norway) were used for method validation for the serum samples. To validate the analysis of whole blood, freeze-dried reference blood, levels I, II, and III, were used (Nycomed PharmaAS, Oslo, Norway).
Digestion of Whole Blood
The whole-blood samples were submitted to an oxidative acid diges-tion in a microwave oven. Five hundred microliters of whole blood were placed in 6-mL Teflon vessels together with 1.5 mL ultrapure nitric acid.
After a few minutes, 1 mL of ultrapure hydrogen peroxide solution 31 % was added. Outside the sample vessel, 3 mL ultrapure water and 1 mL ultrapure hydrogen peroxide solution 31% were placed. The settings for the microwave oven were as follows: Step 1: 5 min, 800 W, 120°C; Step 2: 5 min, 900 W at 180°C; Step 3: 5 min, 900 W, at 190°C; Step 4: 8 min, 800 W at 190°C. After cooling, the samples were diluted with deionized 18 MΩ water to a final volume of 7.5 mL and the trace elements were measured.
Instrumentation
The ICP-MS measurements were done using a Varian UltraMass™ ICP-MS system (Varian Optical Spectroscopy Instruments, Melbourne Australia). The plasma source was 99.998% argon (Carbagas 3097, Liebe-feld, Bern, Switzerland). For the preparation of standards and samples and the digestion procedure, only Teflon or polyvinyl chloride (PVC) flasks and tubes were employed. All operating parameters were under computer control, which allowed simple and fast optimization routines for different matrices. The instrument settings were described by Forrer et al. (1).
The nitric acid digestion was done in a microwave oven (MLS-ETHOS 1600 Microwave System with a color terminal 800 control system, temper-ature controlled from Milestones MLS GmbH Mikrowellen-Labor-Systeme, Auenweg, Leutkirch im Allgäu). The digestions were done in 6-mL teflon vessels.
The nitric acid was distilled in a subPUR Subboiling System from MLS GmbH (MLS GmbbH Mikrowellen-Labor-Systeme, Auenweg, Leut-kirch im Allgäu). For the quantification of the acid and the hydrogen per-oxide solution (31%), Optifix bottle-top dispensers were used.
The elements (nuclide used) Al (27), As (75), B (11), Be (9), Cd (111), Co (59), Cu (65), Fe (57), Li (7), Pb (206, 207, 208), Mn (55), Mo (95), Ni (60), Rb (85), Se (77/82), Sr (88), and Zn (66) were measured with the ICP-MS. An external calibration with matrix matching of the blank and exter-nal calibration solution for the organic matter was used to overcome matrix-induced effects on signal intensities. For the serum samples, acetic acid at the optimum concentration of 10% (v/v) was used for matrix matching (1,4).
Sample Preparation for the ICP-MS
and Conditions of Measurement
For the sample preparation, 13 mL polypropylene tubes with screw caps (Sarstedt AG, 9475 Sevelen SG, Switzerland Article Nr. 46.390.001) were used. Previously, they were cleaned with citric acid at pH 2 and Extran (sodium hydroxide solution) at pH 10 (MA 01 alcaline, Art. Nr. 1.07555 Merck KGaA, Darmstadt, Germany) and rinsed with deionized 18 MΩ water.
The serum samples were diluted at 1 part plus 9 parts with 10% acetic acid with 0.1% Triton X-100 and 20 µg/L rhodium as the internal standard. The digested whole-blood samples with a content of nitric acid of 20% were diluted 15 times with ultrapure water before measurement. As men-tioned earlier, rhodium was used as the internal standard at 20 µg/L.
The gas flow in the nebulizer is known to be strongly dependent on the nature of the aspirated sample matrix and was set at 0.84 L/min with a peristaltic pump for the acetic acid matrix. For the nitric acid matrix, the gas flow was set at 0.87 L/min and the same pump rate was used for serum. Details for this method were described by Forrer et al. (2).
Statistical Analysis
All data were statistically evaluated using the Microsoft Excel com-puter program with the statistics add-in Astute (DDU Software, The Uni-versity of Leeds, Old Medical School, Leeds, UK, 1995). As it is unknown whether the different elements are normally distributed, the box and whiskers plots were used to define the 5%, 50%, and 95 % quantiles for the different elements (5). For a comparison of the median values of the free-ranging group with those of the captive diabetic viscachas, the Wilcoxon–Mann–Whitney U-test was used (6).
RESULTS AND DISCUSSION
The ICP-MS method for the analysis of trace elements was applied in this study. The calibration was performed using one blank and four standard concentrations for each element measured. The concentrations were 0, 2, 5, 10, and 20 µg/L. The standard curve corresponded to the regression line calculated from the standard values using the minimal square method of Spearman (7).
The established trace element reference ranges for serum and whole blood of free-ranging plains viscachas are shown in Tables 1 and 2. The serum and whole blood concentrations of trace elements of a small group of diabetic viscachas of the Zurich zoo were determined. The results are summarized in Tables 3 and 4. A comparison of the trace element con-centrations of the diabetic animals with those of the reference ranges of free-ranging animals and its significance is summarized in Table 5.
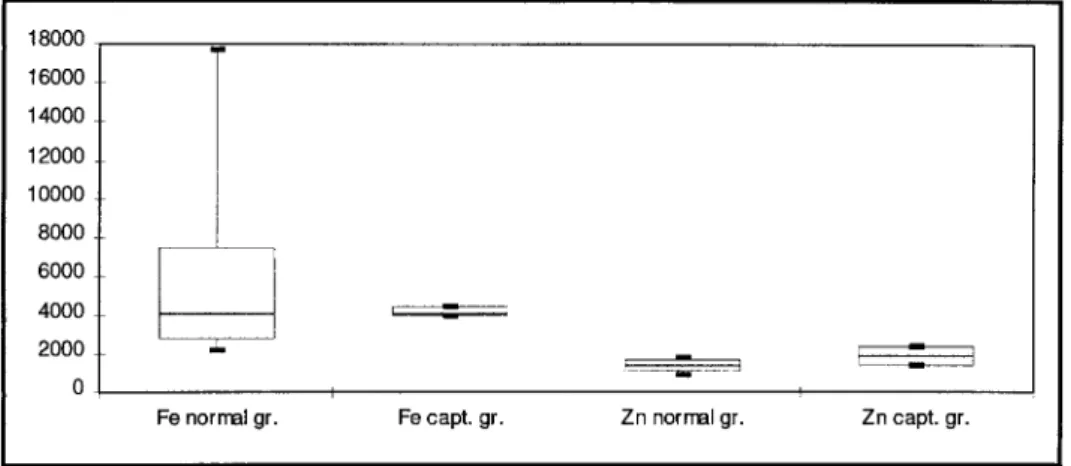
Figures 1–4 present the boxplots of the serum concentrations of selected elements collected from the diabetic and the normal groups. The presentation of the reference values as boxplots was chosen because it is independent of the distribution of the values.
Multielement determinations in clinical samples such as serum can be performed directly and rapidly with ICP-MS. However, a great num-ber of spectral interferences were encountered in the analysis of this bio-logical material, as was already described by Vanhoe (8). Matrix
matching is essential when dealing with high-electron-volt elements like Se and As in biological samples or any sample matrix containing signif-icant amounts of organic matter. Acetic acid was found to be ideal for this purpose (1). Whole-blood samples have to be digested before analy-sis in order to remove the organic contribution of the matrix and to pro-vide inorganic interferences only. Serum is the preferred material for most parameters in clinical chemistry analysis. Whole blood is mostly used for the elements that are present in or bound to the erythrocytes. For this reason, the concentrations of the trace elements in serum and whole blood are not identical. Further, the determination of the concen-tration of some elements (e.g., Se) allows the judgment of the long-term supply of that element. Serum levels reflect recent changes of dietary intake, whereas erythrocytes accumulate the element and presumably reflect its intake over a much longer time (9,10). Over 99% of the lead present in the blood is usually found in erythrocytes (11).
Table 1
Ranges of 17 Trace Elements in Sera Collected from 41 Free-Ranging Captive Diabetic Plains Viscachas in Argentina
There are several factors that influence the concentration of trace elements that have to be considered when values are compared between free-ranging and zoo-kept animals. First, the content of the trace ele-ments in the diet reflects the content of these eleele-ments in the soil. Sec-ond, many elements have antagonists (cf. the antagonism between copper and zinc). Third, the age of the animals has a large influence on the absorption of trace elements. Fourth, the resorption of trace elements is also dependent on the amount of fiber taken with the food. Malnutri-tion and hypocaloric diets also reduce the supply of trace elements.
The reference ranges established in this article were obtained from free-ranging plains viscachas of the pampa grasslands in Argentina. It is well known that these animals live at different environmental conditions and consumed different food compared to the animals kept in zoological gardens.
It was recently realized that the viscacha diet in the Zurich Zoo was too high in energy and carbohydrates compared with the low-energy and high-fiber diet of the free-ranging animals.
The development of age-related cataracts depends on a variety of factors. The mechanisms that bring a loss in transparency include oxida-tion, osmotic stress, and chemical adduct formation. Risk factors for cataract include diabetes, radiation (ultraviolet B, x-ray), certain drugs, certain nutritional states, and, possibly, acute episodes of dehydration. The nutrition must be considered as one part of a tapestry of intertwined
Table 2
Ranges of 12 Trace Elements in Whole-Blood Collected from 41 Free-Ranging Plains Viscachas in Argentina
events and responses. Excessive caloric intake needs to receive additional emphasis as a factor contributing to cataracts. Diabetes increases the like-lihood of cataract formation threefold to fourfold. Obesity is considered a major risk factor for non-insulin-dependent, or type II, diabetes (12).
Rubidium as an alkali metal is widely distributed among the vari-ous organs and blood. Rubidium is an intracellular essential ion, physi-ologically similar to potassium, and is, consequently, distributed throughout the body. The chemical similarity (charge and ion radius) of rubidium to potassium suggests that, to some extent, rubidium can be regarded as a substitutive tracer for potassium (13). This may be the rea-son why the concentration of rubidium, like potassium, is higher in the red blood cells and is encountered in a higher concentration in the whole blood and is correlated to the packed-cell volume (PCV).
There are many different etiologies for blindness in man and ani-mals, including rodents. Retinal degeneration is an important cause of
Table 3
Ranges of 17 Trace Elements in Sera Collected from Captive Diabetic Plains Viscachas from the Zurich Zoo
blindness affecting more than 3 million people worldwide, particularly in developing countries. Certain strains of rodents have a hereditary defect that leads to symptoms and courses of disease similar to that found in some forms of human retinal dystrophies (14). El-Hifnawi et al. described an improvement of the condition of the retina in affected rats after the administration of vitamin E. This improvement may imply that lipid per-oxidation plays at least a partial role in the initiation of retinal dystrophy in the rat, because vitamin E is known to have a protective effect against oxygen free radicals (14–17). The authors demonstrated additionally that degenerative changes in the retina and retina pigment epithelium is asso-ciated with a vitamin-E-deficient diet (9). In albino rats, it has been ob-served that animals deficient in selenium and vitamin E showed a loss of photoreceptor cells, marked disruption of outer-segment membranes, and an increase in lipofuscin granules in the pigment epithelium as a re-sult of high sensitivity to in vivo lipid peroxidation (18).
Selenium deficiency and excess are both known to cause cataracts (19) and retinal damage (20). Furthermore, Se-dependent glutathion peroxi-dase activity has been found in ocular tissues (21). Today, the pathomech-anisms leading to cataract formation in Se-deficient rodents are known
(21). Several studies have shown that the levels of trace minerals,
includ-ing selenium, were altered in human cataracts (22–24). Shearer and David
(26) studied the role of certain minerals in the formation of cataract caused
Table 4
Ranges of 12 Trace Elements in Whole Blood Collected from Captive Diabetic Plains Viscachas from the Zurich Zoo
by an overdose of selenium and demonstrated that calcium concentration plays an important role in selenite cataractogenesis (25). The permeabil-ity of calcium and the Ca2+accumulation in lenses from rats treated with selenite are affected (26).
In the study group of captive plains viscachas of the Zurich Zoo, the selenium concentrations were significantly higher than in that of the nor-mal grassland group. The range of Se of 300–500 µg/L serum found in the zoo-kept animals was well below toxic levels (27). Therefore, it was concluded that the Se supply in the zoo-kept viscachas was better than that of their free-ranging relatives and that the observed cataracts were not caused by the lack or excess of Se in the diet. The diet of the zoo vis-cachas was supplemented with a commercial multivitamine pellet (M21®, Multiforsa, Zug, Switzerland) containing 4 mg/kg selenium.
Table 5
Wilcoxon–Mann–Whitney Test for 16 Measured Trace Elements in Sera; Comparison of Reference Ranges
Wu et al. (28), found that the contents of trace elements Cr, Zn, and Cu in streptozotocin-induced diabetic rats correlated closely with their blood sugar levels. The concentration of these elements in the liver cor-related directly with that in the kidney, but inversely with the chromium contents in the kidney. Therefore, improvement of blood sugar levels in diabetic rats may, to a certain extent, improve the metabolism of trace elements in the body. The significantly higher concentrations of Cu and Zn in the serum of the captive diabetic plains viscachas agree well with the observations of Wu et al. (28).
Chromium and vanadium are essential trace elements directly involved in the glucose metabolism or in the function of the pancreatic
Fig. 1. Comparison of the boxplot presentations of the concentrations of the elements iron and zinc in sera from the diabetic group and normal group of viscachas.
Fig. 2. Comparison of the boxplot presentations of the concentrations of the elements rubidium, selenium, and strontium in sera from the diabetic group and normal group of viscachas.
hormone insulin (29). Their role in one type of impaired glucose tolerance was demonstrated in a supplementation experiment by Jeejeebhoy et al.
(30). Borel and Anderson (31) reviewed the biochemistry of chromium
extensively. The role of trivalent Cr in maintaining normal glucose toler-ance in rats was demonstrated in 1959 (32). The gradual deterioration of the glucose tolerance by Cr deficiency in rats is caused by insulin-resis-tant tissue (33).
Perhaps these elements would be of interest for the study of their rela-tionship in the diabetic animals of the Zurich Zoo. The analysis of chrom-ium is very difficult because the concentrations in the blood are very low (0–0.3 (g/L) and it is a quite ubiquitous element in the measurement equip-ment and in the environequip-ment. Cr and V were not determined in this study.
Fig. 3. Comparison of the boxplot presentations of the concentrations of the elements cadmium, cobalt, and lead in sera from the diabetic group and nor-mal group of viscachas.
Fig. 4. Comparison of the boxplot presentations of the concentrations of the elements copper, molybdenun, and lithium in sera from the diabetic group and normal group of viscachas.
While comparing reference ranges with values of the captive group, several elements were observed to be significantly higher in their con-centrations. For the elements Cd, Co, Cu, Ni, Pb, Rb, Se, and Zn, a higher concentration was found in the captive viscachas. Most likely, the differences reflect the different diet and/or environment. It is remark-able that the selenium concentrations were two times higher in the zoo-kept animals than in the wild plains viscachas. For the elements Al, As, Li, Mo, and Sr, lower concentrations in the sera of the captive animals were found.
The different concentrations found in this study in the zoo-kept ani-mals may not have any consequences for carbohydrate metabolism or the health status of these animals in general. No significant differences between the groups were found for Be, Fe, Li, Mn, and Mo.
CONCLUSIONS
For further studies on this group of patients, it is important to have established the reference ranges of trace elements in this animal species. Although we have demonstrated differences in the concentrations of sev-eral trace elements in serum and whole blood, it appears to be unlikely that the cataracts are caused by deviations in the metabolism and/or supply of these elements. They are considered to reflect different dietary and environmental conditions in captive and free-ranging animals.
REFERENCES
1. R. Forrer, K. Gautschi, A. Stroh, and H. Lutz, Direct determination of selenium and other trace elements in serum samples by ICP-MS, J. Trace Elements Med. Biol. 12,
240–247 (1998).
2. R. Forrer, K. Gautschi, and H. Lutz, Simultaneous measurement of trace elements: Al,
As, B, Be, Cd, Co, Cu, Fe, Li, Mn, Mo, Ni, Rb, Se, Sr and Zn in human serum and their reference ranges by ICP-MS, Biol. Trace Element Res. (2000), in press.
3. Ch. J. Wenker, H. Oppliger, D. Hunziker, J. Lopez, and E. Isenbügel, Mission
(im)pos-sible: capture management and field research of free-ranging plains viscacha
(Lagos-tomus maximus) in Argentina, Proceedings of the Third Scientific Meeting of the
European Association of Zoo and Wildlife Veterinarians, Paris, pp. 151–154 (2000).
4. E. H. Larsen and S. Sturup, Carbon-enhanced inductively coupled plasma mass
spec-trometric detection of arsenic and selenium and its application to arsenic speciation,
J. Anal. Atomic Spectrom. 9, 1099–1105 (1994).
5. E. Eggenberger and R. Thun, Eine graphische Methode zur Darstellung von
Mess-werten, Schweiz. Arch. Tierheilk. 126, 199–205 (1984).
6. L. Sachs, Angewandte Statistik, Springer-Verlag, Berlin (1984).
7. R. G. Cornell, Spearman estimation for a simple exponential model, Biometrics 21,
858–864 (1965).
8. H. Vanhoe, J. Goossens, L. Moen, and R. Dams, Spectral interferences encountered in
the analysis of biological materials by inductively coupled plasma mass spectrome-try, J. Anal. Atomic Spectrom. 9, 177–185 (1994).
9. M. F. Robinson, H. M. Rea, G. M. Friend, R. D. H. Stewart, P. C. Snow, and C. D. Thomson, On supplementing the selenium intake of New Zeealanders. 2. Pro-longed metabolic experiments with daily supplements of selenomethionine, selenite and fish, Br. J. Nutr. 39, 589–600 (1978).
10. H. M. Rea, C. D. Thomson, D. R. Campbell, and M. F. Robinson, Relation between ery-throcyte selenium concentrations and glutathione peroxidase (EC 1.11.1.9) activities of New Zealand residents and visitors to New Zealand, Br. J. Nutr. 42, 201–208 (1979). 11. I. A. Bergdahl, A. Grubb, A. Schutz, R. J. Desnick, J. G. Wetmur, S. Sassa, et al., Lead
binding to delta-aminolevulinic acid dehydratase (ALAD) in human erythrocytes, Pharmacol. Toxicol. 81, 153–158 (1997).
12. G. Bunce, J. Kinoshita, and J. Horwitz, Nutritional factors in cataract, Annu. Rev. Nutr., 10, 233–254 (1990).
13. R. Hirunuma, K. Endo, M. Yanaga, S. Enomoto, S. Ambe, A. Tanaka, et al., The use of a multitracer technique for the studies of the uptake and retention of trace ele-ments in rats, Appl. Radiat. Isot 48, 727–733 (1997).
14. E. S. El-Hifnawi, D. T. Lincoln, and H. Dashti, Nutritionally induced retinal degen-eration in rats, Nutrition 11 (Suppl.), 705–707 (1995).
15. E. S. El-Hifnawi, D. Lincoln, and H. Dashti, Effects of vitamin E on the retina and retina pigment epithelium of RCS rats, Nutrition 11, 576–581 (1995).
16. A. Hollis, W. Butcher, H. Davis, R. Henderson, and W. Stone, Structural alterations in renal tissues from rats deficient in vitamin E and selenium and treated with hyper-baric oxygen, Exp. Eye Res. 54, 671–684 (1992).
17. W. Stone, R. Henderson, and G. Howard, Jr., et al., The role of antioxidant nutrients in preventing hyperbaric oxygen damage to the retina, Free Radicall Biol. Med. 6, 505–512 (1989).
18. M. Katz, K. Parker, G. Handelmann, T. Bramel, and E. Dratz, Effects of antioxidant nutrient deficiency on the retina and retina pigment epithelium of albino rats: a light and electron microscopic study, Exp. Eye Res. 34, 339–369 (1982).
19. I. Ostaladova, A. Bubicky, and J. Obenberger, Cataract induced by administration of a single dose of sodium selenite to suckling rats, Experientia 34, 222–223 (1978). 20. Y. Amemiya, Retinal changes in the selenium deficient rat, Int. J. Vitam. Nutr. Res. 55,
233–237 (1985).
21. P. L. Bergad, W. B. Rathbun, and W. Linder, Glutathione peroxadase from bovine lens: a selenoenzyme, Exp. Eye Res. 34, 131–144 (1982).
22. K. C. Bhuyan, T. Baxter, and S., M. J., Selenium status in the eye: increased level in cataract in the human and its distribution in the eye tissues of animals, Invest. Oph-thalmol. Vis. Sci. 22, (Suppl.), 35 (1982).
23. A. A. Swanson and A. W. Truesdale, Elemental analysis in normal and cataractous human lents tissues, Biochem. Biophy. Res. Commun. 45, 1488–1496 (1971).
24. E. L. Lakomaa and P. Eklund, Trace element analysis of human cataractous lenses by neutron activation analysis and atomic absorption, Proceedings Series Nuclear Acti-vation Techniques in the Life Sciences. International Atomic Energy—MS, 227, pp. 333–334 (1979).
25. T. R. Shearer and L. L. David, Role of calcium in selenium cataract, Curr. Eye Res. 2, 777–784 (1983).
26. Z. Wang, J. Hess, and G. Bunce, Deferoxamine effect on selenite-induced cataract for-mation in rats, Invest. Ophthalmol. Vis. Sci. 33, 2511–2519 (1992).
27. G. N. Schrauzer, Selen: Neue Entwicklungen aus Biologie, Biochemie und Medizin, Johann Ambrosius Barth Verlag, Heidelberg (1998).
28. J. Wu, Q. Chen, and Z. Gao, Changes in contents of chromium, zinc and copper in the blood, liver and kidney of diabetic rats, Chung-Hua Yu Fang i Hsueh Tsa Chih [Chin. J. Prevent. Med.], 31, 37–39 (1997).
29. M. Anke, B. Groppel, K. Gruhn, T. Kosla, and M. Szilagyi, New research on vana-dium deficiency in ruminants, in 5. Spurenelement-Symposium Al, As, Cd, Hg, Ni, Pb, Sn, Tl, Si, V, M. Anke, W. Baumann, H. Bräunlich, Chr. Brückner, B. Groppel, Karl-Marx-Universität Leipzig, Friedrich-Schiller-Universität Jena, pp. 1266–1283 (1986).
30. K. Jeejeebhoy, R. C. Chu, E. B. Marliss, G. R. Greenberg, and A. Bruce-Robertson, Cromium deficiency, glucose intolerance, and neuropathy reversed by chromium supplementation, in a patient receiving long-term parenteral nutrition, Am. J. Clin. Nutr. 30, 531–538 (1977).
31. J. S. Borel and R. A. Anderson, Biochemistry of the Elements, E. Frieden, ed., Plenum, New York, Chap. 8 (1984).
32. K. Schwarz and W. Mertz, Selenium as an integral part of factor 3 against dietary necrotic liver degeneration, Arch. Biochem. Biophys. 85, 292 (1959).
33. W. Mertz, E. E. Roginski, and K. Schwarz, Effect of trivalent chromium complexes on glucose uptake by epididymal fat tissue of rats, J. Biol. Chem. 236, 318–322 (1961).