HAL Id: hal-01639157
https://hal.archives-ouvertes.fr/hal-01639157
Submitted on 20 Nov 2017
HAL is a multi-disciplinary open access
archive for the deposit and dissemination of
sci-entific research documents, whether they are
pub-lished or not. The documents may come from
teaching and research institutions in France or
abroad, or from public or private research centers.
L’archive ouverte pluridisciplinaire HAL, est
destinée au dépôt et à la diffusion de documents
scientifiques de niveau recherche, publiés ou non,
émanant des établissements d’enseignement et de
recherche français ou étrangers, des laboratoires
publics ou privés.
The skyrmion switch: turning magnetic skyrmion
bubbles on and off with an electric field
Marine Schott, Anne Bernand-Mantel, Laurent Ranno, Stefania Pizzini, Jan
Vogel, Hélène Béa, Claire Baraduc, Stéphane Auffret, Gilles Gaudin,
Dominique Givord
To cite this version:
Marine Schott, Anne Bernand-Mantel, Laurent Ranno, Stefania Pizzini, Jan Vogel, et al.. The
skyrmion switch: turning magnetic skyrmion bubbles on and off with an electric field. Nano
Let-ters, American Chemical Society, 2017, 17 (5), pp.3006-3012. �10.1021/acs.nanolett.7b00328�.
�hal-01639157�
The skyrmion switch: turning magnetic skyrmion
bubbles on and off with an electric field
Marine Schott
1,2,3,4, Anne Bernand-Mantel
1,2*, Laurent Ranno
1,2, Stéfania Pizzini
1,2, Jan
Vogel
1,2, Hélène Béa
1,3,4, Claire Baraduc
1,3,4, Stéphane Auffret
1,3,4, Gilles Gaudin
1,3,4and
Dominique Givord
1,21
Univ. Grenoble Alpes, F-38000 Grenoble, France
2CNRS, Inst. NEEL, F-38000 Grenoble, France
3CNRS, SPINTEC, F-38000 Grenoble, France
4CEA, INAC-SPINTEC, F-38000 Grenoble, France
*anne.bernand-mantel@neel.cnrs.fr
Nanoscale magnetic skyrmions are considered as potential information carriers for future spintronics memory and logic devices. Such applications will require the control of their local creation and annihilation, which involves so far solutions that are either energy consuming or difficult to integrate. Here we demonstrate the control of skyrmion bubbles nucleation and annihilation using electric field gating, an easily integrable and potentially energetically efficient solution. We present a detailed stability diagram of the skyrmion bubbles in a Pt/Co/oxide trilayer and show that their stability can be controlled via an applied electric field. An analytical bubble model, with the Dzyaloshinskii-Moriya interaction imbedded in the domain wall energy, account for the observed electrical skyrmion switching effect. This allows us to unveil the origin of the electrical control of skyrmions stability and to show that both magnetic dipolar interaction and the Dzyaloshinskii-Moriya interaction play an important role in the skyrmion bubble stabilization. Keywords : room temperature, magnetic switching, skyrmions, electric field, thin films, spintronics, perpendicular magnetic anisotropy
Magnetic skyrmions are swirling spin textures with nanoscale dimensions and a non-trivial topology. They were studied theoretically more than two decades ago1,2 and observed at low temperature in the
form of hexagonal lattices in non-centrosymmetric crystals3,4 and magnetic multilayers5,6. Recently
several groups have reported the observation of magnetic skyrmions at room temperature (RT) in conventional transition-metal-based magnetic multilayers7–14. In some systems, the skyrmions present relatively large dimensions (~1 μm) and are called ‘skyrmion bubbles’. While classical bubbles are
stabilized by the magnetic dipolar energy, a skyrmion bubble is stabilized by both dipolar and Dzyaloshinskii-Moriya interaction (DMI) energies. A second difference between classical bubbles and skyrmionic bubbles is their homo-chirality which allows their current driven motion via spin-orbit torques7,9,13,14. This discovery has triggered a growing interest for the use of magnetic skyrmions as
building blocks for memories15–21 which is reminiscent of the extensive research on magnetic bubble memories in the 1970s22. Such applications will require creating, deleting and moving skyrmions. The
recent observation of current induced displacement of skyrmion bubbles using relatively low current densities reported at RT9,13,14,23 is very promising. The creation and annihilation of skyrmions have been
addressed theoretically17,24,25 and experimentally6,26–28 by different techniques such as spin transfer
torque6,17,25, heat24,28 and strain27. However, those techniques are either energy consuming or difficult
to integrate in functional devices. In analogy to what has been developed to switch small ferromagnetic elements29, the use of electric field gating to manipulate skyrmions offers several advantages: the low
power consumption, the possibility to act locally and an easy integration. Furthermore, a major issue of current induced nucleation, namely, unwanted current displacement of skyrmions during the writing process, is naturally absent using electric field writing. Those advantages have motivated some theoretical works concerning the electric control of skyrmions20,30–32. The only experimental attempt for
skyrmion electrical switching has been carried out in an epitaxial material and at low temperature26. In
this letter, we report on the observation of thermally activated nucleation and annihilation of magnetic skyrmion bubbles at RT and we demonstrate the possibility to electrically switch them on and off under a constant biasing magnetic field.
We have selected for this study a 𝑃𝑡/𝐶𝑜/𝑜𝑥𝑖𝑑𝑒 trilayer system where large DMI energy values have been reported33–36. In addition, we have chosen thicknesses for which the 𝐶𝑜 layer is close to the ferromagnetic-paramagnetic transition at RT, as enhanced electric field effects have been observed in this conditions37. The 𝐶𝑜 layer presents a slight thickness gradient (2%/mm) created by the oxidation of
a wedge shaped 𝐴𝑙 top layer (see Figure 1b). A high-k 𝐻𝑓𝑂2 dielectric layer and a transparent top Indium
Tin oxide (𝐼𝑇𝑂) electrode have been deposited on top of the 𝑃𝑡/𝐶𝑜/𝑜𝑥𝑖𝑑𝑒 trilayer, allowing magnetic characterization using magneto-optical Kerr effect under applied electric fields.
The magnetic domains are imaged at RT using a Kerr microscope in polar geometry. At low magnetic field a spontaneously demagnetized labyrinthine state is observed (Figure 1a). The formation of labyrinthine domains is the consequence of a balance between competing energies: the magnetic
dipolar energy and the domain wall (DW) energy. A variation of the labyrinthine domain width 𝐿 is observed along the wedge direction (Figure 1c). To understand this variation we have used an analytical model38,39 describing for ultrathin films the labyrinthine domain width 𝐿 = 𝛼. 𝑡. exp(𝜋𝐿
0/𝑡) as
function of the magnetic film thickness 𝑡, the characteristic dipolar length 𝐿0= 𝜎𝑊/𝜇0. 𝑀𝑠2, the saturation
magnetization 𝑀𝑆, the DW energy 𝜎𝑊 and 𝛼 a numerical constant (see Methods). The experimental
value of the DW energy 𝜎𝑊 can be calculated from this equation with the measured values of 𝐿, t and
𝑀𝑆 (see supplementary S1-S3). At position 𝑝0, 𝐿 = 2.9 μm, 𝑡 = 0.47 nm, 𝑀𝑆= 0.93 MA/m and we find
𝜎𝑊 = 1.44 mJ/m². This value can be compared to the classical Bloch wall energy 𝜎𝑤𝐵𝑙𝑜𝑐ℎ = 4√𝐴𝑒𝑥𝐾𝑒𝑓𝑓.
Using the experimental effective anisotropy value 𝐾𝑒𝑓𝑓= 0.30 MJ/m3 (see supplementary S4) and an
exchange constant 𝐴𝑒𝑥 in the 5 − 15 pJ/m range we find 𝜎𝑤𝐵𝑙𝑜𝑐ℎ = 5 − 8 mJ/m² which is much larger
than the experimental DW energy. The deviation from the Bloch formula can be explained by the presence of interfacial DMI in the trilayer which reduces 𝜎𝑊 according to the expression13,40: 𝜎𝑊 =
4√𝐴𝑒𝑥𝐾𝑒𝑓𝑓− 𝜋𝐷 where D is the DMI energy in mJ/m². We deduce a DMI term 𝐷 = 1 − 2 mJ/m² which
is consistent with the values obtained in similar 𝑃𝑡/𝐶𝑜/𝑜𝑥𝑖𝑑𝑒 trilayers 33–36. The low DW energy in our
system is at the origin of the observed spontaneous demagnetization of the layer at RT on a few second timescale. This thermally activated demagnetization is due to a combination of spontaneous nucleation of magnetic domains and thermally activated motion of domain walls under zero applied magnetic field
(see supplementary S5). Such thermal movement of labyrinthine magnetic domains has been reported previously in ultrathin films where the DW energy was lowered by the proximity of the spin reorientation transition41,42. This DW mobility, in combination with the high nucleation rate, allows reaching an
equilibrium demagnetized state in a few seconds in the major part of the image of Figure 1a (between 𝑝0 and 𝑝3). Above 𝑝0, the demagnetized state starts to deviate from the equilibrium one and we decided
not to extract the domain width in this region. We now discuss the origin of the decrease by a factor of 3 of the domain width 𝐿 along the wedge (Figure 1c). The 𝐶𝑜 thickness (𝑡) variation is of the order of 1% along the considered region and its effect on 𝐿 in the expression 𝐿 = 𝛼. 𝑡. 𝑒𝑥𝑝(𝜋𝜎𝑊
𝜇0.𝑀𝑠2/𝑡) is negligible.
However, as 𝑡 decreases, a reduction of 𝑀𝑠 by 8.4% is observed between 𝑝0 and 𝑝3 due to a variation
of 𝑇𝐶 with 𝑡 and the proximity of 𝑇𝐶 at the observation temperature43 (see supplementary S2). According
to its analytical expression, the domain width 𝐿 should increase when 𝑀𝑠, and thus the magnetic dipolar
energy, decreases. However, the opposite is observed in Figure 1c. We deduce that a strong decrease of the DW energy 𝜎𝑊, over-compensating the 𝑀𝑆 variation is at the origin of the decrease of 𝐿. If we
assume a constant DMI energy term, the variation of the DW energy 𝜎𝑊= 4√𝐴𝑒𝑥𝐾𝑒𝑓𝑓− 𝜋𝐷 must be
related to 𝐴𝑒𝑥 and 𝐾𝑒𝑓𝑓 variations. This is confirmed by our experimental observations: a reduction of
𝐾𝑒𝑓𝑓 with 𝑡 is measured (see supplementary S3) and a diminution of 𝐴𝑒𝑥 is expected from the 𝑀𝑆
decrease with 𝑡44,45.
When a perpendicular magnetic field larger than 0.1 mT is applied, micron-sized bubbles appear (Figure 1a). This transition from a labyrinthine pattern into a bubble lattice with applied magnetic field is unusual for a classical bubble system. In the classical case the magnetic domains would shrink in width and length but the number of magnetic objects would remain constant38, leaving very few bubbles. This
situation is observed on the right side of the image in Figure 1a. As we go from right to left, the increasing density of bubbles domains indicates the presence of thermally activated nucleation. This thermally activated process is promoted by the reduction of the DW energy 𝜎𝑤, due to the presence of DMI. This
implies a skyrmionic nature of the nucleated bubbles, which is confirmed by the observation of their unidirectional motion against electron flow, as expected for this system (see supplementary S6). As the nucleation of a skyrmion bubble by coherent rotation of a 1 µm domain is too high in energy (𝐾𝑉 > 104𝑘𝐵𝑇293𝐾) the mechanism for the observed skyrmion bubbles creation has to involve expansion from
a nanoscale skyrmion. We can estimate the nucleation energy of a skyrmion bubble when its diameter is reduced to the DW width 𝛿𝑤 by 𝜎𝑤. 𝑡. 2. 𝜋. 𝛿𝑤~10𝑘𝐵𝑇293𝐾. Following a Néel Brown model, the RT
nucleation rate of such skyrmion bubbles is high (~0.5 MHz for 𝜏0= 0.1 𝑛s). To estimate whether the
nucleated skyrmion bubble is expected to annihilate or to grow and reach its equilibrium diameter, we have calculated analytically the energy of an isolated skyrmion bubble using a “thin wall” model which is valid for negligible DW width (𝛿𝑤~10 nm in our case) compared to the bubble diameter (few 𝜇𝑚) (see
Methods). The skyrmion bubble energy 𝐸𝑠𝑏(𝑡, 𝑀𝑠, 𝜎𝑤) is the sum of DW, Zeeman and dipolar terms. The
energy of an individual bubble relative to the saturated state can be written as: ∆𝐸𝑠𝑏(𝑅, 𝑡, 𝑀𝑠, 𝜎𝑤) = 𝜎𝑤. 𝑡. 2. 𝜋. 𝑅 + 2𝜇0𝑀𝑠. 𝐻. 𝑡. 𝜋. 𝑅2− 𝜇0𝑀𝑠2. 𝜋. 𝑡3. 𝐼(𝑑)
where 𝜎𝑤 is the DW energy, 𝑡 the layer thickness, 𝑅 the bubble radius, 𝑀𝑠 the saturation magnetization,
𝜇0𝐻 the applied magnetic field, and 𝐼(𝑑) the stray field energy gain where 𝑑 = 2𝑅/𝑡 (see Methods). The
skyrmion bubble energy ∆𝐸𝑠𝑏 versus the bubble diameter (Figure 2.g), obtained using the experimental
𝑡, 𝑀𝑠 and 𝜎𝑤 parameters at positon 𝑝1, presents two local extrema. The existence of a local energy
skyrmion bubbles. To reach this equilibrium diameter, a nucleated nanoscale skyrmion will have to grow and overcome a nucleation energy barrier 𝐸𝑛, which corresponds to the local maximum. We define the
annihilation energy barrier 𝐸𝑎 as the difference between the local maximum and minimum (see Figure
2.g), assuming that the lower energy path for annihilation is the compression46–49. The calculated
nucleation and annihilation energies are shown in Figure 1d,e. For this calculation, we have used the 𝑀𝑠, 𝑡 and 𝜎𝑊 values and their variations along the wedge estimated experimentally using a combination
of magneto-optical Kerr and VSM-SQUID magnetometry (see supplementary S1-S3). As our characterization setup was adapted to study the 100 ms to few s timescale, we draw as a guide to the eye, a white line indicating the RT thermal activation frontier, 𝐸/𝑘𝐵𝑇293𝐾= 23 (value at witch nucleation
events are occurring at a rate > 1 Hz). The analytical skyrmion bubble model reproduces several features observed in Figure 1a. In Figure 1d, for a constant magnetic field, the increase of the nucleation barrier 𝐸𝑛 with the DW energy explains the decrease in the bubble density observed in Figure 1a as the
𝐶𝑜 gets thicker. In the zone indicated by the number 2 in Figure 1d, skyrmion bubbles are observed despite the increase of 𝐸𝑛 above the thermal activation frontier. Those skyrmion bubbles are metastable
skyrmions bubbles nucleated at lower magnetic field or stabilized by local magnetic inhomogeneities, which might locally lower the nucleation barrier. In the position indicated by the number 1 in Figure 1d,e, both nucleation and annihilation are expected with a rate > 1 Hz. This thermal instability of the skyrmion bubbles is observed in a time dependent measurement (see supplementary S7). On the contrary, the skyrmion bubbles present a high thermal stability (𝐸𝑎/𝑘𝑇 > 23) in a large part of the
diagram, below the white line in Figure 1e. In this region, no annihilation of skyrmion bubbles are observed from a few minutes and up to much longer timescales. The position 𝑝1 near this white line has
been selected for the observation of skyrmion bubbles under electric field.
The behavior of skyrmion bubbles under electric field gating is studied through a transparent 𝐼𝑇𝑂 electrode (see Figure1b). Polar Kerr images recorded for different applied electric fields are presented in Fig 2 a-c. A distribution of bubble diameters due to the presence of local inhomogeneities and pinning sites is observed at fixed electric field. The variation of skyrmion bubbles density with the electric field has been characterized by image processing (see Figure 2f). To explain the observed behavior, the analytical skyrmion bubble model described previously is used. The 𝑡, 𝑀𝑠 and 𝜎𝑤 parameters and their
variations with the electric field, used as an input for the simulation, are determined experimentally (see supplementary S3 and S8). When the voltage is switched from -5 V to +5 V, 𝑀𝑠 and 𝜎𝑤 vary by
respectively +0.1 MA/m and +0.32 mJ/m². These experimental parameters are used in the simulation in Figure 2g where the energy difference between a ferromagnetic state and an isolated bubble is plotted as a function of the bubble diameter. The observed decrease in the skyrmion bubbles number with increasing electric field is consistent with the increase in the nucleation energy barrier 𝐸𝑛 combined with
a decrease of the annihilation energy barrier 𝐸𝑎 obtained in the simulation. In Figure 2 d,e differential
images are shown where the blue/red bubbles correspond to bubbles which have appeared/disappeared. In Figure 2d, both blue and red bubbles are observed. This is explained by a domination of nucleation processes as 𝐸𝑛≤ 23 𝑘𝐵𝑇293𝐾 and 𝐸𝑎≥ 23 𝑘𝐵𝑇293𝐾 in the -5 V to 0 V range
(Figure 2g). The observation of both blue and ref bubbles in that voltage range is a consequence of the displacement of existing bubbles due to a continuous nucleation of bubbles. On the contrary the 0 𝑉 to +5 𝑉 range is dominated by annihilation processes with 𝐸𝑎≤ 23 𝑘𝐵𝑇293𝐾 and 𝐸𝑛≥ 23 𝑘𝐵𝑇293𝐾 as
confirmed by a large majority of red bubbles in Figure 2e.
Now that the electric field control of skyrmion bubble density is demonstrated, we carry out the proof of concept of an electrical skyrmion switch by turning the electric field to higher voltages. In Figure 3a-b, we show the electric field switching from a state with a very high skyrmion bubbles density to a state with no skyrmion bubbles. This electric switching of skyrmion bubbles is reversible and reproducible sequentially as we can see in Figure 3d where the average Kerr intensity is recorded below the electrode as function of time while the voltage is switched between +/-20 V (see supplementary S9). To understand the origin of this switching effect, polar Kerr hysteresis loops with in plane applied magnetic field have been measured to estimate the variation of 𝑀𝑆 and 𝐾𝑒𝑓𝑓 under electric field (see
supplementary S8). When the voltage varies from +20 V to -20 V, 𝑀𝑆 and 𝐾𝑒𝑓𝑓 are modified respectively
by -47% and -64%. We deduce from 𝐾𝑒𝑓𝑓= 𝐾𝑠/𝑡 − 1/2𝜇0𝑀𝑆2 a 𝐾𝑠 variation ∆𝐾𝑠/∆𝐸 = 830 fJ/V/m. The
electric field variations of the magnetic properties is most likely due to a modification of the electron density of state in the 𝐶𝑜 and enhanced by the proximity of 𝑇𝐶 as observed in previous works on
𝑃𝑡/𝐶𝑜/𝑜𝑥𝑖𝑑𝑒 in the ultrathin regime37. A variation of 𝐷 with electric field may also occur in our experiment
as predicted theoretically50. It is possible to extract D from the expression 𝜎
𝑊= 4√𝐴𝑒𝑥𝐾𝑒𝑓𝑓− 𝜋𝐷 using
the experimental values of 𝐾𝑒𝑓𝑓 and 𝜎𝑊. However, as 𝑀𝑠 is varying with the electric field (due to the
variation of 𝑇𝐶) the exchange constant 𝐴𝑒𝑥 is also expected to vary and the detailed analysis necessary
to separate the D variation from Aex is beyond the scope of this study. The variation of the skyrmion
electric field and a DW energy variation adjusted to fit the observed skyrmion bubble nucleation/annihilation rates (see supplementary S10). For positive voltage, skyrmion bubbles vanish due to a strong increase of the nucleation energy 𝐸𝑛 combined with a decrease of the annihilation barrier:
nucleation is prevented and annihilation of bubbles is thermally activated. On the contrary, for a negative electric field, the nucleation energy 𝐸𝑛 is strongly reduced whereas 𝐸𝑎 becomes very large, thus favoring
the creation of stable skyrmion bubbles. Consequently, the electric field can be used similarly to an applied magnetic field to switch skyrmion bubbles on and off by modifying the skyrmion stability. In our system the observed switch effect is associated to strong electric field variations of 𝑀𝑠 and 𝜎𝑊 only
expected near 𝑇𝐶. However, the variation of 𝑀𝑠 and 𝜎𝑊 have opposite effects: an increase of 𝑀𝑠/𝜎𝑊 is
decreasing/increasing 𝐸𝑛. Consequently, the skyrmion switch effect should be much more efficient at
fixed 𝑀𝑠. To check this we calculated in Figure 3f the skyrmion bubble energy in the case of a thicker
𝐶𝑜 layer of 0.6 nm, which is expected to show negligible 𝑀𝑆 variation with electric field (higher 𝑇𝐶) but a
significant 𝐾𝑒𝑓𝑓 change51. We see that the skyrmion switch effect (i.e. reducing the nucleation barrier
and increasing the annihilation barrier) can be efficient at fixed 𝑀𝑠 with a 𝜎𝑊 variation as small as 5%.
In this case, the skyrmion bubbles are scaled down to a few 100 nm of diameter. Below this size, our thin wall analytical model is no more valid and further simulations are necessary to study the skyrmion swich effect on a nanometer sized skyrmion in a confined geometry.
In conclusion, we have reported the presence at RT of micron sized skyrmion bubbles in a 𝑃𝑡/𝐶𝑜/𝑜𝑥𝑖𝑑𝑒 trilayer. The DMI strength, which is of the order of 1-2 mJ/m², reduces the DW energy by a factor of ~5 with respect to the classical Bloch case and enables the stabilization of skyrmion bubbles. The observed skyrmion bubbles density variation along the wedge and versus electric field is well described by an analytical isolated bubble model. We demonstrate the efficient and reproducible electric field writing and deleting of skyrmion bubbles. These results constitute a potentially important milestone towards the use of skyrmions for memory or logic devices.
Methods
Sample preparation
The 𝑃𝑡(3 nm)/𝐶𝑜 (0.6 nm)/𝐴𝑙 0.76 nm to 𝐴𝑙 1.76 nm film was deposited by magnetron sputtering on a Si wafer with a 500 nm thick thermal 𝑆𝑖𝑂2 top layer. The 𝐴𝑙 layer was oxidized in-situ by a 𝑂2 plasma.
A ~90 nm 𝐻𝑓𝑂2 layer is deposited ex-situ by Atomic Layer Deposition. Indium Tin oxide electrodes
deposited by sputtering was patterned by lift-off in the form of 50 × 800 μm rectangles.
Analytical model of the labyrinthine domains width
The theoretical labyrinthine domain width 𝐿 has been calculated using a parallel band domains model in the case where the DW width is negligible compared to the domain diameter. For ultra-thin films, when the thickness is much smaller than the characteristic dipolar length39,52 : 𝑡 ≪ 𝐿
0 with 𝐿0=
𝜎𝑊/𝜇0. 𝑀𝑠2 where 𝑀𝑆 is the saturation magnetization and 𝜎𝑊 the domain wall energy, the domain width
𝐿 can be written as 𝐿 = 𝛼. 𝑡. exp(𝜋𝐿0/𝑡) where 𝑡 is the magnetic film thickness and 𝛼 a constant 𝛼 =
exp (𝜋𝑏
2 + 1)~0.955 where 𝑏 is the numerical evaluation of a series
39. Using this expression we obtain
the domain wall energy 𝜎𝑊 = ln (𝐿/(𝛼. 𝑡)). 𝜇0. 𝑀𝑠2.t/ 𝜋.
Analytical “thin wall” bubble model
We have used an analytical formula to approximate the energy of an individual bubble of radius 𝑅 relative to the saturated state22,53. The model used here is valid for 𝑄 = 𝐾
𝑢/𝐾𝑑> 1, where 𝐾𝑢 is the uniaxial
(surface) out of plane anisotropy and 𝐾𝑑 the magnetic dipolar energy. In our case we have 𝑄 =
0.83/0.54 = 1.53. It was shown that this standard theory is well applicable for 𝑄 > 1.5. The energy of an individual bubble relative to the saturated state can be written as:
∆𝐸𝑠𝑏 = 𝜎𝑤. 𝑡. 2. 𝜋. 𝑅 + 2𝜇0𝑀𝑠. 𝐻. 𝑡. 𝜋. 𝑅2− 𝜇0𝑀𝑠2. 𝜋. 𝑡3. 𝐼(𝑑)
where 𝜎𝑤 is the DW energy, 𝑡 the layer thickness, 𝑅 the bubble radius, 𝑀𝑠 the saturation magnetisation,
𝜇0𝐻 the applied magnetic field, and 𝐼(𝑑) defined as follow:
𝐼(𝑑) = − 2 3𝜋𝑑[𝑑
2+ (1 − 𝑑2)𝐸(𝑢2)/𝑢 − 𝐾(𝑢2)/𝑢]
where 𝑑 = 2𝑅/𝑡, 𝑢2= 𝑑2/(1 + 𝑑²) and 𝐸(𝑢) and 𝐾(𝑢) are elliptic integrals defined as:
𝐸(𝑢) = ∫0𝜋/2√1 − 𝑢. sin ²(𝛼)𝑑𝛼 and 𝐾(𝑢) = ∫0𝜋/2𝑑𝛼/√1 − 𝑢. sin ²(𝛼)
Acknowledgement
This work was supported by the French National Research Agency (ANR) under the project ELECSPIN ANR-16-CE24-0018
.
We acknowledge the support from the Nanofab facility and the pôles magnetometrie and ingénierie experimentale from Institut Néel. We thank L. Cagnon for ALD deposition.The authors thanks A. Thiaville, O. Fruchard, M. Chshiev, O. Boulle, I. M. Miron, N. Reyren, V. Cros, A. N. Bogdanov and B. A. Ivanov for fruitful discussions.
Supporting information
Sample characterisation. Current induced skyrmion bubbles motion. Real time room temperature spontaneous nucleation and annihilation of skyrmion bubbles. Sample characterisation under electric field. Switching of skyrmion bubbles with electric field. Estimation of the electric field variation of the domain wall energy using the isolated bubble model.
Competing financial interests
The authors declare no competing financial interests.
Corresponding author
Correspondence to: anne.bernand-mantel@neel.cnrs.fr
References
(1) Bogdanov, A. N.; Yablonskii, D. Thermodynamically Stable “vortices” in Magnetically Ordered Crystals. the Mixed State of Magnets. J. Exp. Theor. Phys. 1989, 95, 178.
(2) Ivanov, B. a.; Stephanovich, V. a.; Zhmudskii, A. a. Magnetic Vortices : The Microscopic Analogs of Magnetic Bubbles. J. Magn. Magn. Mater. 1990, 88, 116–120.
(3) Muhlbauer, S. Skyrmion Lattice in a Chiral Magnet. Science (80-. ). 2009, 323, 915–919. (4) Yu, X. Z.; Onose, Y.; Kanazawa, N.; Park, J. H.; Han, J. H.; Matsui, Y.; Nagaosa, N.; Tokura,
Y. Real-Space Observation of a Two-Dimensional Skyrmion Crystal. Nature 2010, 465, 901– 904.
(5) Heinze, S. Spontaneous Atomic-Scale Magnetic Skyrmion Lattice in Two Dimensions. Nat. Phys. 2011, 7, 713–718.
(6) Romming, N.; Hanneken, C.; Menzel, M.; Bickel, J. E.; Wolter, B.; von Bergmann, K.;
Kubetzka, A.; Wiesendanger, R. Writing and Deleting Single Magnetic Skyrmions. Science (80-. )(80-. 2013, 341, 636–639(80-.
(7) Buttner, F.; Moutafis, C.; Schneider, M.; Kruger, B.; Gunther, C. M.; Geilhufe, J.; Schmising, C. v. K.; Mohanty, J.; Pfau, B.; Schaffert, S.; et al. Dynamics and Inertia of Skyrmionic Spin Structures. Nat Phys 2015, 11, 225–228.
(8) Chen, G.; Mascaraque, A.; N’Diaye, A. T.; Schmid, A. K. Room Temperature Skyrmion Ground State Stabilized through Interlayer Exchange Coupling. Appl. Phys. Lett. 2015, 106, 242404. (9) Jiang, W.; Upadhyaya, P.; Zhang, W.; Yu, G.; Jungfleisch, M. B.; Fradin, F. Y.; Pearson, J. E.;
Tserkovnyak, Y.; Wang, K. L.; Heinonen, O.; et al. Blowing Magnetic Skyrmion Bubbles. Science (80-. ). 2015, 349, 283–286.
(10) Moon, K.-W.; Kim, D.-H.; Yoo, S.-C.; Je, S.-G.; Chun, B. S.; Kim, W.; Min, B.-C.; Hwang, C.; Choe, S.-B. Magnetic Bubblecade Memory Based on Chiral Domain Walls. Sci. Rep. 2015, 5, 9166.
(11) Boulle, O.; Vogel, J.; Yang, H.; Pizzini, S.; de Souza Chaves, D.; Locatelli, A.; Mente\AAŸ, T. O.; Sala, A.; Buda-Prejbeanu, L. D.; Klein, O.; et al. Room-Temperature Chiral Magnetic Skyrmions in Ultrathin Magnetic Nanostructures. Nat Nano 2016, 11, 449–454.
(12) Moreau-Luchaire, C.; Mouta"i¬•s, C.; Reyren, N.; Sampaio, J.; Vaz, C. A. F.; Van Horne, N.; Bouzehouane, K.; Garcia, K.; Deranlot, C.; Warnicke, P.; et al. Additive Interfacial Chiral Interaction in Multilayers for Stabilization of Small Individual Skyrmions at Room Temperature. Nat Nano 2016, 11, 444–448.
(13) Woo, S.; Litzius, K.; Kruger, B.; Im, M.-Y.; Caretta, L.; Richter, K.; Mann, M.; Krone, A.; Reeve, R. M.; Weigand, M.; et al. Observation of Room-Temperature Magnetic Skyrmions and Their Current-Driven Dynamics in Ultrathin Metallic Ferromagnets. Nat Mater 2016, 15, 501–506. (14) Yu, G.; Upadhyaya, P.; Li, X.; Li, W.; Kim, S. K.; Fan, Y.; Wong, K. L.; Tserkovnyak, Y.; Amiri,
P. K.; Wang, K. L. Room-Temperature Creation and Spin–Orbit Torque Manipulation of Skyrmions in Thin Films with Engineered Asymmetry. Nano Lett. 2016, 16, 1981–1988. (15) Kiselev, N. S.; Bogdanov, A. N.; Schäfer, R.; Rößler, U. K. Chiral Skyrmions in Thin Magnetic
Films: New Objects for Magnetic Storage Technologies? J. Phys. D. Appl. Phys. 2011, 44, 392001+.
(16) Fert, A.; Cros, V.; Sampaio, J. Skyrmions on the Track. Nat. Nanotech. 2013, 8, 152–156. (17) Sampaio, J.; Cros, V.; Rohart, S.; Thiaville, A.; Fert, A. Nucleation, Stability and
Current-Induced Motion of Isolated Magnetic Skyrmions in Nanostructures. Nat. Nanotech. 2013, 8, 839–844.
(18) Zhang, X. Skyrmion-Skyrmion and Skyrmion-Edge Repulsions in Skyrmion-Based Racetrack Memory. Sci. Rep. 2015, 5, 7643.
(19) Zhang, X.; Ezawa, M.; Zhou, Y. Magnetic Skyrmion Logic Gates: Conversion, Duplication and Merging of Skyrmions. Sci. Rep. 2015, 5, 9400+.
(20) Kang, W.; Huang, Y.; Zheng, C.; Lv, W.; Lei, N.; Zhang, Y.; Zhang, X.; Zhou, Y.; Zhao, W. Voltage Controlled Magnetic Skyrmion Motion for Racetrack Memory. Sci. Rep. 2016, 6, 23164.
(21) Wiesendanger, R. Nanoscale Magnetic Skyrmions in Metallic Films and Multilayers: A New Twist for Spintronics. Nat. Rev. Mater. 2016, 1, 16044.
(22) A.H. Bobeck. Properties and Device Applications of Magnetic Domains in Orthoferrites. Bell Syst. Tech. J. 1967, 46, 1901.
(23) Yu, X. Z.; Kanazawa, N.; Zhang, W. Z.; Nagai, T.; Hara, T.; Kimoto, K.; Matsui, Y.; Onose, Y.; Tokura, Y. Skyrmion Flow near Room Temperature in an Ultralow Current Density. Nat. Commun. 2012, 3, 988.
(24) Koshibae, W.; Nagaosa, N. Creation of Skyrmions and Antiskyrmions by Local Heating. Nat. Commun. 2014, 5, 5148.
(25) Zhou, Y.; Iacocca, E.; Awad, A. A.; Dumas, R. K.; Zhang, F. C.; Braun, H. B.; Åkerman, J. Dynamically Stabilized Magnetic Skyrmions. Nat. Commun. 2015, 6, 8193.
(26) Hsu, P.-J.; Kubetzka, A.; Finco, A.; Romming, N.; von Bergmann, K.; Wiesendanger, R.
Electric-Field-Driven Switching of Individual Magnetic Skyrmions. Nat Nano 2016, 12, 123–126. (27) Nii, Y.; Nakajima, T.; Kikkawa, A.; Yamasaki, Y.; Ohishi, K.; Suzuki, J.; Taguchi, Y.; Arima, T.;
Tokura, Y.; Iwasa, Y. Uniaxial Stress Control of Skyrmion Phase. Nat. Commun. 2015, 6, 8539. (28) Finazzi, M.; Savoini, M.; Khorsand, A. R.; Tsukamoto, A.; Itoh, A.; Duò, L.; Kirilyuk, A.; Rasing,
T.; Ezawa, M. Laser-Induced Magnetic Nanostructures with Tunable Topological Properties. Phys. Rev. Lett. 2013, 110, 177205.
(29) Wang, W. G.; Chien, C. L. Voltage-Induced Switching in Magnetic Tunnel Junctions with Perpendicular Magnetic Anisotropy. J. Phys. D. Appl. Phys. 2013, 46, 74004.
(30) Fook, H. T.; Gan, W. L.; Lew, W. S. Gateable Skyrmion Transport via Field-Induced Potential Barrier Modulation. Sci. Rep. 2016, 6, 21099.
(31) Upadhyaya, P.; Yu, G.; Amiri, P. K.; Wang, K. L. Electric-Field Guiding of Magnetic Skyrmions. Phys. Rev. B 2015, 92, 134411.
in Magnetic Nanodisks. Appl. Phys. Lett. 2016, 108, 152403.
(33) Pizzini, S.; Vogel, J.; Rohart, S.; Buda-Prejbeanu, L. D.; Jué, E.; Boulle, O.; Miron, I. M.; Safeer, C. K.; Auffret, S.; Gaudin, G.; et al. Chirality-Induced Asymmetric Magnetic Nucleation in Pt/Co/AlOx Ultrathin Microstructures. Phys. Rev. Lett. 2014, 113, 47203.
(34) Vaňatka, M.; Rojas-Sánchez, J.-C.; Vogel, J.; Bonfim, M.; Belmeguenai, M.; Roussigné, Y.; Stashkevich, A.; Thiaville, A.; Pizzini, S. Velocity Asymmetry of Dzyaloshinskii Domain Walls in the Creep and Flow Regimes. J. Phys. Condens. Matter 2015, 27, 326002.
(35) Tetienne, J.-P.; Hingant, T.; Martínez, L. J.; Rohart, S.; Thiaville, A.; Diez, L. H.; Garcia, K.; Adam, J.-P.; Kim, J.-V.; Roch, J.-F.; et al. The Nature of Domain Walls in Ultrathin
Ferromagnets Revealed by Scanning Nanomagnetometry. Nat. Commun. 2015, 6, 6733. (36) Belmeguenai, M.; Adam, J.-P.; Roussigné, Y.; Eimer, S.; Devolder, T.; Kim, J.-V.; Cherif, S. M.;
Stashkevich, A.; Thiaville, A. Interfacial Dzyaloshinskii-Moriya Interaction in Perpendicularly Magnetized Pt/Co/AlO Ultrathin Films Measured by Brillouin Light Spectroscopy. Phys. Rev. B
2015, 91, 1–4.
(37) Chiba, D.; Fukami, S.; Shimamura, K.; Ishiwata, N.; Kobayashi, K.; Ono, T. Electrical Control of the Ferromagnetic Phase Transition in Cobalt at Room Temperature. Nat. Mater. 2011, 10, 853.
(38) Hubert, A.; Schäfer, R. Magnetic Domains, The Analysis of Magnetic Microstructures; Hubert, A.; Schäfer, R., Eds.; Springer Berlin Heidelberg: Berlin, 1998.
(39) Kaplan, B.; Gehring, G. A. The Domain Structure in Ultrathin Magnetic Films. J. Magn. Magn. Mater. 1993, 128, 111.
(40) Heide, M.; Bihlmayer, G.; Blugel, S. Dzyaloshinskii-Moriya Interaction Accounting for the Orientation of Magnetic Domains in Ultrathin Films: Fe/W(110). Phys. Rev. B 2008, 78, 140403.
(41) Won, C.; Wu, Y. Z.; Choi, J.; Kim, W.; Scholl, A.; Doran, A.; Owens, T.; Wu, J.; Jin, X. F.; Zhao, H. W.; et al. Magnetic Stripe Melting at the Spin Reorientation Transition in Fe Ni Cu(001). Phys. Rev. B - Condens. Matter Mater. Phys. 2005, 71, 1–5.
(42) Bergeard, N.; Jamet, J. P.; Mougin, A.; Ferré, J.; Gierak, J.; Bourhis, E.; Stamps, R. Dynamic Fluctuations and Two-Dimensional Melting at the Spin Reorientation Transition. Phys. Rev. B - Condens. Matter Mater. Phys. 2012, 86, 1–5.
(43) Parakkat, V. M.; Ganesh, K. R.; Anil Kumar, P. S. Tailoring Curie Temperature and Magnetic Anisotropy in Ultrathin Pt/Co/Pt Films. AIP Adv. 2016, 6, 1–6.
(44) Eyrich, C.; Zamani, A.; Huttema, W.; Arora, M.; Harrison, D.; Rashidi, F.; Broun, D.; Heinrich, B.; Mryasov, O.; Ahlberg, M.; et al. Effects of Substitution on the Exchange Stiffness and Magnetization of Co Films. Phys. Rev. B - Condens. Matter Mater. Phys. 2014, 90, 1–12. (45) Moreno, R.; Evans, R. F. L.; Khmelevskyi, S.; Muñoz, M. C.; Chantrell, R. W.;
Chubykalo-Fesenko, O. Temperature-Dependent Exchange Stiffness and Domain Wall Width in Co. Phys. Rev. B 2016, 94, 104433.
(46) Bessarab, P. F.; Uzdin, V. M.; Jonsson, H. Method for Finding Mechanism and Activation Energy of Magnetic Transitions, Applied to Skyrmion and Antivortex Annihilation. Comput. Phys. Commun. 2015, 196, 335–347.
(47) Rohart, S.; Miltat, J.; Thiaville, A. Path to Collapse for an Isolated Neel Skyrmion. Phys. Rev. B - Condens. Matter Mater. Phys. 2016, 93, 1–6.
(48) Lobanov, I. S.; Jonsson, H.; Uzdin, V. M. Mechanism and Activation Energy of Magnetic Skyrmion Annihilation Obtained from Minimum Energy Path Calculations. Phys. Rev. B - Condens. Matter Mater. Phys. 2016, 94, 1–7.
(49) Cortés-Ortuño, D.; Wang, W.; Beg, M.; Pepper, R. A.; Bisotti, M.-A.; Carey, R.; Vousden, M.; Kluyver, T.; Hovorka, O.; Fangohr, H. Thermal Stability and Topological Protection of
Skyrmions in Nanotracks. arXiv 2016, 1611.07079.
(50) Yang, H.; Boulle, O.; Cros, V.; Fert, A.; Chshiev, M. Controlling Dzyaloshinskii-Moriya
Interaction via Chirality Dependent Layer Stacking, Insulator Capping and Electric Field. arXiv
2016, 1603.01847.
(51) Bernand-Mantel, A.; Herrera-Diez, L.; Ranno, L.; Pizzini, S.; Vogel, J.; Givord, D.; Auffret, S.; Boulle, O.; Miron, I. M.; Gaudin, G. Electric-Field Control of Domain Wall Nucleation and Pinning in a Metallic Ferromagnet. Appl. Phys. Lett. 2013, 102, 122406.
(52) Kooy, C.; Enz, U. Experimental and Theoretical Study of the Domain Configuration in Thin Layers of BaFeO. Phillips Res. Rept. 1960, 15, 7.
(53) Malozemoff, A. P.; Slonczewski, J. C. Magnetic Domain Walls in Bubble Materials; Academic Press: New York, 1979.
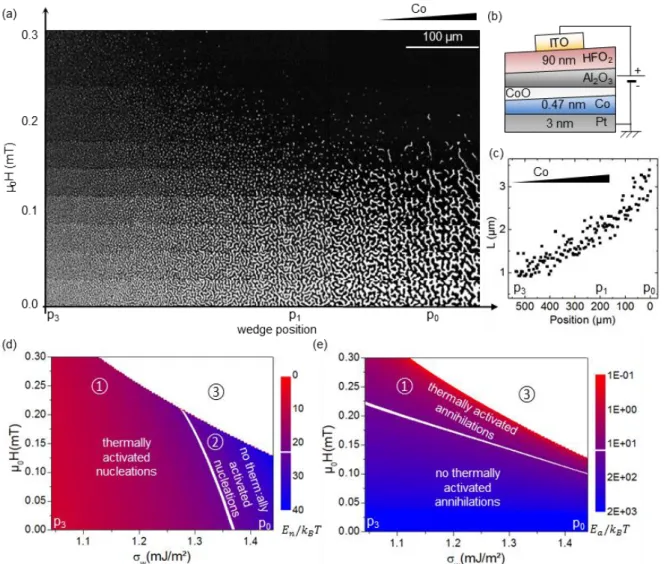
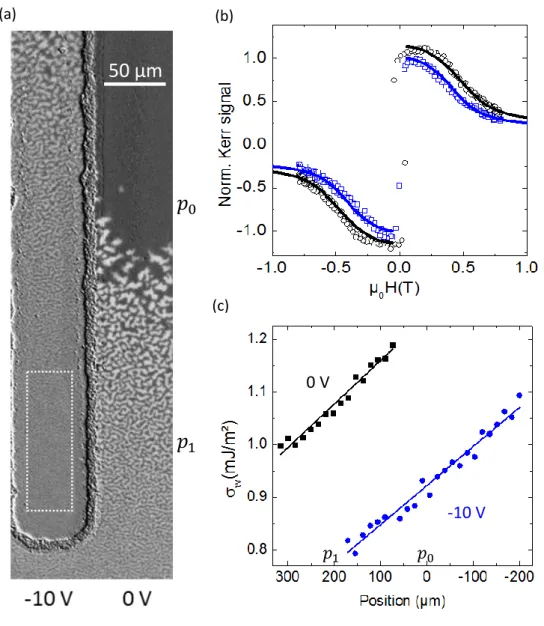
Figure 1: (a) Polar Kerr magnetic images of the labyrinthine and skyrmion bubble states in the
Pt/Co/oxide trilayer. The image is made of 10 images of 30 x 550 µm. Each image is recorded a few seconds after applying an out of plane magnetic field. The magnetic field was varied from 0 to 0.3 mT. The Co thickness increases from left to right. (b) Schematic representation of the device: the Pt/Co/oxide trilayer is covered by a 90 nm HfO2 layer and a top Indium Tin Oxide (ITO) electrode. The
Co thicknesses variation is of the order of 1% over the 500 µm wide observed region. (c) Characteristic domain width 𝐿 as function of the wedge position for zero applied magnetic field extracted by fast Fourier transform on polar Kerr images. (d) and (e) Skyrmion bubble nucleation (d) and annihilation energies (e) calculated with the isolated bubble model as function of out of plane magnetic field and DW energy using the 𝐻, 𝑡, 𝑀𝑠 and 𝜎𝑤 parameters estimated experimentally.
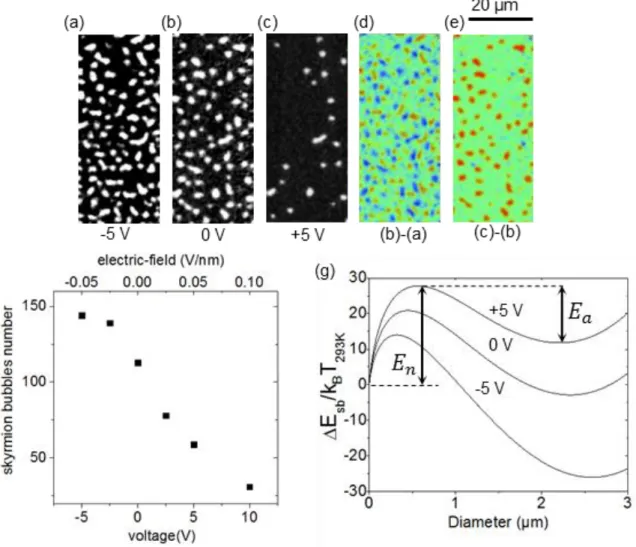
Figure 2: (a) to (c) Polar Kerr magnetic images of the electric field control of skyrmion bubbles density
in the Pt/Co/oxide trilayer under a static 0.15 mT perpendicular magnetic field, recorded through the transparent ITO electrode near position 𝑝1 with different applied voltages. The sample is first saturated
with a higher magnetic field, then the magnetic field is fixed to 0.15 mT and the electric field is varied from −5 V to +10 V. (d) and (e) Differential images obtained from (b)-(a)=(d) and (c)-(b)=(e). The blue/red bubbles correspond to objects which appeared/disappeared during the few seconds separating the images acquisitions. (f) Number of skyrmion bubbles extracted from images with twice the size of (a),(b) and (c). (g) Analytical calculation of the energy difference between a saturated state and a single isolated magnetic bubble as function of the bubble diameter with the parameters 𝑡 = 0.468 nm, 𝜇0𝐻 =
0.15 mT, 𝑀𝑠= 0.92+/-0.05 MA/m and 𝜎𝑤= 1.33+/-0.16 mJ/m² corresponding to respectively 0 V, +5 V
and −5 V. The nucleation 𝐸𝑛 and annihilation 𝐸𝑎 energies are indiczted for the +5 V case. The 𝑡, 𝐻, 𝑀𝑠
Figure 3: (a) and (b) Polar Kerr images of the electric field switching of skyrmion bubbles in the
Pt/Co/oxide trilayer under a static 0.15 mT perpendicular magnetic field recorded 2 s after applying respectively -20 V and +20 V . (c) and (b) Simulation of the skyrmion switch effect using an analytical isolated skyrmion bubble model with 𝑡 = 0.468 nm, 𝜇0𝐻 = 0.15 mT, 𝑀𝑠= 1.07 MA/m (+20V), 𝑀𝑠=
0.57 MA/m (-20V), 𝜎𝑤= 1.87 mJ/m² (+20V) and 𝜎𝑤= 0.45 mJ/m² (-20V). (e) Polar Kerr signal recorded
through the electrode as a function of time during a sequence of electric field switching from +20 V to -20 V repeated 10 times every 2 s. (f) Simulation of the skyrmion switch effect in the case of a thicker 𝐶𝑜 layer with the parameters 𝑡 = 0.6 nm, 𝜇0𝐻 = 0.9 mT, 𝑀𝑠= 1.3 MA/m , 𝜎𝑤= 2.72 mJ/m² (top) and
The skyrmion switch: turning magnetic skyrmion
bubbles on and off with an electric field
Marine Schott
1,2,3,4, Anne Bernand-Mantel
1,2*, Laurent Ranno
1,2, Stéfania Pizzini
1,2, Jan
Vogel
1,2, Hélène Béa
1,3,4, Claire Baraduc
1,3,4, Stéphane Auffret
1,3,4, Gilles Gaudin
1,3,4and
Dominique Givord
1,21
Univ. Grenoble Alpes, F-38000 Grenoble, France
2CNRS, Inst. NEEL, F-38000 Grenoble, France
3CNRS, SPINTEC, F-38000 Grenoble, France
4CEA, INAC-SPINTEC, F-38000 Grenoble, France
*anne.bernand-mantel@neel.cnrs.fr
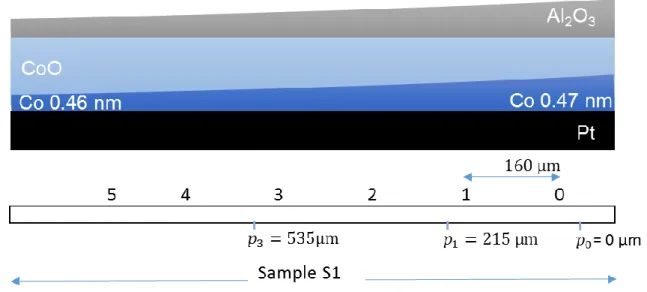
S1. VSM-SQUID magnetization measurements.
The 𝑃𝑡(3 nm)/𝐶𝑜 (0.6 nm)/𝐴𝑙 0.76 nm to 𝐴𝑙 1.76 nm + 𝑂2 plasma sample has been cut to carry out
VSM-SQUID measurements. The piece where the labyrinthine domains discussed in the paper appear is called sample A1 and has dimensions of ~1 mm × 4 mm. The A1 sample is represented schematically in Fig. S1 where the 𝑝0, 𝑝1, and 𝑝3 positons are the one indicated also in Fig. 1a. The magnetic moment
is measured with a Quantum Design MPMS 3 VSM-SQUID equipment. The sample A1 was measured 4 times at room temperature and we find 𝑀𝑠. 𝑡 = 4.2 ± 0.4 × 10⁻⁴ A/m.m. As a part of the 𝐶𝑜 has been
oxidized by 𝑂2 plasma in the sample A1, the 𝐶𝑜 thickness is lower than the initial thickness 𝑡 = 0.6 nm.
The temperature dependent magnetization measurements, carried out in the 100-360K temperature range, on a sample similar to A1, are presented in Fig. S2. Each point correspond to the remanent magnetisation extracted from a M(H) loop. A Curie temperature 𝑇𝐶 = 325 K is found using a combination
of two power laws :𝑀(𝑇/𝑇𝑐)/𝑀(0) = [1 − 𝑠(𝑇/𝑇𝑐)(3/2)− (1 − 𝑠)(𝑇/𝑇𝑐)(5/2)]1/3 with s=0.11 for Co1. An
𝑀𝑠 decrease of 38% between 0 K and 293 K is observed. This magnetization variation is used to define
the lower bound for the Co thickness: we assume that the 𝑀𝑠(0 K) cannot exceed the bulk Co value of
1.44 × 10⁶ A/m which gives 𝑀
𝑠(293K) < 0.89 × 10⁶ A/m. We deduce a lower bound for the thickness
𝑡 > 0.47 nm from the 𝑀𝑠. 𝑡 value.
To estimate the 𝑀𝑠 variation along the sample A1, local Kerr measurements were carried out every 160
µm. In Fig. S3b, we show the polar Kerr measurements with in plane applied magnetic field. This measurement correspond to the out of plane projection of the magnetization while it rotates reversibly outside its easy axis toward its hard axis direction (see Fig. S5a). We define the maximum Kerr signal amplitude as the difference between the maximum and the minimum intensities. This Kerr signal amplitude is proportional to the Kerr rotation, itself proportional to 𝑀𝑠. 𝑡𝐶𝑜. The Kerr signal maximum
amplitude is plotted in Fig. S3a as function of the wedge position. As the change in the Kerr signal intensity (<1%) and the change of the Co thickness (1%) are negligible between positions 1 and 5, we assume that the 17% drop in the Kerr signal is related to a 𝑀𝑠 variation. A small change of the Co
thickness can lead to a significant change in 𝑀𝑠 due to the proximity of the 𝑇𝐶. A similar effect was
observed in 𝑃𝑡/𝐶𝑜/𝐴𝑙2𝑂3 in the work by Chiba et al.2 where they observe a change in the 𝑇𝐶 by few
tens of K when the Pt thickness is modified by few %.
S3. Determination of 𝑴𝒔, 𝒕 and 𝝈𝒘 and their variation along the wedge.
As the 𝑀𝑠 and 𝑡 parameters are known with a significant uncertainty (of the order of +/−10%) we have
checked that a variation of these parameters, between 𝑀𝑠= 0.85 𝑡𝑜 1.05 A/M and 𝑡 = 0.43 𝑡𝑜 0.51 nm
does not change any of the conclusions of the paper. In particular, only minor differences in the simulations of Fig. 1d,e, Fig. 2g, Fig. 3c,d are found. Consequently, we decided to fix the average value of 𝑀𝑠(293K) for sample A1 to its upper bound 0.89 × 10⁶ A/m obtained in paragraph S2. The variation
of 𝑀𝑠 along the sample A1 is obtained by a fit to the Kerr data in Fig. S3a using 𝑀𝑠 = 0.93 × 10⁶-0.27𝑥²
where 𝑥 is the position in µm. The corresponding 𝑀𝑠 values are shown in the right y axis of Fig. S3a.
The thickness is fixed also to its lower bound 𝑡 = 0.47 nm. To estimate the variation of the Co thickness along the wedge we made the assumption that the Co thickness variation due to oxidation is a linear projection of the aluminium thickness variation (see Fig S1). The deposition is done by sputtering in a system with square targets. The wedge is obtained by progressively moving the shutter during the deposition. To calibrate the thickness variation over the 10 cm width of the substrate, a thicker wedged layer has been deposited and the thickness has been measured regularly using X-ray reflectivity along the sample. Assuming that the slope varies proportionally with the thickness, we deduce a slope of 0.1 nm/cm for the aluminium wedge, and consequently the Co layer in the overoxidized zone, assuming that the oxygen plasma is homogeneous.
In Fig. S4, we show the domain wall energy and its variations, calculated from the analytical expression of the labyrinthine domains width defined in the Methods : 𝜎𝑤= ln(𝐿/(0.955. 𝑡)). 𝜇0𝑀𝑠². t/π using the 𝑀𝑠
and 𝑡 values given previously and the experimental domain width 𝐿 values extracted by fast Fourier transform from Fig.1a which is plotted in Fig.1c. These values are fitted with a polynomial expression: 𝜎𝑤= 1.44. 10−3-4.53. 10−7𝑥-5.43. 10−10𝑥² where 𝑥 is the position in µm (Fig. S4). The table T1
summarizes the experimental 𝑀𝑠, 𝑡 and 𝜎𝑤 values defined here and their variations along the wedge.
These values will be used as an input for the isolated skyrmion bubble simulations in Fig. 1 d and e.
𝑡 (nm) 0.47 × 10⁻⁹-0.01 × 10⁻¹²𝑥
𝑀𝑠 (MA/m) 0.93 × 10⁶-0.27𝑥²
𝜎𝑤 (mJ/m²) 1.44 × 10⁻³-4.53 × 10⁻⁷𝑥-5.43 × 10⁻¹⁰ 𝑥²
Table T1 : experimental 𝒕, 𝑴𝒔 and 𝝈𝒘 values and their variations. 𝒙 is the position in µm with respect
to position 𝒑𝟎.
S4. Determination of 𝑲𝒆𝒇𝒇 and 𝑴𝒔 variations using Kerr measurements combined with a
Stoner-Wohlfarth model.
We carry out simulations of the 𝑀(𝐻) loops in the hard axis direction based on the Stoner-Wohlfarth (SW) model which allows to reproduce the magnetization rotation and estimate 𝐾𝑒𝑓𝑓/𝑀𝑠. We assume
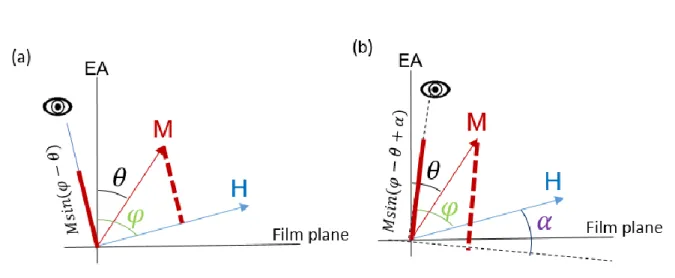
that the system has a uniaxial easy axis perpendicular to the film surface (Fig. S5). The energy per unit volume is: : 𝐸 = 𝐾𝑒𝑓𝑓𝑠𝑖𝑛2(𝜃) − 𝜇0𝐻𝑀𝑠𝑐𝑜𝑠(𝜃 − 𝜑) where 𝐾𝑒𝑓𝑓 is the uniaxial anisotropy in 𝐽/𝑚3, 𝜃 the
angle between the magnetization and the easy axis and 𝜑 the angle between the magnetic field and the easy axis (see Fig. S5). An angle 𝛼 is introduced to take into account the misalignment between the applied magnetic field, the film plane and the direction perpendicular to the observation direction (Fig. S5b). In Fig. S3b the normalised polar Kerr signals for in plane applied magnetic field measured at positions 1 and 3 are superimposed with the SW fits obtained with the parameters 𝑀𝑠=
0.92 MA/m (1), 𝑀𝑠= 0.85 MA/m (3), 𝐾𝑒𝑓𝑓= 0.28 MJ/m3 (1), 𝐾𝑒𝑓𝑓 = 0.24 MJ/m3 (3), 𝜑 = 84° and 𝛼 =
2° . At position 0 we fond 𝑀𝑠= 0.93 MA/m, 𝐾𝑒𝑓𝑓 = 0.30 MJ/m3, 𝜑 = 84° and 𝛼 = 2°.
The video V1 displays in real time the polar Kerr images of the room temperature spontaneous demagnetization. The sample was saturated with an out of plane magnetic field which is turned to zero just after the beginning of the video. We observe a spontaneous demagnetization of the sample in few seconds via the nucleation and growth of magnetic domains. When the sample is demagnetized, the thermally activated movement of the DW is still visible. Such thermal melting of stripe domains has been observed in systems near the spin reorientation transition3–9.
S6. Current induced skyrmion bubbles motion.
The sample was etched to form a Hall cross in order to check the unidirectional skyrmion bubbles displacement with electrical current. The channels of the Hall cross are 10 µm large. A DC current of 0.15 mA is applied between the top right and bottom contact. The video V2 displays in real time the polar Kerr image of the Hall cross at room temperature under a ~0.15 mT constant magnetic field applied in the black direction. The skyrmion bubbles have a steady motion against the electron flow for a current density of 5 × 10⁹ 𝐴/𝑚². Some bubbles get pinned and/or distort into elongated domains reminiscent of
stripe domains. This result is similar to what has been obtained in other systems presenting skyrmion bubbles10–12. A more detailed bubble motion study was not carried out in our work.
S7. Real time room temperature spontaneous nucleation and annihilation of skyrmion bubbles.
In video V3, the room temperature real time polar Kerr image near the number 1 indicated in Fig. 1d-e under a constant out of plane magnetic field of ~0.25 mT applied in opposite direction to the bubbles magnetization. Spontaneous nucleation and annihilation of white skyrmion bubbles with a rate > 1 Hz are observed.
S8. Experimental determination of the electric field variation of 𝑴𝒔 , 𝑲𝒆𝒇𝒇 and 𝝈𝑾 using Kerr
measurements and the Stoner-Wohlfarth model.
Polar Kerr loops with in plane applied magnetic field have been recorded at position 𝑝1= 215 μm under
electric field to characterize the variations of 𝑀𝑠 and 𝐾𝑒𝑓𝑓. The 𝑀𝑠 value at position 𝑝1, determined in
paragraph S3 is 𝑀𝑠 = 0.92 MA/m. We use the SW model described in the paragraph S4 to deduce 𝐾𝑒𝑓𝑓
and extract the 𝑀𝑠 and 𝐾𝑒𝑓𝑓 variations with electric field. In Fig. S6b, the normalised polar Kerr signal
for in plane applied magnetic field measured at positions 𝑝1 with 0 V and -10 V applied voltages are
superimposed with the SW fits obtained with the parameters 𝑀𝑠= 0.92 MA/m (0 V), 𝑀𝑠=
S6a, a polar Kerr image is showing the effect of the electric field on the labyrinthine domains: the domains size is shifted by ~ 400 μm toward the thinner wedge direction for negative voltage (electron depletion in Co). This observation is consistent with the equivalence between a reduction of the electron density and an oxidation increase observed in our previous work13. The labyrinthine domain width 𝐿
and its electric field variation is extracted from the image of Fig. S6a using fast Fourier transform. Then, as in paragraph S3, we use this values to calculate the domain wall energy and its variation under electric field using the experimental 𝑀𝑠 = 0.92 MA/m and 𝑡 = 0.468 nm values and their variations with
the wedge position, and ∆𝑀𝑠= 𝑀𝑠(-10 V)-𝑀𝑠(0 V) = -0.1 MA/m obtained from the SW fit in Fig. S6b.
The obtained DW energy is plotted in Fig. S6c. A linear fit allows to extract the electric field variation of the DW energy ∆𝜎𝑤= 𝜎𝑤(-10 V)-𝜎𝑤(0 V) = -0.32 mJ/m².
In Fig. S7 the normalised polar Kerr signals for in plane applied magnetic field measured another day at positions 𝑝1 for higher applied voltages +20 V and -20 V are superimposed with the SW fits obtained
with the parameters 𝑀𝑠 = 1.07 MA/m ( + 20 V), 𝑀𝑠= 0.57 MA/m (-20 V), 𝐾𝑒𝑓𝑓 = 0.42 MJ/m3 ( + 20 V),
𝐾𝑒𝑓𝑓= 0.15 MJ/m3 (-20 V), 𝜑 = 86° and 𝛼 = 6°.
S9. Switching skyrmion bubbles with electric field.
The video V4 displays, in real time, at room temperature, the polar Kerr image of the skyrmion switch effect at position 𝑝1. The sample was saturated under a high out of plane magnetic field in the opposite
direction (black) to the bubbles magnetization before the beginning of the video, then a 0.15 mT out of plane magnetic field is applied in the black direction and kept constant. During the video the electric field is switched every two seconds between -20 V and + 20 V starting with + 20 V.
S10. Estimation of the electric field variation of the DW energy 𝝈𝑾 for high electric field using
the isolated bubble model.
At high electric fields the labyrinthine domains disappear as the thermal activation is either too high (at -20 V), leading to a complete melting of the labyrinthine domains, or too low (at +20 V), preventing the system to demagnetize and the labyrinthine domains to form. Consequently, the experimental determination of the DW energy 𝜎𝑤 using the labyrinthine domain width 𝐿 was not possible for high
electric fields. To estimate 𝜎𝑤 for these high voltages, we applied the isolated bubble model, using as
electric field. We start by the +20 V case. At this voltage all the skyrmion bubbles disappear, as observed in Fig. 3b and video V4. This means that the annihilation energy barrier (defined in Fig. 2g) is smaller than the RT thermal energy limit 𝐸𝑎/𝑘𝐵𝑇293𝐾< 23, and much smaller than the nucleation energy 𝐸𝑎≪
𝐸𝑛. This is true for DW energies 𝜎𝑤> 1.85 mJ/m² as shown in Fig. S8a. This gives a lower bound for
the increase of 𝜎𝑤 under electric field ∆𝜎𝑤 𝑝𝑜𝑠
=𝜎𝑤(20 V)- 𝜎𝑤(0 V)=1.85-1.33>0.52 mJ/m². For -20 V, we
observe a fast nucleation of skyrmion bubbles in Fig. 3a and video V4 and we deduce a nucleation energy 𝐸𝑛/𝑘𝐵𝑇293𝐾< 23, an annihilation energy 𝐸𝑎/𝑘𝐵𝑇293𝐾> 23. This gives a DW energy 𝜎𝑤<
0.47 mJ/m² as shown in Fig. S8b and a lower bound for the decrease of 𝜎𝑤 under electric field ∆𝜎𝑤 𝑛𝑒𝑔
= 𝜎𝑤(0 V)- 𝜎𝑤(-20 V)=1.33-0.47>0.86 mJ/m².
References
(1) Kuz’min, M. D. Shape of Temperature Dependence of Spontaneous Magnetization of Ferromagnets: Quantitative Analysis. Phys. Rev. Lett. 2005, 94, 16–19.
(2) Chiba, D.; Fukami, S.; Shimamura, K.; Ishiwata, N.; Kobayashi, K.; Ono, T. Electrical Control of the Ferromagnetic Phase Transition in Cobalt at Room Temperature. Nat. Mater. 2011, 10, 853.
(3) Wu, J.; Choi, J.; Won, C.; Wu, Y. Z.; Scholl, A.; Doran, A.; Hwang, C.; Qiu, Z. Q. Stripe-to-Bubble Transition of Magnetic Domains at the Spin Reorientation of (Fe/Ni)/Cu/Ni/Cu(001). Phys. Rev. B - Condens. Matter Mater. Phys. 2009, 79, 1–6.
(4) Portmann, O.; Vaterlaus, A.; Pescia, D. Observation of Stripe Mobility in a Dipolar Frustrated Ferromagnet. Phys. Rev. Lett. 2006, 96, 1–4.
(5) Bergeard, N.; Jamet, J. P.; Mougin, A.; Ferré, J.; Gierak, J.; Bourhis, E.; Stamps, R. Dynamic Fluctuations and Two-Dimensional Melting at the Spin Reorientation Transition. Phys. Rev. B - Condens. Matter Mater. Phys. 2012, 86, 1–5.
(6) Kuch, W.; Fukumoto, K.; Wang, J.; Nolting, F.; Quitmann, C.; Ramsvik, T. Thermal Melting of Magnetic Stripe Domains. Phys. Rev. B - Condens. Matter Mater. Phys. 2011, 83, 1–4.
(7) Won, C.; Wu, Y. Z.; Choi, J.; Kim, W.; Scholl, A.; Doran, A.; Owens, T.; Wu, J.; Jin, X. F.; Zhao, H. W.; et al. Magnetic Stripe Melting at the Spin Reorientation Transition in Fe Ni Cu(001).
Phys. Rev. B - Condens. Matter Mater. Phys. 2005, 71, 1–5.
(8) Bergeard, N.; Jamet, J. P.; Ferré, J.; Mougin, A.; Fassbender, J. Spin Reorientation Transition and Phase Diagram in an He+ Ion Irradiated Ultrathin Pt/Co(0.5 nm)/Pt Film. J. Appl. Phys.
2010, 108, 0–9.
(9) Choi, J.; Wu, J.; Won, C.; Wu, Y. Z.; Scholl, A.; Doran, A.; Owens, T.; Qiu, Z. Q. Magnetic Bubble Domain Phase at the Spin Reorientation Transition of Ultrathin Fe/Ni/Cu(001) Film. Phys. Rev. Lett. 2007, 98, 207205.
(10) Jiang, W.; Upadhyaya, P.; Zhang, W.; Yu, G.; Jungfleisch, M. B.; Fradin, F. Y.; Pearson, J. E.; Tserkovnyak, Y.; Wang, K. L.; Heinonen, O.; et al. Blowing Magnetic Skyrmion Bubbles. 2015, 349.
(11) Yu, G.; Upadhyaya, P.; Li, X.; Li, W.; Kim, S. K.; Fan, Y.; Wong, K. L.; Tserkovnyak, Y.; Amiri, P. K.; Wang, K. L. Room-Temperature Creation and Spin–Orbit Torque Manipulation of Skyrmions in Thin Films with Engineered Asymmetry. Nano Lett. 2016, 16, 1981–1988. (12) Woo, S.; Litzius, K.; Kruger, B.; Im, M.-Y.; Caretta, L.; Richter, K.; Mann, M.; Krone, A.; Reeve,
R. M.; Weigand, M.; et al. Observation of Room-Temperature Magnetic Skyrmions and Their Current-Driven Dynamics in Ultrathin Metallic Ferromagnets. Nat Mater 2016, 15, 501–506. (13) Bernand-Mantel, A.; Herrera-Diez, L.; Ranno, L.; Pizzini, S.; Vogel, J.; Givord, D.; Auffret, S.;
Boulle, O.; Miron, I. M.; Gaudin, G. Electric-Field Control of Domain Wall Nucleation and Pinning in a Metallic Ferromagnet. Appl. Phys. Lett. 2013, 102.
Figure S1 : Schematic representation of the sample A1 with the 0-5 and 𝒑𝟎-𝒑𝟑 positions used in the
Figure S2 : VSM-SQUID measurements of the remanent magnetization of a sample similar to A1 as function of the
Figure S3 : a, Polar Kerr loop maximum amplitude recorded every 160 µm along the wedge starting from
a position around 𝒑𝟎 divided by the Kerr loop maximum amplitude at position 𝒑𝟎. The corresponding
magnetization values are indicated on the right y axis. b, Polar Kerr loops versus in-plane magnetic field recorded at positions 1 (black squares) and 3 (blue triangles) indicated on a. SW fit (black and blue lines, see S4).
Figure S4 : Experimental values of the DW energy along the wedge calculated using the experimental
Figure S5: Definition of the angles between the magnetization, the applied magnetic field, the film
Figure S6: (a) Polar Kerr image of the labyrinthine domains under electric field at zero applied magnetic field.
The dashed rectangle correspond to the zone where the Kerr signal of (b) was recorded b, Normalized polar Kerr signal for in plane applied magnetic field at positions 𝑝1 on the wedge under applied voltages of 0 V (black
circles) and -10 V (blue squares) superimposed with the SW fit (blue and black lines). c, Experimental (squares and dots) DW energies as function of the wedge position and for two applied voltages calculated from the analytical expression of the labyrinthine domain width using the 𝐿 values extracted by Fast Fourier transform from a. The black and blue lines are linear fits.
(a)
𝑝
0𝑝
1𝑝
0𝑝
150 µm
0 V
-10 V
(c)
(b)
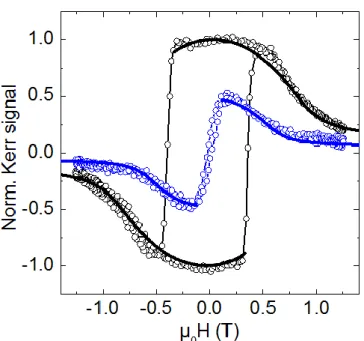
Figure S7: Normalized polar Kerr signal for in plane applied magnetic field at positions 𝑝1 under applied
voltages of +20 V (black circles) and -20 V (blue circles) superimposed with the SW fits (black and blue lines).
Figure S8: Isolated skyrmion bubble energy as function of the bubble diameter calculated with 𝑡 = 0.468 nm, μ0𝐻 = 0.15 mT and the magnetization values corresponding to (a) the +20 V case with 𝑀𝑠=
1.07 MA/m and (b) the -20 V case with 𝑀𝑠= 0.57 MA/m. The DW energy parameters are indicated in the
graphs.