HAL Id: hal-01840431
https://hal.umontpellier.fr/hal-01840431
Submitted on 17 Mar 2021HAL is a multi-disciplinary open access archive for the deposit and dissemination of sci-entific research documents, whether they are pub-lished or not. The documents may come from teaching and research institutions in France or abroad, or from public or private research centers.
L’archive ouverte pluridisciplinaire HAL, est destinée au dépôt et à la diffusion de documents scientifiques de niveau recherche, publiés ou non, émanant des établissements d’enseignement et de recherche français ou étrangers, des laboratoires publics ou privés.
Best practices for mapping replication origins in
eukaryotic chromosomes
Emilie Besnard, Romain Desprat, Michael Ryan, Malik Kahli, Mirit Aladjem,
Jean-Marc Lemaitre
To cite this version:
Emilie Besnard, Romain Desprat, Michael Ryan, Malik Kahli, Mirit Aladjem, et al.. Best practices for mapping replication origins in eukaryotic chromosomes. Current Protocols in Cell Biology, Wiley, 2014, 64 (1), pp.22.18.1-22.18.13. �10.1002/0471143030.cb2218s64�. �hal-01840431�
BEST PRACTICES FOR MAPPING REPLICATION ORIGINS IN
EUKARYOTIC CHROMOSOMES
Emilie Besnard1, Romain Desprat4, Michael Ryan2,3, Malik Kahli1, Mirit I. Aladjem2,*, and Jean-Marc Lemaitre1,4,*
1Laboratory of Genome Plasticity and Aging, Institute of Functional Genomics, 141 rue de la cardonille, 34094 Montpellier France.
2Laboratory of Molecular Pharmacology, Center for Cancer Research, National Cancer Institute, Bethesda, MD 20892-4255, USA.
3InSilico Inc., 2735 Hartland Rd., Suite 301, Falls Church, VA, 22043, USA.
4Stem Cell core Facility, Institute of Research in Biotherapies, Saint-Eloi Hospital, 80 avenue Augustin Fliche, 34295 Montpellier Cedex 5, France.
Abstract
Understanding the regulatory principles insuring complete DNA replication each cell division is critical for deciphering the mechanisms that maintain genomic stability. Recent advances in genome sequencing technology facilitated complete mapping of DNA replication sites and helped move the field from observing replication patterns at a handful of single loci to analyzing
replication patterns genome-wide. These advances address issues such as the relationship between replication initiation events, transcription and chromatin modifications and identify potential replication origin consensus sequences. This article summarizes the technological and
fundamental aspects of replication profiling and briefly discusses novel insights emerging from mining large datasets, published in the last two years, describing DNA replication dynamics on a whole genome scale.
INTRODUCTION
The complete sequence of the human genome, published sixty years after the discovery of the DNA double helix, facilitated a huge leap in understanding DNA-encoded information but revealed far less about the regulation of DNA replication. Understanding the precise mechanisms by which cells control DNA replication is critical, since many signaling pathways that regulate cell growth converge on early stages of DNA replication. Disruptions to these signaling pathways and perturbations of DNA replication are hallmarks of cancer cells and often lead to aberrant development.
Replication of the human genome begins at distinct chromosomal sites called replication origins. Each eukaryotic chromosome contains multiple origins that start replication in a
HHS Public Access
Author manuscript
Curr Protoc Cell Biol
. Author manuscript; available in PMC 2019 July 03.Published in final edited form as:
Curr Protoc Cell Biol. ; 64: 22.18.1–22.1813. doi:10.1002/0471143030.cb2218s64.
A
uthor Man
uscr
ipt
A
uthor Man
uscr
ipt
A
uthor Man
uscr
ipt
A
uthor Man
uscr
ipt
clearly defined order, insuring that the entire genome replicates precisely once before each cell division. Exhaustive and accurate mapping of human replication events is the first step toward understanding how DNA replication is regulated during normal growth and in response to environmental challenges and in abnormal situations like tumorigenesis.
The human genome replicates from between 30,000 and 50,000 replication origins each cell cycle, but until five years ago, only~20 origins had been identified and characterized.
Consequently, a mechanistic paradigm for the selection and activation of human replication origins has not been established. Recent studies had addressed this issue by providing comprehensive, whole-genome maps of replication initiation sites of the genome in several cell types. High-throughput whole-genome maps of replication initiation sites were first assembled from microarray-based analyses of a small portion of the mammalian genome and more recently by sequencing short, newly replicated (nascent) DNA strands (Besnard et al, 2012; Martin et al, 2011) or direct sequencing of replication intermediates (Mesner et al, 2013). Combining replication data from multiple experimental approaches with genetic analyses of replication origins has already yielded important insights into principles that govern metazoan DNA replication (for details, see reviews (Aladjem, 2007; Hamlin et al, 2008; Mechali, 2010) and references therein).
This chapter reviews techniques used to map replication origins in mammalian cells, and summarizes the contribution of those methods to recent advances in the field. Technical and computational challenges in the compilation of whole-genome data are discussed in the context of proposed “best practices” for future replication mapping and other genomic profiling studies. The final section discusses outstanding issues that must be addressed by future experiments to decipher the mechanisms of replication-origin selection in human cells.
QUESTIONS AND UNRESOLVED PARADOXES IN UNDERSTANDING
EUKARYOTIC DNA REPLICATION
Previous efforts to map replication initiation events at individual loci have revealed several challenges. First, replication initiation sites do not obviously share a distinct consensus sequence, so primary sequence information could not be used to identify replication origins. Second, replication initiation sites seem to vary during development and among tissues. Third, distances between replication origins are not uniform across the genome, leading to the apparent paradox that in some loci replication initiates at distinct and isolated sites, whereas in other loci replication starts within “initiation zones” containing multiple origins. In addition, only a portion of potential replication origins actually start replication on each chromosome, and the exact locations of replication initiation events are determined anew each cell division (Gilbert, 2007). This apparent excess of replication origins is a major challenge in understanding the mechanism of DNA replication. Finally, inconsistent observations were obtained by mapping replication origins with various techniques. For example, a series of microarray-based studies (Cadoret et al, 2008; Cayrou et al, 2011; Karnani et al, 2009; Mesner et al, 2011) yielded disparate data, and sequencing of short newly replicated DNA (Martin et al, 2011) (Besnard et al, 2012) identified some but not all
A
uthor Man
uscr
ipt
A
uthor Man
uscr
ipt
A
uthor Man
uscr
ipt
A
uthor Man
uscr
ipt
origins revealed by DNA fiber analyses (Demczuk et al, 2012; Desprat et al, 2009; Lebofsky & Bensimon, 2005; Norio et al, 2005) (Figure 1).
These apparent paradoxes raise a series of questions. The first question is whether discrepancies among findings using disparate techniques reveal technical difficulties or reflect the nature of the replication process. Once technical difficulties are resolved, comprehensive replication initiation maps can decipher how replication origins are selected, determine if origins share distinct consensus sequences, and ask how origin selection affect, or is affected by, chromatin structure, transcription, and the spatial organization within the nucleus.
High—throughput, consistent use of standardized methodology for exhaustive origin mapping should address apparent inconsistencies and help decipher how replication origins are selected. It is particularly critical to map replication initiation in normal somatic cells, as these data are woefully missing. Mapping replication origins in multiple cell types will be important to understand how origin activity is regulated in diverse contexts (e.g., during differentiation, senescence, or malignant transformation).
TECHNIQUES USED IN REPLICATION PROFILING:
Origin activity can be measured by mapping the progression of replication forks or directly by isolating replication intermediates. Ideally, origin mapping would utilize several complementary techniques that rely on non-overlapping assumptions. The principles of the most commonly used origin mapping techniques utilized in the last 40 years are outlined below:
I. Localization of newly replicated DNA:
These techniques isolate and identify newly replicated (nascent) DNA strands that form at replication origins shortly after the onset of DNA synthesis.
i. Early-labeling fragment-hybridization identifies replication origins that are activated first during the S-phase of the cell cycle by incubating cells in early S phase with radiolabelled nucleotide precursors. Labeled DNA is isolated and hybridized to DNA sequences of interest (Burhans et al, 1986). This technique can theoretically be used to interrogate the entire genome, but contaminating broken DNA and the fact that only very early replicating origins can be identified limit its usefulness.
ii. Incorporation of nucleotide precursors (e.g., bromodeoxyuridine (BrdU)) followed by immunoprecipitation can also be used to isolate newly replicated (nascent) DNA strands (Karnani et al, 2009). Because nucleotide analogs can incorporate at both active origins and progressing replication forks, using BrdU-immunoprecipitation to identify replication initiation sites should be coupled with size fractionation.
iii. Small Nascent Strands (SNS) abundance assays select single-stranded DNA fragments of 0.5–2.5 kb derived from replicating cells. SNS purification is
A
uthor Man
uscr
ipt
A
uthor Man
uscr
ipt
A
uthor Man
uscr
ipt
A
uthor Man
uscr
ipt
achieved either by BrdU labeling and immunoprecipitation (as above) or by exposure to lambda exonuclease, which digests DNA without RNA primer from the 5’ end. Since DNA synthesis always starts with a short RNA primer, lambda exonuclease digestion eliminates contaminating broken DNA and leaves newly replicated DNA intact to create a population of purified SNS (Bielinsky & Gerbi, 1998). The abundance of specific sequences in SNS is measured either using microarray hybridization or via high-throughput sequencing (Besnard et al, 2012; Martin et al, 2011). When combined with sequencing to saturation, SNS enrichment reflects how efficiently an origin is activated.
II. Replication fork progression analyses:
These techniques map the direction of DNA synthesis and are used to measure replication rates as well as identify replication origins as points from which replication forks emanate.
i. Replication polarity assays rely on the asymmetry of DNA synthesis, whereby replication produces a continuous DNA strand (leading strand) in one direction and synthesis in the other direction (lagging strands) is achieved by ligating together a series of short fragments (Okazaki fragments). Leading strand analyses prevent lagging strand synthesis, for example by exposure the protein synthesis inhibitor emetin. Labeled replicated DNA, corresponding to the leading strand (Aladjem et al, 1995; Handeli et al, 1989), is hybridized to single stranded probes to identify the template. Okazaki fragment analyses isolate short DNA fragments that form the lagging strand and identify the template strand either by hybridization to single stranded probes or by sequencing. Replication origins are identifies as regions in which the template strand of Okazaki fragment switches. Both leading strand analyses and Okazaki fragment mapping were used to map replication origins in several mammalian loci. Okazaki fragments were also used to map genome-wide origins in yeast ligase mutants (inactivated CDC9)(Smith & Whitehouse, 2012). It is unclear whether these methods could be suitable for mapping replication origins throughout the entire human genome because regions in which replication initiation is flexible (“initiation zones”) are expected to yield replication forks traveling in two opposite directions.
ii. Single-fiber analyses of DNA replication (e.g., DNA molecular combing (Herrick & Bensimon, 2009) or Single Molecule Analysis of Replicating DNA - SMARD (Demczuk et al, 2012; Desprat et al, 2009; Lebofsky & Bensimon, 2005; Norio et al, 2005)) directly visualize incorporation of nucleotide precursors on isolated DNA fibers to measure origin activation and replication-fork progression at specific loci (Herrick & Bensimon, 2009; Norio et al, 2005). These methods can evaluate how replication initiation events are spaced on chromatin and measure the relative efficiency of replication initiation at each origin (Demczuk et al, 2012; Desprat et al, 2009; Guan et al, 2009; Norio et al, 2005) (Lebofsky & Bensimon, 2005). Because the resolution of detection is quite low (Letessier et al, 2011), scaling up might prove challenging. Replication fork progression analyzes can therefore be used together with high-throughput techniques to provide a detailed understanding of replication initiation.
A
uthor Man
uscr
ipt
A
uthor Man
uscr
ipt
A
uthor Man
uscr
ipt
A
uthor Man
uscr
ipt
III. Isolation of replication intermediates:
Prior to replication, replication origins bind a pre-replication complex that includes helicases that separate the two DNA strands to act as replication templates. DNA that is partially unwound and DNA hybrids (linking double stranded to single stranded DNA) are likely to form only in the vicinity of replication origins. Such structures, as well as specific DNA-protein complexes, can be mapped to replication origins.
i. Two-dimensional gel electrophoresis (Brewer & Fangman, 1987) identifies replication intermediates based on the electrophoretic migration of DNA fragments. This method could identify replication origins in yeast and in several mammalian loci (Hyrien et al, 1995; Little et al, 1993; Vaughn et al, 1990). Like single-fiber analyses, this method is relatively low throughput and scaling up is challenging.
ii. The bubble-trap method identifies partially unwound and replicated structures (“bubbles”) occurring only at replication origins based on migration on agarose gels. Microarray analyses or sequencing of the trapped bubbles can identify replication initiation events (Mesner et al, 2013) (Mesner et al, 2011). This method can identify low-efficiency events to delineate initiation zones that contain a small number of efficient origins.
iii. Immunolocalization of pre-replication complexes identifies replication origins as protein binding sites. After cell division, replication origins load an origin-recognition complex (ORC) that recruits a helicase, the mini-chromosome maintenance (MCM) complex, to form the pre-replication complex (pre-RC). Theoretically it should be possible, therefore, to use ORC or MCM binding to map replication origins. In unicellular eukaryotes, replication origins can be mapped by chromatin immunoprecipitation (ChIP) of pre-RC components. These methods have been less effective when analyzing higher eukaryotes (Schepers & Papior, 2010) possibly because the number of Pre-RC complexes in such cells is far greater than the number of active replication origins (Edwards et al, 2002; Hyrien et al, 2003; Ibarra et al, 2008). A recently modified version of chromatin immunoprecipitation identified replication origins based on binding ORC1, a component of pre-RC. The extent to which these sites overlap with SNS or bubble-trap data remains relatively modest, possibly because only very efficient origins were identified from ORC binding sites (Dellino et al, 2013) (Figure 2). As stated above, ideally replication initiation mapping should be based on a combination of several methods relying on non-overlapping assumptions. Low-resolution analyses can provide an in-depth profile of replication initiation at distinct loci to complement high-throughput studies, generating a more complete representation of the replication landscape.
QUALITY CONTROL AND STANDARDIZATION ISSUES
Given the development of high-throughput methods the field now faces the critical tasks of defining technical standards for whole genome origin mapping. Common standards and best practices for data integration will minimize experimental variation and pinpoint
method-A
uthor Man
uscr
ipt
A
uthor Man
uscr
ipt
A
uthor Man
uscr
ipt
A
uthor Man
uscr
ipt
based discrepancies. A thorough understanding of discrepancies may in turn lead to important biological insights. Using standard, well-calibrated analyses can thus facilitate mechanistic analyses with a complete range of available techniques to shed light on diverse aspects of the replication process.
SNS sequencing is the most common method used to map replication origins genome-wide. To ensure the accuracy of whole-genome origin maps, it is essential to avoid biases that can be introduced during SNS purification, sequencing and data analysis. Common sources of biases that should be avoided are pointed below.
Cell culture standards.
Because growth conditions can affect the use of replication origins (Demczuk et al, 2012; Guan et al, 2009), it is essential to define standard sources of cell lines and standardized growth culture conditions. Common cell lines used in laboratory are immortalized and/or transformed, and distinct sub-clones can vary with long-term growth culture condition and medium used, as is known for HeLa cells. Primary cells are less prone to genomic instability but investigators should use standardized growth protocols to achieve pure and
homogeneous differentiated cell populations.
SNS preparation.
It is essential to insure that the SNS preparations contain only nascent DNA and are not contaminated with broken genomic DNA. Size fractionation should exclude Okazaki fragments, which coat entire chromosomes and do not uniquely identify replication-initiation events. In addition, purified SNS are amplified either by random-primed PCR (Karnani et al, 2009; Martin et al, 2011) or by in vitro transcription (Cadoret et al, 2008) to facilitate DNA sequencing, and these processes may introduce sampling biases. To control for these sources of potential biases, the ratio between SNS and genomic DNA should be determine for each sample using previously identified origins interrogated via Q-PCR with origin-proximal and origin-distal primer pairs. Both the original sample and amplified sample should be tested to control for incidental amplification biases, and an acceptable ratio appropriate for the desired false discovery rate (FDR) has to be established. For example, the threshold accepted ratio between proximal and distal amplified products was set at 3-fold enrichment by Martin et al., (2011), testing samples for amplification of origin proximal and distal primers in two genomic loci – the beta globin (HBB) and DBF4. Samples with a lower proximal to distal ratio were excluded from analysis. Besnard and collaborators, 2012 analyzed the MYC replication origin and used a 5-fold enrichment threshold.
Binning issues.
SNS-abundance mapping generates reads from nascent strands after primer extension using random primers. Results are summarized as read counts in bins across the genome and areas with high read counts (peaks) indicate replication initiation activity. Bin size should take into account read length. Martin et al. (2011) used bins of 100 bases and smoothed counts across seven bins via a Gaussian algorithm (kernel size = 7 bins, variance = 1.75). The abundance of nascent DNA was quantified as reads per kilobase per million aligned reads (RPKM), supporting normalization across samples. Besnard et al. used a window of 200 bases (i.e.,
A
uthor Man
uscr
ipt
A
uthor Man
uscr
ipt
A
uthor Man
uscr
ipt
A
uthor Man
uscr
ipt
the length of sonicated DNA fragments that are analyzed by next-generation sequencing) with a stringent false-discovery rate (0.0001%) to analyze SNS-peak enrichment (Blahnik et al, 2010). This analysis yielded an average origin-peak size of 750 bases, which is consistent with the seven bins that were used by Martin et al. (2011). The different number of peaks identified in both studies might reflect increased resolution from a higher sequencing depth (Besnard et al, 2012; Gilbert, 2012).
Controlling for bias when sequencing genomic DNA:
Next-generation sequencing technologies exhibit coverage biases that are extremely consistent across sequencing runs (Harismendy et al, 2009). These biases result in genomic regions that were extremely amplified across multiple cell lines, controls, and nascent-strand samples. Copy-number variation among cancer cells can create another potential bias. To correct for sequencing bias, Martin et al. (2011) reported SNS results as the ratio of nascent RPKM to control RPKM. One potential problem with this approach is that very low control values can lead to high ratios, even when the nascent-strand RPKM is not very large. To guard against this effect, Martin et al. (2011) established a control floor value and raised all lesser values to this level. The enrichment ratio also corrects for copy-number variation because genomic amplifications are reflected in the genomic control.
Similarly, Besnard et al. 2012 utilized the Sole-Search software, which calculates copy-number estimates for duplicated regions to identify regions of the input genome that are over-represented because of technical concerns (e.g., library construction or sequencing). The next step creates two background models: one model reflects all unique regions of the genome and the other reflects biased sequencing of input from a particular cell type. Peak calling determines an accurate, statistically significant height cutoff with a predetermined false discovery rate (FDR). Peaks identified after the first step are filtered using a user-defined significance cutoff and peak length filter (Blahnik et al, 2010).
INTEGRATING DIFFERENT SOURCES OF GENOMIC DATA
Correlating replication initiation profiles with maps delineating chromatin modifications, DNAse hypersensitivity, transcription and replication timing can yield important insights into chromatin structure. Integrating different types of data can be particularly challenging because microarray analyses and SNS mapping can yield very different resolutions and publically available datasets of genomic features often contain features that vary considerably in length. Comparisons between different types of data, therefore, must be based upon common standards that encompass the entire genome. Importantly, comparisons with gene-expression data should take into account copy-number variations, which represent a confounding factor when analyzing cancer cells (discussed in (Martin et al, 2011;
Valenzuela et al, 2011) and references therein). Combining information about the location and the timing of initiation events should be particularly informative. Until now, origin-mapping studies have shown that replication origins are more densely packed in early-replicating regions than in late-early-replicating regions (Besnard et al, 2012; Cayrou et al, 2011). Further, early origins are highly efficient and late origins may be associated with a more flexible pattern of usage. Spatiotemporal analyses of replication intermediates across the
A
uthor Man
uscr
ipt
A
uthor Man
uscr
ipt
A
uthor Man
uscr
ipt
A
uthor Man
uscr
ipt
entire human genome via deep sequencing support this assumption. Nucleotide-composition skew reflects the mean replication-fork polarity (Chen et al, 2011) (Baker et al, 2012), and the order of origin activation within replication timing domains can be determined by molecular combing (Guilbaud et al, 2011) (Raghuraman et al, 2001). More experimental data are required, however, to precisely determine the levels of efficiency of replication origins and associate these findings with the observed fork-polarity gradients. High-resolution mapping of Okazaki fragments in budding yeast (McGuffee et al, 2013) supports a model whereby replication origin activation could promote initiation from nearby origins, resulting in clustered replication initiation zones (Guilbaud et al, 2011). Similar analyses are challenging in metazoan, because currently available replication timing data are of lower resolution than replication origin maps23. Combining replication origin mapping at high resolution with replication timing analyzes, for example by adapting Okazaki fragment mapping to human cells, could thus reveal important insights on the replication program.
INSIGHTS FROM RECENT WHOLE-GENOME REPLICATION PROFILING
STUDIES
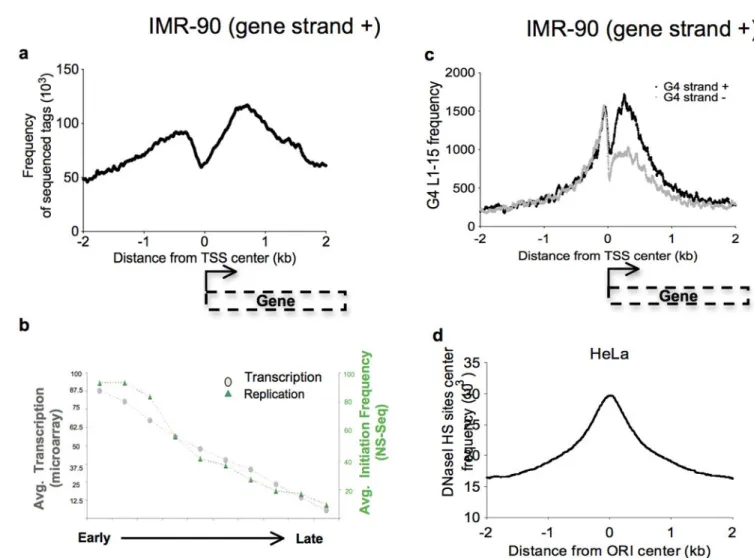
Origin mapping has shown that replication initiation events associate with conserved sequences (Cadoret et al, 2008; Karnani et al, 2009; Valenzuela et al, 2011) and revealed a notable but incomplete conservation among replication initiation sites across cell types (Besnard et al, 2012; Martin et al, 2011)., Although metazoan pre-RC components do not bind DNA in a sequence specific manner (Aladjem, 2007; Vashee et al, 2003), Drosophila, mouse and human replication origins associate with GC- and G-rich motifs (Besnard et al, 2012; Cadoret et al, 2008; Cayrou et al, 2011; Sequeira-Mendes et al, 2009). Analyses of 3,000 replication origins in the mouse genome (Cayrou et al, 2011) and 250,000 replication origins in primary human fibroblasts revealed a replication origin associated nucleotide composition bias and strand asymmetries (i.e., GC skews)(Audit et al, 2012; Touchon et al, 2005) with a particular association with sequences capable of forming G-quadruplexes (G4). The density of G4 L1–15 correlates with the density of replication origins and with the efficiency of initiation (Besnard et al, 2012) (Figure 3). Moreover, origin sequences are particularly enriched near transcription start sites that contain G-quadruplexes (Figure 4). In both yeast and metazoans, ORC is preferentially loaded onto nucleosome-free regions (NFR) of chromatin (Eaton et al, 2010; Lipford & Bell, 2001; Lubelsky et al, 2011; McGuffee et al, 2013). Origins are not always associated with a NFR, however, revealing a conserved but flexible nature of replication-origin architecture in budding yeast (Chang et al, 2011). Whether there are different types of origin architectures within the human genome is unclear, although there seem to be a certain amount of activation flexibility within human cells.
Experiments utilizing several distinct methods identified large genomic segments that lack detectable origins (Besnard et al, 2012; Cadoret et al, 2008; Martin et al, 2011). Such initiation-deficient regions might contain potential replication origins programmed to be activated during distinct cellular differentiation states and particular growth conditions to separate early- and late-replication domains (Desprat et al, 2009; Farkash-Amar et al, 2008;
A
uthor Man
uscr
ipt
A
uthor Man
uscr
ipt
A
uthor Man
uscr
ipt
A
uthor Man
uscr
ipt
Guan et al, 2009; Hiratani et al, 2009; Ryba et al, 2010). In concordance, SNS sequencing experiments have revealed a marked clustering of origins. Results using fiber analyses, however, indicate that actual distances between origins are longer than the distances revealed by SNS Sequencing (Besnard et al, 2012; Martin et al, 2011). This suggests that in many loci each chromosome might replicate from a different site selected among many adjacent potential origins. This observation is consistent with Melvin DePampilis’s “Jesuit” model suggesting that replication origin activation conforms to the principle of “many are called, but few are chosen” (DePamphilis, 1993). Comparisons between pre-RC ChIP and origin-mapping could help decipher the role of pre-RC components such as MCM helicases in origin choice and resolve whether more than a single licensed origin can be present in replication initiation zones prior to initiation of DNA replication.
While replication and transcription are preferentially co-oriented to avoid collapse of the respective machineries (Huvet et al, 2007), a direct comparison of the frequency of replication initiation events with actual transcription rates (Martin et al, 2011) revealed that increased transcription resulted in depletion of replication initiation events. This depletion was particularly pronounced around the TSS. These observations suggest that while transcription and replication are co-oriented, transcription initiation complexes might exclude pre-replication complexes. Further studies are required to reveal the extent to which replication and transcription are coordinated.
Comprehensive replication maps have started to delineate the relationship between nucleosome positioning (which is determined by sequence, chromatin structure, and epigenetic modifications, for example) and DNA replication (Dorn & Cook, 2011). To decipher how replication is regulated in the context of chromatin, it is critical to characterize the full range of post-translational histone modifications at different cell-cycle phases, because these epigenetic modifications can affect origin activity during S-phase (reviewed in(Dorn & Cook, 2011)). For example, mono-methylation of histone H4 on lysine 20 (H4K20me1) is critical for the regulation of re-replication (Kuo et al, 2012; Tardat et al, 2010) and origins in four cell types (HeLa, iPSC, H9, and IMR-90) indeed associate with H4K20me1 during mitosis. Epigenetic modifications are altered during differentiation or under cellular stress and play a key role in maintaining genomic stability. For example, H3K4me1/3 exhibited low association with origins during unperturbed growth but associates with origins following DNA damage. Comparing replication-origin positions and the pattern of different histone methylations (e.g., H4K20me1, H3K4me3, and H3K4me1) suggests a complex epigenetic regulation of replication origins (Figure 5). In another example (Fu et al, 2013), methylation of histone H3 on lysine 79, which fluctuates during the various phases of the cell cycle, associates with a distinct group of replication origins and prevent re-activation of early-replicated origins to maintain genomic stability.
Most replication origins exhibit remarkable concordance among human cells (Besnard et al, 2012; Martin et al, 2011), but some cell-type specific and differentiation associated
variations in origin efficiency are detected, consistent with previous observations in individual loci (Demczuk et al, 2012; Hyrien et al, 1995; Mechali, 2010; Norio et al, 2005). These observations suggest that chromatin accessibility and epigenetic elements related to cellular differentiation affect the efficiency of origin activation.
A
uthor Man
uscr
ipt
A
uthor Man
uscr
ipt
A
uthor Man
uscr
ipt
A
uthor Man
uscr
ipt
REMAINING ISSUES AND FUTURE DIRECTIONS
One of the major insights afforded by whole-genome replication maps is the realization that many apparent discrepancies in previous replication studies reflect flexible replication programs. However, some discrepancies in replication origin maps remain. For example, exhaustive mapping of replication origins via SNS deep sequencing in diverse cell types shows that 70% of the origins are common across cell types (Martin et al, 2011), but bubble-trap methods reveal a higher degree of replication pattern variation (Mesner et al, 2011). It is possible that the diverse findings reflect variations in the frequency of initiation because the number of reads in SNS-Seq tends to be proportional to the frequency of initiation whereas bubble-traps, similar to fiber analyses, can detect both inefficient initiation intermediates. It is possible that whole genome fiber analyses including dynamic molecular combing or Single Molecule Analysis of Replicating DNA will provide the ultimate measurements of replication initiation frequencies, but such studies require significant progress in automation/ computerization of image acquisition and analyses.
Low-throughput genetic analyses measuring the replication potential of individual replication origins had previously identified sequence motifs essential for initiation (Aladjem et al, 1998; Ghosh et al, 2004). In accordance, whole-genome analyses show that replication origin activity is partially determined by DNA sequence since many origins share a G-rich DNA motif and highly efficient origins are enriched in G-quadruplex sequences. An epigenetic component of origin activation is also evident since replication origins are enriched in regions that are GC-rich, contain DNaseI-hypersensitive sites, and either lack nucleosomes (Audit et al, 2012; Besnard et al, 2012; Cadoret et al, 2008; Yin et al, 2009) or contain histone modifications correlating with open chromatin conformations (Figure 4). Further genetic analyses in multiple cell types are required to determine the relative contribution of sequence motifs and chromatin modifications to replication potential and whether G-quadruplex sequences are necessary and/or sufficient for efficient origin activity. Similarly, effective methods to localize components of the pre-RC are needed to clarify the relationship between pre-RC components binding and origin activity. Such studies could provide stoichiometric data and facilitate mechanistic insights into the early stages of DNA replication.
Comprehensive replication origin maps are the first step towards understanding the mechanistic links between origin selection and maintenance of genomic stability. For example, the cell cycle kinases ATR and Chk1 regulate origin activation (Ge et al, 2007; Petermann et al, 2010) to prevent activation of supplementary origins called “dormant origins”, which do not start replication unless cells encounter stressful conditions. Despite the critical role dormant origins play to insure genomic stability, their molecular
characteristics remain poorly understood. This role might be underlined by the observation that deficiencies in replication origin binding proteins lead to developmental defects (Kuo et al, 2012) (Nordman et al, 2011), and genomic instability negatively correlates with the frequency of initiation at fragile sites (Letessier et al, 2011). Generating a precise map of all epigenetic modifications during different phases of the cell cycle, and comparing it to replication-origin positions can help delineate epigenetic modifications that determine origin position and activity.
A
uthor Man
uscr
ipt
A
uthor Man
uscr
ipt
A
uthor Man
uscr
ipt
A
uthor Man
uscr
ipt
“Origin-omics” (Gilbert, 2012) strives to understand the complexity of replication origins. In coming years, investigators must apply a variety of high-throughput techniques that rely on non-overlapping assumptions to exhaustively map replication origins within the human genome. Improved methods are required to identify low-efficiency or generally latent origins, to analyze origin datasets and facilitate comparisons across genomic platforms. By applying these analyses to a number of different cell types, developmental stages, and pathological conditions, a clear understanding of the DNA replication process may soon be within reach.
Literature cited:
Aladjem MI. 2007 Replication in context: dynamic regulation of DNA replication patterns in metazoans. Nat Rev Genet 8: 588–600 [PubMed: 17621316]
Aladjem MI, Groudine M, Brody LL, Dieken ES, Fournier RE, Wahl GM, Epner EM. 1995
Participation of the human beta-globin locus control region in initiation of DNA replication. Science 270: 815–819 [PubMed: 7481774]
Aladjem MI, Rodewald LW, Kolman JL, Wahl GM. 1998 Genetic dissection of a mammalian replicator in the human beta-globin locus. Science 281: 1005–1009 [PubMed: 9703500] Audit B, Zaghloul L, Baker A, Arneodo A, Chen CL, d’Aubenton-Carafa Y, Thermes C. 2012
Megabase replication domains along the human genome: relation to chromatin structure and genome organisation. Sub-cellular biochemistry 61: 57–80
Baker A, Audit B, Chen CL, Moindrot B, Leleu A, Guilbaud G, Rappailles A, Vaillant C, Goldar A, Mongelard F, d’Aubenton-Carafa Y, Hyrien O, Thermes C, Arneodo A. 2012 Replication fork polarity gradients revealed by megabase-sized U-shaped replication timing domains in human cell lines. PLoS computational biology 8: e1002443 [PubMed: 22496629]
Besnard E, Babled A, Lapasset L, Milhavet O, Parrinello H, Dantec C, Marin JM, Lemaitre JM. 2012 Unraveling cell type-specific and reprogrammable human replication origin signatures associated with G-quadruplex consensus motifs. Nat Struct Mol Biol 19: 837–844 [PubMed: 22751019] Bielinsky AK, Gerbi SA. 1998 Discrete start sites for DNA synthesis in the yeast ARS1 origin.
Science 279: 95–98 [PubMed: 9417033]
Blahnik KR, Dou L, O’Geen H, McPhillips T, Xu X, Cao AR, Iyengar S, Nicolet CM, Ludascher B, Korf I, Farnham PJ. 2010 Sole-Search: an integrated analysis program for peak detection and functional annotation using ChIP-seq data. Nucleic acids research 38: e13 [PubMed: 19906703] Brewer BJ, Fangman WL. 1987 The localization of replication origins on ARS plasmids in S.
cerevisiae. Cell 51: 463–471 [PubMed: 2822257]
Burhans WC, Selegue JE, Heintz NH. 1986 Isolation of the origin of replication associated with the amplified Chinese hamster dihydrofolate reductase domain. Proceedings of the National Academy of Sciences of the United States of America 83: 7790–7794 [PubMed: 3094015]
Cadoret JC, Meisch F, Hassan-Zadeh V, Luyten I, Guillet C, Duret L, Quesneville H, Prioleau MN. 2008 Genome-wide studies highlight indirect links between human replication origins and gene regulation. Proceedings of the National Academy of Sciences of the United States of America 105: 15837–15842 [PubMed: 18838675]
Cayrou C, Coulombe P, Vigneron A, Stanojcic S, Ganier O, Peiffer I, Rivals E, Puy A, Laurent-Chabalier S, Desprat R, Mechali M. 2011 Genome-scale analysis of metazoan replication origins reveals their organization in specific but flexible sites defined by conserved features. Genome Res 21: 1438–1449 [PubMed: 21750104]
Chang F, May CD, Hoggard T, Miller J, Fox CA, Weinreich M. 2011 High-resolution analysis of four efficient yeast replication origins reveals new insights into the ORC and putative MCM binding elements. Nucleic acids research 39: 6523–6535 [PubMed: 21558171]
Chen CL, Duquenne L, Audit B, Guilbaud G, Rappailles A, Baker A, Huvet M, d’Aubenton-Carafa Y, Hyrien O, Arneodo A, Thermes C. 2011 Replication-associated mutational asymmetry in the human genome. Molecular biology and evolution 28: 2327–2337 [PubMed: 21368316]
A
uthor Man
uscr
ipt
A
uthor Man
uscr
ipt
A
uthor Man
uscr
ipt
A
uthor Man
uscr
ipt
Dellino GI, Cittaro D, Piccioni R, Luzi L, Banfi S, Segalla S, Cesaroni M, Mendoza-Maldonado R, Giacca M, Pelicci PG. 2013 Genome-wide mapping of human DNA-replication origins: Levels of transcription at ORC1 sites regulate origin selection and replication timing. Genome Res 23: 1–11 [PubMed: 23187890]
Demczuk A, Gauthier MG, Veras I, Kosiyatrakul S, Schildkraut CL, Busslinger M, Bechhoefer J, Norio P. 2012 Regulation of DNA replication within the immunoglobulin heavy-chain locus during B cell commitment. PLoS Biol 10: e1001360 [PubMed: 22807655]
DePamphilis ML. 1993 Origins of DNA replication in metazoan chromosomes. J Biol Chem 268: 1–4 [PubMed: 8416916]
Desprat R, Thierry-Mieg D, Lailler N, Lajugie J, Schildkraut C, Thierry-Mieg J, Bouhassira EE. 2009 Predictable dynamic program of timing of DNA replication in human cells. Genome Res 19: 2288–2299 [PubMed: 19767418]
Dorn ES, Cook JG. 2011 Nucleosomes in the neighborhood: new roles for chromatin modifications in replication origin control. Epigenetics: official journal of the DNA Methylation Society 6: 552– 559
Eaton ML, Galani K, Kang S, Bell SP, MacAlpine DM. 2010 Conserved nucleosome positioning defines replication origins. Genes Dev 24: 748–753 [PubMed: 20351051]
Edwards MC, Tutter AV, Cvetic C, Gilbert CH, Prokhorova TA, Walter JC. 2002 MCM2–7 complexes bind chromatin in a distributed pattern surrounding the origin recognition complex in Xenopus egg extracts. J Biol Chem 277: 33049–33057 [PubMed: 12087101]
Farkash-Amar S, Lipson D, Polten A, Goren A, Helmstetter C, Yakhini Z, Simon I. 2008 Global organization of replication time zones of the mouse genome. Genome Res 18: 1562–1570 [PubMed: 18669478]
Fu H, Maunakea AK, Martin MM, Huang L, Zhang Y, Ryan M, Kim R, Lin CM, Zhao K, Aladjem MI. 2013 Methylation of histone H3 on lysine 79 associates with a group of replication origins and helps limit DNA replication once per cell cycle. PLoS genetics 9: e1003542 [PubMed: 23754963] Ge XQ, Jackson DA, Blow JJ. 2007 Dormant origins licensed by excess Mcm2–7 are required for
human cells to survive replicative stress. Genes Dev 21: 3331–3341 [PubMed: 18079179] Ghosh M, Liu G, Randall G, Bevington J, Leffak M. 2004 Transcription factor binding and induced
transcription alter chromosomal c-myc replicator activity. Molecular and cellular biology 24: 10193–10207 [PubMed: 15542830]
Gilbert DM. 2007 Replication origin plasticity, Taylor-made: inhibition vs recruitment of origins under conditions of replication stress. Chromosoma 116: 341–347 [PubMed: 17404750]
Gilbert DM. 2012 Replication origins run (ultra) deep. Nat Struct Mol Biol 19: 740–742 [PubMed: 22864361]
Guan Z, Hughes CM, Kosiyatrakul S, Norio P, Sen R, Fiering S, Allis CD, Bouhassira EE, Schildkraut CL. 2009 Decreased replication origin activity in temporal transition regions. The Journal of cell biology 187: 623–635 [PubMed: 19951913]
Guilbaud G, Rappailles A, Baker A, Chen CL, Arneodo A, Goldar A, d’Aubenton-Carafa Y, Thermes C, Audit B, Hyrien O. 2011 Evidence for sequential and increasing activation of replication origins along replication timing gradients in the human genome. PLoS computational biology 7: e1002322 [PubMed: 22219720]
Hamlin JL, Mesner LD, Lar O, Torres R, Chodaparambil SV, Wang L. 2008 A revisionist replicon model for higher eukaryotic genomes. J Cell Biochem 105: 321–329 [PubMed: 18680119] Handeli S, Klar A, Meuth M, Cedar H. 1989 Mapping replication units in animal cells. Cell 57: 909–
920 [PubMed: 2544294]
Harismendy O, Ng PC, Strausberg RL, Wang X, Stockwell TB, Beeson KY, Schork NJ, Murray SS, Topol EJ, Levy S, Frazer KA. 2009 Evaluation of next generation sequencing platforms for population targeted sequencing studies. Genome biology 10: R32 [PubMed: 19327155] Herrick J, Bensimon A. 2009 Introduction to molecular combing: genomics, DNA replication, and
cancer. Methods in molecular biology 521: 71–101 [PubMed: 19563102]
Hiratani I, Takebayashi S, Lu J, Gilbert DM. 2009 Replication timing and transcriptional control: beyond cause and effect--part II. Curr Opin Genet Dev 19: 142–149 [PubMed: 19345088]
A
uthor Man
uscr
ipt
A
uthor Man
uscr
ipt
A
uthor Man
uscr
ipt
A
uthor Man
uscr
ipt
Huvet M, Nicolay S, Touchon M, Audit B, d’Aubenton-Carafa Y, Arneodo A, Thermes C. 2007 Human gene organization driven by the coordination of replication and transcription. Genome Res 17: 1278–1285 [PubMed: 17675363]
Hyrien O, Marheineke K, Goldar A. 2003 Paradoxes of eukaryotic DNA replication: MCM proteins and the random completion problem. BioEssays: news and reviews in molecular,cellular and developmental biology 25: 116–125
Hyrien O, Maric C, Mechali M. 1995 Transition in specification of embryonic metazoan DNA replication origins. Science 270: 994–997 [PubMed: 7481806]
Ibarra A, Schwob E, Mendez J. 2008 Excess MCM proteins protect human cells from replicative stress by licensing backup origins of replication. Proceedings of the National Academy of Sciences of the United States of America 105: 8956–8961 [PubMed: 18579778]
Karnani N, Taylor CM, Malhotra A, Dutta A. 2009 Genomic Study of Replication Initiation in Human Chromosomes Reveals the Influence of Transcription Regulation and Chromatin Structure on Origin Selection. Mol Biol Cell
Kuo AJ, Song J, Cheung P, Ishibe-Murakami S, Yamazoe S, Chen JK, Patel DJ, Gozani O. 2012 The BAH domain of ORC1 links H4K20me2 to DNA replication licensing and Meier-Gorlin syndrome. Nature 484: 115–119 [PubMed: 22398447]
Lebofsky R, Bensimon A. 2005 DNA replication origin plasticity and perturbed fork progression in human inverted repeats. Molecular and cellular biology 25: 6789–6797 [PubMed: 16024811] Letessier A, Millot GA, Koundrioukoff S, Lachages AM, Vogt N, Hansen RS, Malfoy B, Brison O,
Debatisse M. 2011 Cell-type-specific replication initiation programs set fragility of the FRA3B fragile site. Nature 470: 120–123 [PubMed: 21258320]
Lipford JR, Bell SP. 2001 Nucleosomes positioned by ORC facilitate the initiation of DNA replication. Molecular cell 7: 21–30 [PubMed: 11172708]
Little RD, Platt TH, Schildkraut CL. 1993 Initiation and termination of DNA replication in human rRNA genes. Molecular and cellular biology 13: 6600–6613 [PubMed: 8413256]
Lubelsky Y, Sasaki T, Kuipers MA, Lucas I, Le Beau MM, Carignon S, Debatisse M, Prinz JA, Dennis JH, Gilbert DM. 2011 Pre-replication complex proteins assemble at regions of low nucleosome occupancy within the Chinese hamster dihydrofolate reductase initiation zone. Nucleic acids research 39: 3141–3155 [PubMed: 21148149]
Martin MM, Ryan M, Kim R, Zakas AL, Fu H, Lin CM, Reinhold WC, Davis SR, Bilke S, Liu H, Doroshow JH, Reimers MA, Valenzuela MS, Pommier Y, Meltzer PS, Aladjem MI. 2011 Genome-wide depletion of replication initiation events in highly transcribed regions. Genome Res 21: 1822–1832 [PubMed: 21813623]
McGuffee SR, Smith DJ, Whitehouse I. 2013 Quantitative, genome-wide analysis of eukaryotic replication initiation and termination. Molecular cell 50: 123–135 [PubMed: 23562327] Mechali M 2010 Eukaryotic DNA replication origins: many choices for appropriate answers. Nature
reviews Molecular cell biology 11: 728–738 [PubMed: 20861881]
Mesner LD, Valsakumar V, Cieslik M, Pickin R, Hamlin JL, Bekiranov S. 2013 Bubble-seq analysis of the human genome reveals distinct chromatin-mediated mechanisms for regulating early- and late-firing origins. Genome Res 23: 1774–1788 [PubMed: 23861383]
Mesner LD, Valsakumar V, Karnani N, Dutta A, Hamlin JL, Bekiranov S. 2011 Bubble-chip analysis of human origin distributions demonstrates on a genomic scale significant clustering into zones and significant association with transcription. Genome Res 21: 377–389 [PubMed: 21173031] Nordman J, Li S, Eng T, Macalpine D, Orr-Weaver TL. 2011 Developmental control of the DNA
replication and transcription programs. Genome Res 21: 175–181 [PubMed: 21177957] Norio P, Kosiyatrakul S, Yang Q, Guan Z, Brown NM, Thomas S, Riblet R, Schildkraut CL. 2005
Progressive activation of DNA replication initiation in large domains of the immunoglobulin heavy chain locus during B cell development. Molecular cell 20: 575–587 [PubMed: 16307921]
Petermann E, Woodcock M, Helleday T. 2010 Chk1 promotes replication fork progression by controlling replication initiation. Proceedings of the National Academy of Sciences of the United States of America 107: 16090–16095 [PubMed: 20805465]
A
uthor Man
uscr
ipt
A
uthor Man
uscr
ipt
A
uthor Man
uscr
ipt
A
uthor Man
uscr
ipt
Raghuraman MK, Winzeler EA, Collingwood D, Hunt S, Wodicka L, Conway A, Lockhart DJ, Davis RW, Brewer BJ, Fangman WL. 2001 Replication dynamics of the yeast genome. Science 294: 115–121 [PubMed: 11588253]
Ryba T, Hiratani I, Lu J, Itoh M, Kulik M, Zhang J, Schulz TC, Robins AJ, Dalton S, Gilbert DM. 2010 Evolutionarily conserved replication timing profiles predict long-range chromatin interactions and distinguish closely related cell types. Genome Res 20: 761–770 [PubMed: 20430782]
Schepers A, Papior P. 2010 Why are we where we are? Understanding replication origins and initiation sites in eukaryotes using ChIP-approaches. Chromosome Res 18: 63–77 [PubMed: 19904620] Sequeira-Mendes J, Diaz-Uriarte R, Apedaile A, Huntley D, Brockdorff N, Gomez M. 2009
Transcription initiation activity sets replication origin efficiency in mammalian cells. PLoS genetics 5: e1000446 [PubMed: 19360092]
Smith DJ, Whitehouse I. 2012 Intrinsic coupling of lagging-strand synthesis to chromatin assembly. Nature 483: 434–438 [PubMed: 22419157]
Tardat M, Brustel J, Kirsh O, Lefevbre C, Callanan M, Sardet C, Julien E. 2010 The histone H4 Lys 20 methyltransferase PR-Set7 regulates replication origins in mammalian cells. Nature cell biology 12: 1086–1093 [PubMed: 20953199]
Touchon M, Nicolay S, Audit B, Brodie of Brodie EB, d’Aubenton-Carafa Y, Arneodo A, Thermes C. 2005 Replication-associated strand asymmetries in mammalian genomes: toward detection of replication origins. Proceedings of the National Academy of Sciences of the United States of America 102: 9836–9841 [PubMed: 15985556]
Valenzuela MS, Chen Y, Davis S, Yang F, Walker RL, Bilke S, Lueders J, Martin MM, Aladjem MI, Massion PP, Meltzer PS. 2011 Preferential localization of human origins of DNA replication at the 5’-ends of expressed genes and at evolutionarily conserved DNA sequences. PloS one 6: e17308 [PubMed: 21602917]
Vashee S, Cvetic C, Lu W, Simancek P, Kelly TJ, Walter JC. 2003 Sequence-independent DNA binding and replication initiation by the human origin recognition complex. Genes Dev 17: 1894– 1908 [PubMed: 12897055]
Vaughn JP, Dijkwel PA, Hamlin JL. 1990 Replication initiates in a broad zone in the amplified CHO dihydrofolate reductase domain. Cell 61: 1075–1087 [PubMed: 2350784]
Yin S, Deng W, Hu L, Kong X. 2009 The impact of nucleosome positioning on the organization of replication origins in eukaryotes. Biochemical and biophysical research communications 385: 363–368 [PubMed: 19463783]
A
uthor Man
uscr
ipt
A
uthor Man
uscr
ipt
A
uthor Man
uscr
ipt
A
uthor Man
uscr
ipt
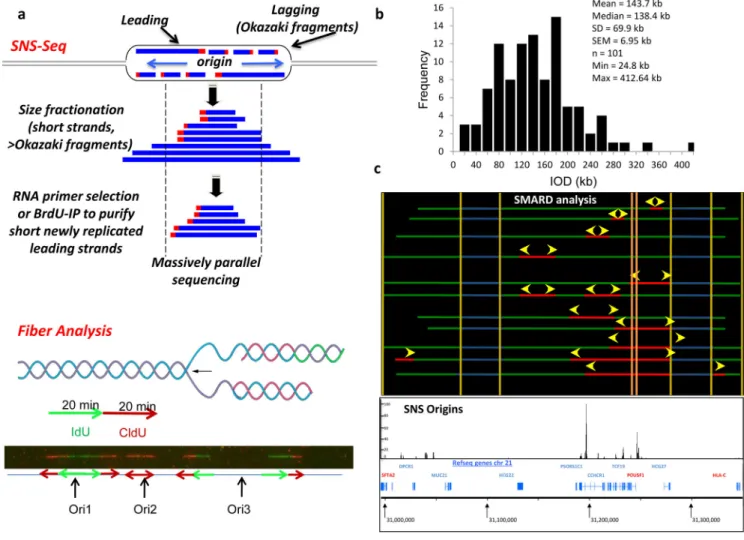
Figure 1: Identification of potential origins in human cells:
(a) The molecular basis of nascent strand sequencing (top) and molecular combing (bottom).
Top, DNA replication proceeds bidirectionally from the replication origin (blue arrows). Separation of the two template strands (black) facilitates synthesis of nascent DNA strandss (blue) that proceeds continuously in the 5’ to 3’ directin (leading strand) and discontinuously in the opposite direction (lagging strand – Okazaki fragments). Each nascent DNA strand is primed with an RNA primer (red box). For SNS-Seq, short leading strands are separated based on size fractionation (size range: 400 – 2000 bp to avoid Okazaki fragments) followed by selection of RNA-primed newly replicated DNA based on lambda exonulcease digestion, or selection for DNA that incorporated a nucleotide analog such as BrdU. The population of newly replicated DNA strands is collected, sequenced and aligned ot the refenrece genome. For fiber analysis, DNA is labeled consecutively with two thymidine analogs (e.g. CldU and IdU) during DNA synthesis. DNA is isolated, stretched in microscope slides and visualized following detection with specific antibodies that recognize the nucleotide analogs.
Replication origins are identified as regions of green flanked by red (ori1), red without green (ori2) or regions that are flanked first by green and then by red (ori3). (b) Histogram showing the distribution of inter-origin distances (IOD) measured by molecular combing in IMR-90 cells. (c) Comparison of Single Molecule Analysis of Replicating DNA (SMARD) analysis on the region containing the POU5F1 locus region (chr6:30,996,000–31,350,000) in
A
uthor Man
uscr
ipt
A
uthor Man
uscr
ipt
A
uthor Man
uscr
ipt
A
uthor Man
uscr
ipt
hESC cells (top panel - reproduced from Desprat et al. 2009 Genome Res.) with significant origin peaks identified with Sole-Search in IMR-90 cells (bottom panel) (enrichments of SNS are shown in IGB without background).
A
uthor Man
uscr
ipt
A
uthor Man
uscr
ipt
A
uthor Man
uscr
ipt
A
uthor Man
uscr
ipt
Figure 2: Enrichment of ORC1 at origin positions:
(a) Visualization of ORC1 density (Dellino et al. 2012 Genome Research) (top) and origin
density (bottom) in HeLa cells on whole chromosome 18 and on whole chromosome 19. (b) Venn diagram showing the overlap between the ORC1 regions and the origins identified in HeLa cells.
A
uthor Man
uscr
ipt
A
uthor Man
uscr
ipt
A
uthor Man
uscr
ipt
A
uthor Man
uscr
ipt
Figure 3: Enrichment of efficient origins and of origin positions with G-quadruplexes:
Visualization of G4 L1–15 density (top), origin density and efficiency (middle) and
replication timing (bottom) in Integrated Genome Browser (IGB), on whole chromosome 18 and on whole chromosome 19. Cytobands and Refseq genes are shown.
A
uthor Man
uscr
ipt
A
uthor Man
uscr
ipt
A
uthor Man
uscr
ipt
A
uthor Man
uscr
ipt
Figure 4: Enrichment of origins on actively transcribed genes:
(a) Frequency of origin sequenced tags along 4-kb regions centered on the TSS of genes transcribed on the plus strand in IMR-90 cells. (b) Histogram showing the correlation between the average transcription level and the average initiation frequency according to the replication timing. (c) Number of G-quadruplex L1–15 along 4-kb regions centered on the TSS of genes transcribed on the plus strand in IMR-90 cells with respect to the strand on which G-quadruplexes are localized. (d) Frequency of DNaseI HS sites (ENCODE/ OpenChrom Duke University) along 4-kb regions centered on the origin center in HeLa cells.
A
uthor Man
uscr
ipt
A
uthor Man
uscr
ipt
A
uthor Man
uscr
ipt
A
uthor Man
uscr
ipt
Figure 5: Enrichment of replication origins in (G+C)-rich regions showing a similar distribution of origins and isochores.:
Analyses of identified origin peaks in HeLa cells that are common with 3 other cell types (hESC H9, iPSC and IMR-90). (a) Visualization of isochores (top) and visualization in Integrated Genome Browser (IGB) of origin density (middle) and genome elements’ density (bottom), on whole chromosome 9. Cytobands are shown. (b) Percentage of origins
associated with different genome elements and percentage of genome recovered by each corresponding genome element. (c) Heatmap showing the association of origins with different genome elements (dark gray represents associated origins, light represents non associated).