Deformability-based cell selection with
downstream immunofluorescence analysis
The MIT Faculty has made this article openly available.
Please share
how this access benefits you. Your story matters.
Citation
Shaw Bagnall, Josephine et al. “Deformability-Based Cell Selection
with Downstream Immunofluorescence Analysis.” Integrative
Biology 8, 5 (March 2016): 654–664 © 2016 The Royal Society of
Chemistry
As Published
http://dx.doi.org/10.1039/C5IB00284B
Publisher
Royal Society of Chemistry (RSC)
Version
Author's final manuscript
Citable link
http://hdl.handle.net/1721.1/117695
Terms of Use
Creative Commons Attribution-Noncommercial-Share Alike
Deformability-based cell selection with downstream
immunofluorescence analysis
Josephine Shaw Bagnall1,*, Sangwon Byun1,*,†, David T. Miyamoto2,3, Joon Ho Kang4, Shyamala Maheswaran2,5, Shannon L. Stott2,6,7, Mehmet Toner5,7, and Scott R. Manalis1,8,9
1Department of Biological Engineering, Massachusetts Institute of Technology, Cambridge, MA 2Massachusetts General Hospital Cancer Center, Harvard Medical School, Boston, MA
3Department of Radiation Oncology, Massachusetts General Hospital, Harvard Medical School, Boston, MA
4Department of Physics, Massachusetts Institute of Technology, Cambridge, MA
5Department of Surgery, Massachusetts General Hospital, Harvard Medical School, Boston, MA 6Department of Medicine, Massachusetts General Hospital, Harvard Medical School, Boston, MA 7Massachusetts General Hospital Center for Engineering and Medicine, Harvard Medical School, Boston, MA
8Department of Mechanical Engineering, Massachusetts Institute of Technology, Cambridge, MA 9Koch Institute for Integrative Cancer Research, Massachusetts Institute of Technology,
Cambridge, MA
Abstract
Mechanical properties of single cells have been shown to relate to cell phenotype and malignancy. However, until recently, it has been difficult to directly correlate each cell’s biophysical
characteristics to its molecular traits. Here, we present a cell sorting technique for use with a suspended microchannel resonator (SMR), which can measure biophysical characteristics of a single cell based on the sensor’s record of its buoyant mass as well as its precise position while it traverses through a constricted microfluidic channel. The measurement provides information regarding the amount of time a cell takes to pass through a constriction (passage time), as related to the cell’s deformability and surface friction, as well as the particular manner in which it passes through. In the method presented here, cells of interest are determined based on passage time, and are collected off-chip for downstream immunofluorescence imaging. The biophysical single-cell SMR measurement can then be correlated to the molecular expression of the collected cell. This proof-of-principle is demonstrated by sorting and collecting tumor cells from cell line-spiked blood samples as well as a metastatic prostate cancer patient blood sample, identifying them by their surface protein expression and relating them to distinct SMR signal trajectories.
*Equal contribution
HHS Public Access
Author manuscript
Integr Biol (Camb)
. Author manuscript; available in PMC 2017 May 16. Published in final edited form as:Integr Biol (Camb). 2016 May 16; 8(5): 654–664. doi:10.1039/c5ib00284b.
A
uthor Man
uscr
ipt
A
uthor Man
uscr
ipt
A
uthor Man
uscr
ipt
A
uthor Man
uscr
ipt
Introduction
Mechanical properties of single cells have drawn increasing attention in their ability to identify changes in cell phenotype, including those in differentiation and malignancy, and even to provide diagnostic value.1–5 Various techniques used to probe the deformability of single cells include micropipette aspiration,6,7 atomic force microscopy,8,9
microrheology,10–13 optical stretching,14,15 hydrodynamic deformation,16,17 and microfluidic constriction devices.3,18–20 One such microfluidic device is the suspended microchannel resonator (SMR), which, based on the resonance frequency of the sensor, records the position of the center of mass of a cell with up to sub-micron precision as it passes through the constriction (Fig. 1A, B). The resonance frequency signal enables the measurement of the passage time of a cell through the constriction, and can be used to parse out such information as the relative contributions of deformability and surface friction.3 In addition to the position of the cell, the resonance frequency changes are indicative of the buoyant mass of a cell, as a metric of its size.3
In measuring biophysical properties of cells with an unknown identity, it is vitally important to have molecular validation, not only to identify the cells being measured, but to gain insight into deeper molecular underpinnings of the biophysical observations and the cell to cell variation. Although some precise single-cell measurement techniques lend themselves more easily than others to optical imaging simultaneously with the biophysical
measurement,16,21–28 until recently, few of these methods have demonstrated the ability to isolate particular cells of interest for downstream molecular study.29 Meanwhile, passive sorting and bulk filtration methods have been developed, where a general population of cells is collected based on its deformability.30–35 Examples include mechanical filters,
microfluidic margination, and inertial microfluidic devices.30–35 However, using these techniques, precise single-cell deformability properties remain unknown. The variation in molecular characteristics cannot be correlated to the deformability metric of each cell. Here, we present a cell sorting method for the SMR to correlate the single-cell biophysical measurement with the molecular expression of each cell of interest. In particular, we demonstrate this technique in characterizing tumor cells in blood, with a view to better understand the physical properties of circulating tumor cells (CTCs). Although previous studies indicate that epithelial cancer cell lines tend to take longer to pass through constrictions than do blood cells,3,36 the rarity of CTCs has caused studies regarding the physical properties of actual CTCs remain sparse.37,38 Nonetheless, a technique such as the CTC-iChip, which concentrates CTCs by eliminating the majority of erythrocytes and leukocytes, enables the SMR to measure CTCs in spite of its limited throughput (~45 µL/hr). Using this combination of techniques, some cancer patient blood samples were found to have more cells with long passage times (> 10 ms) than did healthy donor blood samples. However, long passage time events may be created by debris, aggregates, or atypical blood cells within the sample. As a proof-of-principle, we address this limitation in measuring tumor cells in processed blood samples, by collecting each long passage time event off-chip and correlating the biophysical SMR measurement to immunofluorescence images.
A
uthor Man
uscr
ipt
A
uthor Man
uscr
ipt
A
uthor Man
uscr
ipt
A
uthor Man
uscr
ipt
Materials and Methods
Suspended Microchannel Resonator for Buoyant Mass and Passage Time Measurements
As previously described, a suspended microchannel resonator (SMR) having a 6 µm wide, 15 µm deep, and 50 µm long constriction was used to measure the buoyant mass (as a metric for size) and passage time (as a metric for deformability) of single cells.3 The resonance frequency of the cantilever sensor, determined by the buoyant mass and position of the cell, is recorded as each cell passes through the sensor (Fig. 1A, B). This enables the assessment of the shape of each cell’s frequency signal, including the cell’s velocity as it deforms into the entrance (entry velocity) and when it transits through the constriction (transit velocity).3 The channel walls were coated with PEG (1 mg/mL; PLL(20)-g[3.5]-PEG(2); Surface Technology) for all experiments in this study.
All data analysis was performed in MATLAB as described previously,3 using the dscatter function (MathWorks File Exchange16) for Fig. 2. The position of the cells in the cantilever sensor used in Fig. 4, were calculated as described previously, where a value of -1
corresponds to the tip and 0 corresponds to the base of the cantilever.3,39 Also, normalized time is the time recorded by the sensor divided by the total length of time the cell takes to pass through it, such that time 0 is when the cell is at the tip of the cantilever and time 1 is when the cell exits the cantilever sensor.
Cell Culture
H1650 and HCC827 cells were obtained and cultured under standard conditions as previously described.3,40,41 PC3 and LNCaP cells were obtained from the American Type Culture Collection. PC3 cells were cultured in DMEM/F-12 medium containing 10% FBS. LNCaP cells were cultured in RPMI (1640) with 10% fetal bovine serum (FBS).
Blood Cell Preparation for Initial Test
Human blood was purchased from Research Blood Components, LLC (Brighton, MA). Mononuclear cells were enriched using Histopaque-1077 (Sigma-Aldrich) and resuspended in 1% (w/v) Kolliphor P188 (Sigma-Aldrich) in phosphate buffered saline (PBS). For the H1650-spiked sample (Fig. 3), H1650 cells were added to the enriched mononuclear leukocytes, resulting in a final concentration of 600,000 cells/mL. The sample was then stained with anti-Cadherin-11 and anti-EpCAM antibodies both conjugated to Alexa Fluor 488 (R&D Systems FAB17901G, Cell Signaling Technology 5198S), and anti-CD45 conjugated to PE-CF594 (BD Biosciences 562279).
Healthy Donor Blood Samples, Spiked Blood Samples, and Cancer Patient Blood Samples Processed in CTC-iChip and Stained prior to SMR Measurement
Healthy donor blood was obtained from healthy volunteers who provided informed consent under an Institutional Review Board (IRB)-approved protocol at the Massachusetts General Hospital (MGH). Patients having a diagnosis of prostate cancer provided informed consent to a separate IRB-approved protocol (DF/HCC 05-300) at MGH to allow blood donation for the study. All methods were carried out in accordance with the approved protocols. Blood samples were processed through the CTC-iChip in negative selection mode at MGH, as
A
uthor Man
uscr
ipt
A
uthor Man
uscr
ipt
A
uthor Man
uscr
ipt
A
uthor Man
uscr
ipt
previously described.42,43 Briefly, the CTC-iChip removes most of the erythrocytes and leukocytes from the blood, leaving an enriched tumor cell sample. For LNCaP- and PC3-spiked samples, the cultured cells were PC3-spiked into whole blood at a concentration of 500 cells/mL prior to processing in the CTC-iChip. After tumor cell enrichment, spiked samples and patient samples (other than Patient 1) were then stained with anti-EpCAM (Cell Signaling Technology 7139) and anti-CD45 (Invitrogen MHCD4520) antibodies. Stained, live samples were then measured in the SMR, while maintained at room temperature in 1% (w/v) Kolliphor P188 in PBS. The Kolliphor nonionic copolymer-based buffer is used in the CTC-iChip protocol to reduce nonspecific cell attachment to tubing and channel walls.43 For each sample, a total of 1–1.8mL of blood equivalent was measured in the SMR.
Cell Sorting Method for SMR
Software was written in LABVIEW to determine the passage time of each cell in real-time, during transit through the SMR. For passage times greater than a user-defined threshold of 10 ms, the computer-controlled pressure regulators automatically stop the flow in the device (Fig. 1C). For Figure 3B only, images of the cells were taken on-chip, in the exit channel of the SMR, immediately after the flow was halted. After successful cell capture was validated, it was deemed no longer necessary to image cells in the SMR exit channel. Thus, for all subsequent experiments (Figs. 4, 5A–C, 6), cells were collected off-chip prior to imaging. To collect the cells after measurement, the output tubing is flushed with 1% Kolliphor in PBS into a 96-well plate, collecting the cells in a 50 µL volume. The cells having fast passage times that did not trigger a collection response were all combined into a 24-well plate for imaging together at the end of the experiment. After collection from the SMR, paraformaldehyde (PFA, made fresh from 16% PFA, Electron Microscopy Sciences 15710) was added to a final concentration of 4%, along with DAPI (Life Technologies D1306, 1.43 µM final concentration) for nuclear staining.
On-chip Fluorescence Detection with the SMR
For experiments shown in Fig. 5D–F, a separate SMR system that measures single-cell buoyant mass was used for on-chip fluorescence detection. Similar to a system described previously, a photomultiplier tube (PMT, H5784-02) was attached to a microscope (Nikon) with a 50x objective (Nikon LU B PLAN ELWD NA 0.55 WD 10.1) to optically access the fluidic channels of the SMR.44 Notably, a significant improvement was made in the fluorescence detection by altering the SMR device design. The new design has a flat (rather than etched) glass layer above a microfluidic channel that is narrower and shallower than in the previous design, providing better, in-focus optical access to individual cells. The added sensitivity allows for higher throughput fluorescence detection of cells as they are moving through the device. Anti-EpCAM and anti-CD45 antibodies directly conjugated to Alexa Fluor 488 (Cell Signaling Technology 5198, BioLegend 304019) were used for
immunofluorescence staining detected by the PMT on-chip. In accordance with
manufacturer specifications, anti-EpCAM was used at a 1:50 dilution, while anti-CD45 was used at a 1:20 dilution.
A
uthor Man
uscr
ipt
A
uthor Man
uscr
ipt
A
uthor Man
uscr
ipt
A
uthor Man
uscr
ipt
Fluorescence Imaging after Cell Collection
For immunofluorescence imaging in the exit channel of the SMR (Fig. 3B), images were acquired on an Edmund Optics monochrome CMOS camera (EO-1312M). After cell collection, fluorescence imaging was carried out on a Nikon Ti inverted microscope at either 20× or 40× magnification (Swanson Biotechnology Center Microscopy Core Facility). The EpCAM expression intensity levels of H1650 cells (Fig. 5A–C, stained with anti-EpCAM directly conjugated to Alexa Fluor 594, Cell Signaling Technology 7319) were quantified from 10× images to obtain a higher depth of field for maximal fluorescence emission collection. Images were acquired using a Photometrics CoolSnap HQ camera or Andor Clara CCD, and were processed using ImageJ.
Results and Discussion
Healthy donor as well as metastatic cancer patient blood samples were measured in an SMR after processing in the CTC-iChip, in order to identify whether there was a difference between their passage time and buoyant mass characteristics, and if so, to specify a gating region for cell collection (Fig. 2).42 In general, the healthy donor blood cells had passage times faster than 10 ms, except in some cases where a few smaller cells (< 50 pg) had longer passage times (> 10 ms) possibly due to debris or stickiness from platelet aggregation (Table 1). Cancer patient blood samples were prepared in the same manner and compared to healthy donor samples (Fig. 2B). Since it was notable that some patient samples had cells with longer passage times, it was of interest to see whether the cells that were larger than 50 pg and had passage times longer than 10 ms were in fact CTCs. Hence, we developed and implemented the cell sorting technique to collect cells having longer passage times and classify each cell based on its surface protein expression.
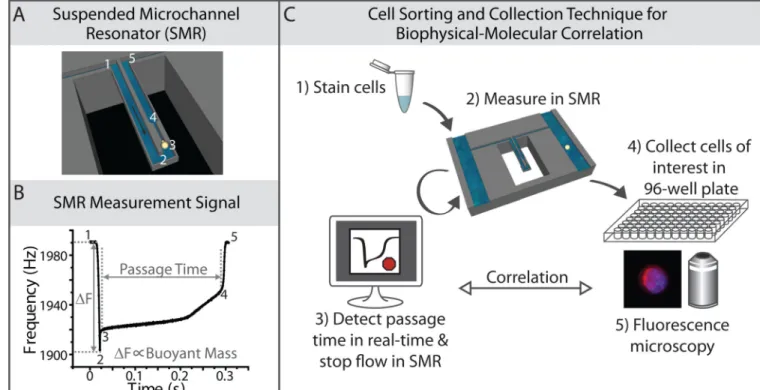
First, to validate the cell sorting technique, H1650 cells (human lung cancer cell line) were spiked into enriched mononuclear blood cells and stained for EpCAM/CDH11 to denote tumor cells, and CD45 to counterstain for leukocytes. The sample was then measured in the SMR (Fig. 3A). The flow in the device was automatically halted by computer-controlled pressure regulators when a long passage time was detected by custom software. To ensure that each long passage time event was indeed triggered by a tumor cell, once the flow was paused in the device, the cell was imaged in the exit channel of the SMR prior off-chip collection (Fig. 3B, see Materials and Methods). Due to the thickness and curvature of the glass on the SMR’s exit channel, only low quality images were obtained, but the staining was apparent and verified that each of the long passage times were caused by individual tumor cells. Then, to obtain higher quality images and to provide functionality for future downstream applications, each cell that had been imaged in the device was subsequently sorted off-chip into a separate well of a 96-well plate, with each well having a final volume of 50 µL. As revealed by fluorescence microscopy of the well plate, one tumor cell was found in each well, indicating that each tumor cell seen in the SMR channel was
successfully captured off-chip (Fig. 3C). In addition to the individual tumor cells, there were some leukocytes in a few of the wells, due to the fact that if some leukocytes pass through the constriction just prior to the tumor cell and have not exited the tubing of the device, they may be flushed into the 96-well plate together with the detected tumor cell. Thus, the purity
A
uthor Man
uscr
ipt
A
uthor Man
uscr
ipt
A
uthor Man
uscr
ipt
A
uthor Man
uscr
ipt
of the collection depends upon the concentration of cells in the sample, which can be adjusted if higher purity is necessary. More specifically, the sample can be diluted in order to ensure collection of single cells. In many applications, an enrichment of the tumor cells may be sufficient, such as to establish a correlation between the molecular staining of the tumor cell to its biophysical passage time and buoyant mass signature. These results demonstrate that we can successfully collect cells based on specific physical properties and observe their particular molecular expression.
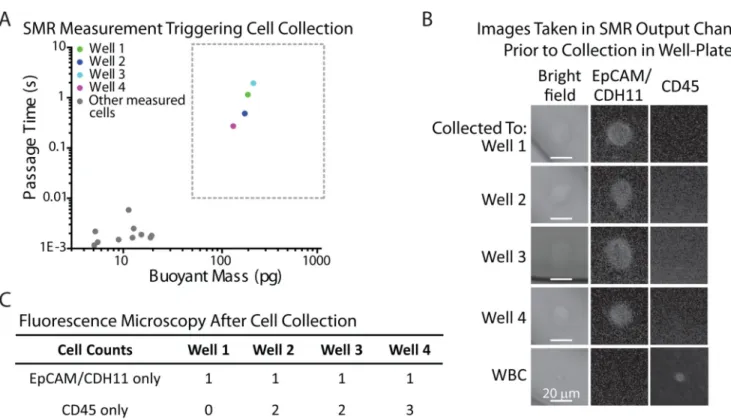
Next, we further tested the sorting method by characterizing human prostate cancer cells (LNCaP and PC3) spiked into whole blood. The spiked samples were processed through the CTC-iChip to enrich for tumor cells (Materials and Methods), stained for cell surface markers EpCAM and CD45, and measured in the SMR (Fig. 4). Cells that had passage times longer than 10 ms were sorted into a 96-well plate. Although we particularly focused on cells larger than 50 pg, a few of the smaller cells causing long passage times were also collected for image analysis. Note that these gating parameters were determined by the healthy donor blood samples measured, as mentioned previously. As listed in Table 2, for the spiked LNCaP cells, four of the five wells collected in the region of interest corresponded to a LNCaP cell. For the spiked PC3 cells, seven out of the nine wells collected corresponded to at least one PC3 cell. Two of the wells contained two PC3 cells, possibly because one of the two had a faster passage time due to being smaller in size or to being more deformable. In both cell lines, there were some tumor cells having passage times faster than 10 ms, and were not collected since they could not be clearly distinguished from blood cells.
Moreover, this technique enables the details of each SMR signal to be related to the protein expression in each cell. Thus, not only the passage time and buoyant mass, but the resonant frequency response denoting the position of the cell’s center-of-mass are recorded, as dictated by the biophysical properties of the cell as it passes through the sensor (Fig. 4C, Materials and Methods). It is interesting to note the relationship between the SMR peak shapes to the imaged cells (Fig. 4D). For both wells L2 and L3, corresponding to LNCaP cells, the signal obtained from the SMR corresponds to the canonical shape for a tumor cell (Fig. 1B).3 In contrast, wells L5 and L6 corresponding to debris, had SMR peak shapes that look markedly different, where the particle spends most of the time adjusting itself to go through the entrance of the constriction. It is possible that debris is introduced into the sample during the various pre-processing steps. Last, well L7 contained an activated neutrophil, and its corresponding SMR peak shape had distinct features of the cell passing through the constriction, unlike other cells having the same buoyant mass. Perhaps this may be indicative of the polymorphonuclear shape of the nucleus altering its position as it transits through the constriction as well as altering its buoyant mass.
Indeed, hierarchical clustering analysis of the positions of the measured cells or particles as they pass through the constriction over time (normalized, Materials and Methods)
demonstrates that particles of similar nature, as identified by fluorescence imaging, can cluster together by the shapes of their SMR signals (Fig. 4E,F). The signals corresponding to LNCaP cells cluster together, whereas the signals corresponding to debris cluster separately, and the activated neutrophil falls in between. Although a more thorough and systematic study would need to be done to identify the causes of each particular detail of the SMR peak
A
uthor Man
uscr
ipt
A
uthor Man
uscr
ipt
A
uthor Man
uscr
ipt
A
uthor Man
uscr
ipt
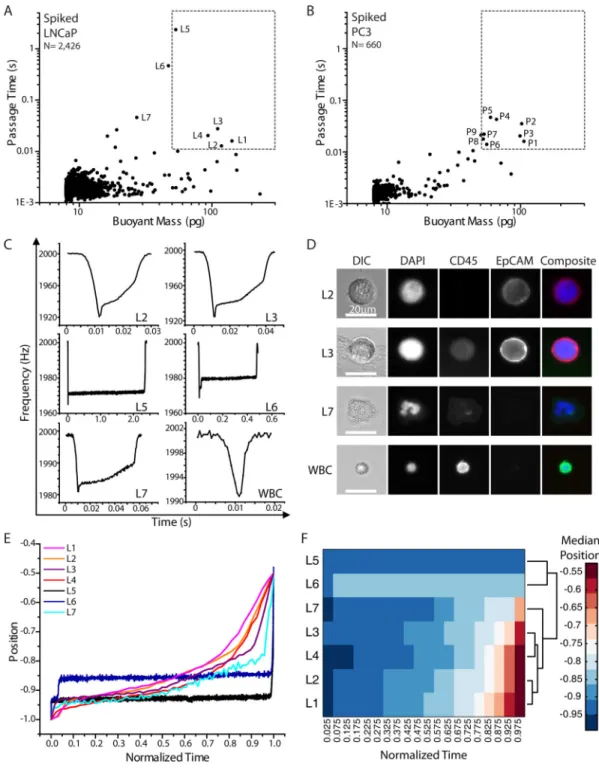
shape, the newly developed method relating each peak to a corresponding cell may help elucidate such details. Cataloging such SMR signals may eventually allow for identification of particles being measured in the device without the need for downstream imaging. Furthermore, this technique also allows us to compare the relative expression of surface proteins of each cell to their passage times and buoyant masses. Previous work has shown that often, tumor cells having a more mesenchymal or metastatic phenotype tend to be more deformable than those having a more epithelial phenotype.1,5,45–49 The presented method now enables a more in-depth study of this relationship on a single-cell level. As a proof-of-principle, H1650 cells that were stained for EpCAM were measured in the SMR, and sorted into separate wells of a 96-well plate for imaging. Fluorescence images were quantified as an indication of relative levels of EpCAM expression. Thus, the additional measurement of single-cell relative surface protein expression level can be added to each single-cell biophysical SMR measurement, including buoyant mass and passage time (Fig. 5A–C). Multiple linear regression analysis was performed on the logarithmic (base 10) values of the output variable (fluorescence intensity) and input variables (buoyant mass and passage time). A logarithmic scale was chosen due to the dependence of the variables on powers of the radius of the cells. The strength of the correlation as given by the coefficient of
determination (R2) is 0.21, which implies that buoyant mass and passage time account for 21% of the variability observed in the labeled EpCAM fluorescence intensity. Removing passage time from the analysis reduced the accounted variable to 14%, indicating that changes in buoyant mass account for more of the changes in fluorescence intensity than do changes in passage time. In addition, there is no statistically significant linear dependence of fluorescence intensity on passage time (p = 0.08), indicating a lack of correlation between EpCAM expression and cell deformability. This preliminary study may suggest that although previous work has shown that mesenchymal cell types are often more deformable than epithelial cell types, the cell-to-cell variation of deformability within each population may not be related to the extent of the epithelial or mesenchymal phenotype in H1650 cells. To rule out the possibility that a cell’s passage through the constriction or its collection procedure altered the EpCAM staining, we employed another method that enabled us to measure live-cell fluorescence intensity on-chip, just before entry into the SMR for measurement of buoyant mass (Fig. 5D–F, Materials and Methods). We found that buoyant mass accounted for 13% of the variability in EpCAM fluorescence intensity (Fig. 5D), which was comparable to what we observed for the off-chip EpCAM measurement. To ensure that the fluorescence intensity measurement of the EpCAM stain was not due to nonspecific binding or instrument noise, H1650 cells were stained for CD45 using
antibodies having the same isotype (mouse IgG1) and conjugated to the same fluorophore as in the anti-EpCAM antibodies (Fig. 5E). Since the majority (98%) of H1650 cells stained for EpCAM had a higher fluorescence intensity than the maximum intensity of those stained for CD45, the regression analysis for EpCAM fluorescence intensity was not meaningfully affected by nonspecific staining or instrument noise. Next, a different lung cancer cell line, HCC827 was stained for EpCAM and demonstrated increased fluorescence intensity, indicating stronger EpCAM expression, as well as a stronger correlation between fluorescence intensity and buoyant mass (Fig. 5F, R2 = 0.35). Moreover, the increased variation seen in the EpCAM expression of H1650 cells compared to that of HCC827 cells
A
uthor Man
uscr
ipt
A
uthor Man
uscr
ipt
A
uthor Man
uscr
ipt
A
uthor Man
uscr
ipt
is consistent with the fact that H1650 cells have been shown to consist of a heterogeneous population of cells, wherein an erlotinib-resistant subpopulation, related to a
CD44highCD24low profile, maintains a more mesenchymal phenotype.50 In addition, the H1650 cell line has been shown to have a higher percentage of CD44highCD24low cells than the HCC827 cell line, indicating reduced heterogeneity in the HCC827 line.50
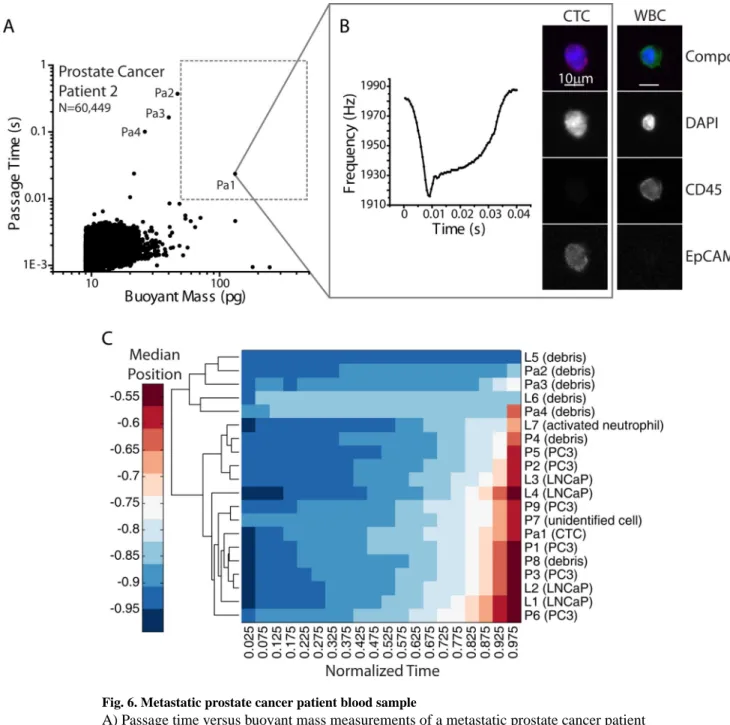
Finally, to test the biophysical-molecular correlation method on primary patient samples, a limited number of metastatic prostate cancer patient blood samples (n=7) were measured following the same protocol. Five samples were determined to have no CTCs. Of the two samples that were confirmed to contain CTCs, only one sample (Patient 2) had a cell in the gating region of interest (Fig. 6). This cell was collected and was found in fact to be a CTC based on its EpCAM+CD45−DAPI+ signature, indicating that there can be CTCs in circulation that are stiff, having long passage times. A few other long passage time events (noted in Fig. 6A), which had smaller buoyant masses than the region of interest, were collected and found to be debris. As introduced in Fig. 4, a combined hierarchical clustering analysis was performed on the SMR peak shapes of the LNCaP, PC3, and prostate cancer patient sample together, demonstrating that the collected CTC clusters together with cells from tumor cell lines based on peak shape alone (Fig. 6C). The rest of the measured patient sample was collected and pooled together in a 24-well plate at the end of the measurement and no CTC was found. Interestingly, we have found that in other cases, some CTCs in circulation may have passage times faster than 10 ms.51 However, this method has enabled us to validate that some long passage times greater than 50 pg may indeed correspond to CTCs.
Conclusion
We have demonstrated the proof-of-principle that we can detect and collect individual cells of interest after measurement in the SMR, using tumor cell-spiked blood samples as well as a metastatic prostate cancer patient sample. After collection, we performed
immunofluorescence imaging on the cells and correlated them to the biophysical measurement made by the SMR. Not only did we measure the passage time and buoyant mass of each cell, but the SMR signal shape held additional information in identifying the type of cell or contaminating particle in the sample. In addition to identifying the types of cells being measured, we were able to assess the extent of correlation between biophysical properties characterized by SMR measurements and molecular signatures, such as relative EpCAM expression, measured by fluorescence microscopy. Finally, we demonstrated the ability to identify and collect a CTC based on its stiff mechanical properties relative to its surrounding blood cells. Although there is no clinical relevance to this study since it is based on one patient sample, high throughput systems that exploit arrays of SMR may enable clinical studies that utilize mechanical biomarkers based on cell size and passage time. The examples presented here demonstrate the ability to relate SMR measurements to molecular information from individual cells. Because cells can now be sorted off-chip based on their physical characteristics, in the future this technique can be extended for other downstream assays, including analysis of DNA or RNA of cells of interest. Moreover, as the SMR platform has already demonstrated the ability to measure multiple physical parameters, the technique may be developed further to collect cells based on their buoyant mass, growth
A
uthor Man
uscr
ipt
A
uthor Man
uscr
ipt
A
uthor Man
uscr
ipt
A
uthor Man
uscr
ipt
rate, or density.44,52,53 Applications include assessment of biophysical properties in relation to the tumor-initiating potential of single cancer cells, activation of immune cells and their downstream function, and drug responses of cells associated with various diseases. The demonstrated cell sorting technique, correlating biophysical to molecular properties, will enable future studies to elucidate how physical changes relate to specific fundamental molecular changes within single cells.
Acknowledgments
We thank Nathan Cermak for providing the basis and groundwork for the LABVIEW code used in the presented method. We also thank Katherine Broderick and Wooseok Kim for preparing and processing the tumor cell line-spiked blood samples, the metastatic prostate cancer patient blood sample, as well as some healthy donor blood samples in the CTC-iChip. We are grateful to Philipp Spuhler for processing healthy donor blood samples in the CTC-iChip. We appreciate the patient and healthy blood donors who participated in this work. We are also thankful to the Koch Institute Swanson Biotechnology Center, including Eliza Vasile at the Microscopy Core Facility. This work was supported by Janssen Pharmaceuticals, Inc., Physical Sciences Oncology Center U54CA143874, CCNE-T grant 26697290-47281-A, Stand Up to Cancer, National Institute of Health P41 Biotechnology Resource Center, and Koch Institute Support Grant P30-CA14051 from the National Cancer Institute (Koch Institute Swanson Biotechnology Center).
References
1. Guck J, et al. Optical deformability as an inherent cell marker for testing malignant transformation and metastatic competence. Biophys. J. 2005; 88:3689–3698. [PubMed: 15722433]
2. Tse HTK, et al. Quantitative diagnosis of malignant pleural effusions by single-cell mechanophenotyping. Sci. Transl. Med. 2013; 5:212ra163.
3. Byun S, et al. Characterizing deformability and surface friction of cancer cells. Proc. Natl. Acad. Sci. 2013; 110:7580–7585. [PubMed: 23610435]
4. Ekpenyong AE, et al. Viscoelastic properties of differentiating blood cells are fate- and function-dependent. PLoS One. 2012; 7:e45237. [PubMed: 23028868]
5. Remmerbach TW, et al. Oral cancer diagnosis by mechanical phenotyping. Cancer Res. 2009; 69:1728–1732. [PubMed: 19223529]
6. Hochmuth RM. Micropipette aspiration of living cells. J. Biomech. 2000; 33:15–22. [PubMed: 10609514]
7. Evans E, Yeung A. Apparent viscosity and cortical tension of blood granulocytes determined by micropipet aspiration. Biophys. J. 1989; 56:151–160. [PubMed: 2752085]
8. Hansma HG, Hoh JH. Biomolecular imaging with the atomic force microscope. Annu. Rev. Biophys. Biomol. Struct. 1994; 23:115–139. [PubMed: 7919779]
9. Radmacher M. Measuring the elastic properties of living cells by the atomic force microscope. Methods Cell Biol. 2002; 68:67–90. [PubMed: 12053741]
10. Bausch AR, Ziemann F, Boulbitch AA, Jacobson K, Sackmann E. Local measurements of viscoelastic parameters of adherent cell surfaces by magnetic bead microrheometry. Biophys. J. 1998; 75:2038–2049. [PubMed: 9746546]
11. Tseng Y, Kole TP, Wirtz D. Micromechanical mapping of live cells by multiple-particle-tracking microrheology. Biophys. J. 2002; 83:3162–3176. [PubMed: 12496086]
12. Wang N, Butler JP, Ingber DE. Mechanotransduction across the cell surface and through the cytoskeleton. Science. 1993; 260:1124–1127. [PubMed: 7684161]
13. Yamada S, Wirtz D, Kuo SC. Mechanics of living cells measured by laser tracking microrheology. Biophys. J. 2000; 78:1736–1747. [PubMed: 10733956]
14. Guck J, Ananthakrishnan R, Mahmood H, Moon TJ, Cunningham CC. The optical stretcher : a novel laser tool to micromanipulate cells. Biophys. J. 2001; 81:767–784. [PubMed: 11463624] 15. Lincoln B, et al. Deformability-based flow cytometry. Cytometry. A. 2004; 59:203–209. [PubMed:
15170599]
A
uthor Man
uscr
ipt
A
uthor Man
uscr
ipt
A
uthor Man
uscr
ipt
A
uthor Man
uscr
ipt
16. Gossett DR, et al. Hydrodynamic stretching of single cells for large population mechanical phenotyping. Proc. Natl. Acad. Sci. 2012; 109:7630–7635. [PubMed: 22547795]
17. Otto O, et al. Real-time deformability cytometry: on-the-fly cell mechanical phenotyping. Nat. Methods. 2015; 12
18. Hou HW, et al. Deformability study of breast cancer cells using microfluidics. Biomed. Microdevices. 2009; 11:557–564. [PubMed: 19082733]
19. Rosenbluth MJ, Lam WA, Fletcher DA. Analyzing cell mechanics in hematologic diseases with microfluidic biophysical flow cytometry. Lab Chip. 2008; 8:1062–1070. [PubMed: 18584080] 20. Zheng Y, Shojaei-Baghini E, Azad A, Wang C, Sun Y. High-throughput biophysical measurement
of human red blood cells. Lab Chip. 2012; 12:2560. [PubMed: 22581052]
21. Oghalai JS, Patel AA, Nakagawa T, Brownell WE. Fluorescence-imaged microdeformation of the outer hair cell lateral wall. J. Neurosci. 1998; 18:48–58. [PubMed: 9412485]
22. Haga H, et al. Elasticity mapping of living fibroblasts by AFM and immunofluorescence observation of the cytoskeleton. Ultramicroscopy. 2000; 82:253–258. [PubMed: 10741677] 23. Cross SE, Jin Y-S, Rao J, Gimzewski JK. Nanomechanical analysis of cells from cancer patients.
Nat. Nanotechnol. 2007; 2:780–783. [PubMed: 18654431]
24. Wilusz RE, DeFrate LE, Guilak F. Immunofluorescence-guided atomic force microscopy to measure the micromechanical properties of the pericellular matrix of porcine articular cartilage. J. R. Soc. Interface. 2012; 9:2997–3007. [PubMed: 22675162]
25. Wilhelm C, Gazeau F, Bacri J-C. Rotational magnetic endosome microrheology: Viscoelastic architecture inside living cells. Phys. Rev. E. 2003; 67:061908.
26. Ananthakrishnan R, et al. Quantifying the contribution of actin networks to the elastic strength of fibroblasts. J. Theor. Biol. 2006; 242:502–516. [PubMed: 16720032]
27. Bow, H.; Abgrall, P.; Han, J. Microfabricated slits in series: a simple platform to probe differences in cell deformability; Twelfth Int. Conf. Miniaturized Syst. Chem. Life Sci; 2008. p. 1199-1201. 28. Bow H, et al. A microfabricated deformability-based flow cytometer with application to malaria.
Lab Chip. 2012; 11:1065–1073. [PubMed: 21293801]
29. Faigle C, et al. A monolithic glass chip for active single-cell sorting based on mechanical phenotyping. Lab Chip. 2015; 15:1267–1275. [PubMed: 25537986]
30. Hou HW, et al. Deformability based cell margination--a simple microfluidic design for malaria-infected erythrocyte separation. Lab Chip. 2010; 10:2605–2613. [PubMed: 20689864] 31. Gossett DR, et al. Label-free cell separation and sorting in microfluidic systems. Anal. Bioanal.
Chem. 2010; 397:3249–3267. [PubMed: 20419490]
32. Beech JP, Holm SH, Adolfsson K, Tegenfeldt JO. Sorting cells by size, shape and deformability. Lab Chip. 2012; 12:1048–1051. [PubMed: 22327631]
33. Hur SC, Henderson-MacLennan NK, McCabe ERB, Di Carlo D. Deformability-based cell classification and enrichment using inertial microfluidics. Lab Chip. 2011; 11:912–920. [PubMed: 21271000]
34. Sollier E, et al. Size-selective collection of circulating tumor cells using Vortex technology. Lab Chip. 2014; 14:63–77. [PubMed: 24061411]
35. Hou HW, et al. Isolation and retrieval of circulating tumor cells using centrifugal forces. Sci. Rep. 2013; 3:1259. [PubMed: 23405273]
36. Vona G, et al. Isolation by size of epithelial tumor cells: a new method for the
immunomorphological and molecular characterization of circulating tumor cells. Am. J. Pathol. 2000; 156:57–63. [PubMed: 10623654]
37. Chen C-L, et al. Single-cell analysis of circulating tumor cells identifies cumulative expression patterns of EMT-related genes in metastatic prostate cancer. Prostate. 2013; 73:813–826. [PubMed: 23280481]
38. Osmulski P, et al. Nanomechanical Biomarkers of Single Circulating Tumor Cells for Detection of Castration Resistant Prostate Cancer. Prostate. 2014; 74:1297–1307. [PubMed: 25065737] 39. Dohn S, Svendsen W, Boisen A, Hansen O. Mass and position determination of attached particles
on cantilever based mass sensors. Rev. Sci. Instrum. 2007; 78:3–6.
A
uthor Man
uscr
ipt
A
uthor Man
uscr
ipt
A
uthor Man
uscr
ipt
A
uthor Man
uscr
ipt
40. Stott SL, et al. Isolation of circulating tumor cells using a microvortex-generating herringbone-chip. Proc. Natl. Acad. Sci. 2010; 107:18392–18397. [PubMed: 20930119]
41. Walter K, et al. DNA methylation profiling defines clinically relevant biological subsets of non-small cell lung cancer. Clin. Cancer Res. 2012; 18:2360–2373. [PubMed: 22261801]
42. Ozkumur E, et al. Inertial focusing for tumor antigen-dependent and -independent sorting of rare circulating tumor cells. Sci. Transl. Med. 2013; 5:179ra47.
43. Karabacak NM, et al. Microfluidic, marker-free isolation of circulating tumor cells from blood samples. Nat. Protoc. 2014; 9:694–710. [PubMed: 24577360]
44. Son S, et al. Direct observation of mammalian cell growth and size regulation. Nat. Methods. 2012; 9:910–912. [PubMed: 22863882]
45. Xu W, et al. Cell stiffness is a biomarker of the metastatic potential of ovarian cancer cells. PLoS One. 2012; 7:e46609. [PubMed: 23056368]
46. Swaminathan V, et al. Mechanical stiffness grades metastatic potential in patient tumor cells and in cancer cell lines. Cancer Res. 2011; 71:5075–5080. [PubMed: 21642375]
47. Coughlin MF, et al. Cytoskeletal stiffness, friction, and fluidity of cancer cell lines with different metastatic potential. Clin. Exp. Metastasis. 2013; 30:237–250. [PubMed: 22961212]
48. Chen C-L, et al. Single-cell analysis of circulating tumor cells identifies cumulative expression patterns of EMT-related genes in metastatic prostate cancer. Prostate. 2013; 73:813–826. [PubMed: 23280481]
49. Zhang W, et al. Microfluidics separation reveals the stem-cell-like deformability of tumor-initiating cells. Proc. Natl. Acad. Sci. U. S. A. 2012; 109:18707–18712. [PubMed: 23112172]
50. Yao Z, et al. TGF-beta IL-6 axis mediates selective and adaptive mechanisms of resistance to molecular targeted therapy in lung cancer. Proc. Natl. Acad. Sci. U. S. A. 2010; 107:15535–15540. [PubMed: 20713723]
51. Shaw Bagnall J, et al. Deformability of Tumor Cells versus Blood Cells. Sci. Rep. 2015; 5:18542. [PubMed: 26679988]
52. Burg TP, et al. Weighing of biomolecules, single cells and single nanoparticles in fluid. Nature. 2007; 446:1066–1069. [PubMed: 17460669]
53. Grover WH, et al. Measuring single-cell density. Proc. Natl. Acad. Sci. 2011; 108:10992–10996. [PubMed: 21690360]
A
uthor Man
uscr
ipt
A
uthor Man
uscr
ipt
A
uthor Man
uscr
ipt
A
uthor Man
uscr
ipt
Insight, Innovation, and Integration
Although the mechanical properties of single cells have been associated with cell phenotype and malignancy, it has been difficult to directly correlate each cell’s biophysical characteristics to its molecular traits. Here, the integration of a cell sorting method with a suspended microchannel resonator enables precision measurements of single-cell buoyant mass and deformability to be correlated to each cell’s surface protein expression assessed by fluorescence imaging after off-chip collection. Using this technique, we sort and collect tumor cells from cell line samples, blood samples spiked with cell lines, and a metastatic prostate cancer patient blood sample based on their passage times through a constriction, providing insight regarding the relationship between each cell’s relative EpCAM expression to its distinct biophysical characteristics.
A
uthor Man
uscr
ipt
A
uthor Man
uscr
ipt
A
uthor Man
uscr
ipt
A
uthor Man
uscr
ipt
Fig. 1. Cell sorting and collection method for biophysical-molecular correlation
A) A diagram demonstrating a single cell passing through a suspended microchannel resonator (SMR), squeezing through a constriction. B) An example of the raw resonance frequency signal obtained from a typical cultured tumor cell (an H1650 lung cancer cell in this case) as it transits through the SMR sensor. The height of the frequency shift is proportional to the buoyant mass of the cell, while the width of peak, as it transits from position 3 to position 4, corresponds to the passage time of the cell through the constriction. The numbers in (B) correspond to the position of the cell as labeled in (A). C) A schematic diagram of the cell sorting and collection technique, showing that cells are stained and measured in an SMR. Once the software detects a passage time in the range of interest, it stops the fluid flow in the device, allowing for subsequent collection of the cell off-chip, into a 96-well plate for downstream fluorescence microscopy.
A
uthor Man
uscr
ipt
A
uthor Man
uscr
ipt
A
uthor Man
uscr
ipt
A
uthor Man
uscr
ipt
Fig. 2. Healthy donor versus metastatic prostate cancer patient blood sample
A) Passage time vs. buoyant mass measurements of a healthy donor blood sample, after having been depleted of most of the erythrocytes and leukocytes. An equivalent volume of ~280 µL of blood was measured. B) Passage time vs. buoyant mass measurements of a metastatic prostate cancer patient blood sample, having been depleted of most of the erythrocytes and leukocytes. An equivalent volume of ~360 µL of blood was measured. The difference in the number of cells measured was due to different efficiencies of the
preprocessing steps in depleting the erythrocytes and leukocytes from the samples (Materials and Methods). Colors correspond to the density of data points, with red being the highest and blue being the lowest density.
A
uthor Man
uscr
ipt
A
uthor Man
uscr
ipt
A
uthor Man
uscr
ipt
A
uthor Man
uscr
ipt
Fig. 3. Validation of single tumor cell detection and collection in 96-well plate
A) Passage time vs. buoyant mass measurements of H1650 cells spiked into enriched mononuclear blood cells. The cells included in the boxed region (> 50pg buoyant mass & > 0.01 s passage time) were imaged on-chip (B) as well as collected off-chip for additional verification (C). Gray dots outside of the boxed region represent blood cells that were also measured in the SMR during the experiment. B) Images taken on-chip, in the exit channel of the SMR, immediately after custom software detected a long passage time signal. It was confirmed that all detected SMR signals falling into the boxed region of interest (A) corresponded to an H1650 tumor cell by immunofluorescence imaging (EpCAM/CDH11+ and CD45−). C) Each detected H1650 cell was successfully collected off-chip in a 96-well plate. Based on additional immunofluorescence imaging of each well, a tumor cell was identified in each well (EpCAM/CDH11+ and CD45−), along with a few leukocytes (CD45+ and EpCAM/CDH11−).
A
uthor Man
uscr
ipt
A
uthor Man
uscr
ipt
A
uthor Man
uscr
ipt
A
uthor Man
uscr
ipt
Fig. 4. Spiked blood samples and SMR peak shape correlation with immunofluorescence staining A) A blood sample spiked with LNCaP cells was measured in the SMR. The labeled measurement events were collected off-chip (L1–L7). B) A blood sample spiked with PC3 cells was measured in the SMR. The labeled measurement events were collected off-chip (P1–P9). In both panels, the dotted area corresponds to the region of interest (> 50 pg and > 0.01 s). C) Raw SMR frequency signal versus time acquired for each measurement event, demonstrating different peak shapes for different types of cells or particles being measured. Labels correspond to those in (D) as well as in (A). Note that the axes are different for each
A
uthor Man
uscr
ipt
A
uthor Man
uscr
ipt
A
uthor Man
uscr
ipt
A
uthor Man
uscr
ipt
peak for better visualization of the details of each peak shape. D) Immunofluorescence images of cells corresponding different peak shapes from (C), with L2 and L3 being LNCaP cells, L7 being an activated neutrophil, and WBC being a typical white blood cell. Note that the intensity of EpCAM for L3 was reduced to avoid saturation, as it had a much higher intensity than all other imaged cells. E) The position of the cell or particle in the SMR as it passes through the constriction (−1 corresponds to the tip, and 0 corresponds to the base of the cantilever) is plotted versus normalized time (0 corresponds to when the cell reaches the tip of the cantilever and 1 corresponds to the time the cell exits from the cantilever) for each of the SMR signals that were collected for visual analysis. F) The median positions of each measured signal within each bin of normalized time are plotted as a heat map. A
dendrogram derived from hierarchical clustering analysis is shown to the right of the heat map, demonstrating that the shape of the SMR signals can be categorized into different groups, potentially related to the type of particle measured, as identified by fluorescence imaging.
A
uthor Man
uscr
ipt
A
uthor Man
uscr
ipt
A
uthor Man
uscr
ipt
A
uthor Man
uscr
ipt
Fig. 5. SMR biophysical measurement correlation with quantified immunofluorescence levels A–C) H1650 cells stained for EpCAM were measured by the SMR and individually collected off-chip for assessment by fluorescence microscopy. A) Passage time versus buoyant mass for H1650 cells stained for EpCAM (N = 46 cells, simple linear regression R2 = 0.63). B) From the same data set as in (A) but showing EpCAM fluorescence intensity versus buoyant mass (simple linear regression R2 = 0.14). C) From the same data set as in (A) but showing EpCAM fluorescence intensity versus passage time (simple linear regression R2 = 0.02). D–F) The fluorescence intensities of H1650 and HCC827 cells stained for surface protein expression were assessed on-chip on an SMR via a PMT. D) Fluorescence intensity versus buoyant mass of H1650 cells stained for EpCAM (N = 400, R2 = 0.13). E) Fluorescence intensity versus buoyant mass of H1650 cells stained for CD45, as a control for nonspecific antibody binding (N = 337, R2 = 0.31). Note that cells having fluorescence intensities below the limit of detection were not included. F) Fluorescence intensity versus buoyant mass of HCC827 cells stained for EpCAM (N = 401, R2 = 0.35).
A
uthor Man
uscr
ipt
A
uthor Man
uscr
ipt
A
uthor Man
uscr
ipt
A
uthor Man
uscr
ipt
Fig. 6. Metastatic prostate cancer patient blood sample
A) Passage time versus buoyant mass measurements of a metastatic prostate cancer patient blood sample, after pre-preprocessing in the CTC-iChip. An equivalent total of 1.8 mL of blood was measured in the SMR. The region of interest (buoyant mass greater than 50pg and passage time greater than 10ms) is shown as a dotted gray box. B) One cell that fell in the region of interest that corresponded to a tumor cell-like frequency signal in the SMR as well was collected off-chip and imaged. Fluorescence images indicate that the SMR measurement correlated to a CTC (EpCAM positive, CD45 negative). Images of a white blood cell (WBC) from the remainder of the sample are shown for comparison. False color overlays were applied to composite fluorescence images. C) Hierarchical clustering analysis was performed for the SMR peak trajectories of cells collected from the patient sample, as
A
uthor Man
uscr
ipt
A
uthor Man
uscr
ipt
A
uthor Man
uscr
ipt
A
uthor Man
uscr
ipt
demarcated in (A), combined with cells collected in Fig. 4. The patient CTC (Pa1) clusters together with other cells from prostate tumor cell lines.
A
uthor Man
uscr
ipt
A
uthor Man
uscr
ipt
A
uthor Man
uscr
ipt
A
uthor Man
uscr
ipt
A
uthor Man
uscr
ipt
A
uthor Man
uscr
ipt
A
uthor Man
uscr
ipt
A
uthor Man
uscr
ipt
T ab le 1 Healthy donor blood samples measured in an SMR
Subjects Equi v alent Blood V olume (µL) T otal Number of SMR P eaks Number of SMR P eaks with P assage T ime > 0.01s All > 50 pg > 100 pg Health y 1 360 2791 0 0 0 Health y 2 200 4688 0 0 0 Health y 3 280 5509 0 0 0 Health y 4 400 3261 2 0 0 Health y 5 400 15977 1 0 0
A
uthor Man
uscr
ipt
A
uthor Man
uscr
ipt
A
uthor Man
uscr
ipt
A
uthor Man
uscr
ipt
Table 2Collected measurement events from cell line-spiked blood samples
For cells to be considered positive for CD45 or EpCAM, they had to have a clear ring of fluorescence, indicating surface expression of the protein. If no clear ring of fluorescence was present at the boundary of the cell, general fluorescence was considered to be background, nonspecific fluorescence. WBC = white blood cell.
Spiked Cells
Well Label of Collected Peak
# Cells Well Content Description
LNCaP L1 2 1 DAPI−CD45−EpCAM+ (LNCaP)
1 DAPI+CD45+EpCAM− (Unidentified WBC)
L2 1 DAPI+CD45−EpCAM+ (LNCaP)
L3 1 DAPI+CD45−EpCAM+ (LNCaP)
L4 1 DAPI+CD45−EpCAM+ (LNCaP)
L5 0 Debris
L6 0 Debris (Not in region of interest)
L7 1 DAPI+CD45−EpCAM−
(Activated neutrophil, not in region of interest)
PC3 P1 1 DAPI+CD45−EpCAM+ (PC3) P2 2 2 DAPI+CD45−EpCAM+ (PC3) P3 1 DAPI+CD45−EpCAM+ (PC3) P4 0 Debris P5 1 DAPI+CD45−EpCAM+ (PC3) P6 1 DAPI+CD45−EpCAM+ (PC3)
P7 1 DAPI+CD45−EpCAM− (Unidentified cell)
P8 0 Debris