ARTICLE
Identification of particular groups of microRNAs
that positively or negatively impact on beta cell
function in obese models of type 2 diabetes
Valeria Nesca&Claudiane Guay&Cécile Jacovetti&
Véronique Menoud&Marie-Line Peyot&
D. Ross Laybutt&Marc Prentki&Romano Regazzi
Received: 19 April 2013 / Accepted: 19 June 2013 / Published online: 11 July 2013 # Springer-Verlag Berlin Heidelberg 2013
Abstract
Aims/hypothesis MicroRNAs are key regulators of gene ex-pression involved in health and disease. The goal of our study was to investigate the global changes in beta cell microRNA expression occurring in two models of obesity-associated type 2 diabetes and to assess their potential con-tribution to the development of the disease.
Methods MicroRNA profiling of pancreatic islets isolated from prediabetic and diabetic db/db mice and from mice fed a high-fat diet was performed by microarray. The functional impact of the changes in microRNA expression was assessed by reproducing them in vitro in primary rat and human beta cells.
Results MicroRNAs differentially expressed in both models of obesity-associated type 2 diabetes fall into two distinct categories. A group including 132, 184 and miR-338-3p displays expression changes occurring long before the onset of diabetes. Functional studies indicate that these ex-pression changes have positive effects on beta cell activities
and mass. In contrast, modifications in the levels of miR-34a, miR-146a, miR-199a-3p, miR-203, miR-210 and miR-383 pri-marily occur in diabetic mice and result in increased beta cell apoptosis. These results indicate that obesity and insulin resis-tance trigger adaptations in the levels of particular microRNAs to allow sustained beta cell function, and that additional microRNA deregulation negatively impacting on insulin-secreting cells may cause beta cell demise and diabetes manifestation.
Conclusions/interpretation We propose that maintenance of blood glucose homeostasis or progression toward glucose in-tolerance and type 2 diabetes may be determined by the balance between expression changes of particular microRNAs. Keywords Apoptosis . Beta cell . Diabetes . High-fat diet . Insulin resistance . MicroRNA . Pancreatic islet . Obesity . Secretion
Abbreviations
cMET Met proto-oncogene (hepatocyte growth factor
receptor)
GSK-3β Glycogen synthase kinase 3β
HFD High-fat diet
miRNA microRNA
mTOR Mammalian target of rapamycin
PRL Prolactin
qRT-PCT Quantitative RT-PCR
Introduction
Type 2 diabetes is characterised by insulin resistance of target tissues and insufficient insulin secretion from pancre-atic beta cells to meet the organism’s needs. Insulin resis-tance is normally compensated by expansion of the beta cell
mass and a rise in the insulin secretory activity [1]. However,
Valeria Nesca and Claudiane Guay contributed equally to this work. Electronic supplementary material The online version of this article (doi:10.1007/s00125-013-2993-y) contains peer-reviewed but unedited supplementary material, which is available to authorised users. V. Nesca
:
C. Guay:
C. Jacovetti:
V. Menoud:
R. Regazzi (*) Department of Fundamental Neurosciences, Faculty of Biology and Medicine, University of Lausanne, Rue du Bugnon 9, CH-1005 Lausanne, Switzerlande-mail: [email protected] M.<L. Peyot
:
M. PrentkiMolecular Nutrition Unit and the Montreal Diabetes Research Center at the CRCHUM and the Departments of Nutrition and Biochemistry, University of Montreal, Montreal, QC, Canada D. R. Laybutt
Diabetes and Obesity Research Program, Garvan Institute of Medical Research, St Vincent’s Hospital, Sydney, NSW, Australia
in predisposed individuals this compensatory process fails, resulting in beta cell dysfunction, eventually accompanied by reduction of the beta cell mass and type 2 diabetes
manifesta-tion [2]. A better knowledge of the molecular mechanisms
underlying beta cell adaptation and failure will be instrumental for designing new strategies to prevent or treat this disease.
MicroRNAs (miRNAs) are small non-coding RNAs that play central roles in a number of physiological and pathological
processes [3]. Several studies have shown that miRNAs
partic-ipate in the control of beta cell differentiation, function and mass. These non-coding RNAs regulate insulin production by directly or indirectly affecting the expression of key transcrip-tion factors and they contribute to fine-tuning of hormone release by modulating the levels of important components of
the beta cell secretory machinery [4]. The expression of several
miRNAs is affected by prolonged exposure to elevated con-centrations of glucose, NEFA and proinflammatory cytokines
[4]. Moreover, alterations in the levels of many islet miRNAs
have been reported in different models of diabetes [5–9].
However, the functional impact of these miRNA expression changes and their potential role in the development of diabetes were, in most cases, not explored.
In this study, we analysed the global variations in islet miRNA expression in prediabetic and diabetic db/db mice
[10] and in mice fed a high-fat diet (HFD) [11]. Differentially
expressed miRNAs in these models of obesity-associated dia-betes were systematically investigated for their effects on rat and human beta cell function and for their impact on cell survival on chronic exposure to pro-apoptotic conditions. The results indicate that specific changes in islet miRNA expression in prediabetic and diabetic states reflect the coexistence of adaptive processes elicited to compensate insulin resistance and of pathological reactions promoting beta cell failure. The balance between these opposing phenomena is likely to deter-mine progression from normoglycaemia to hyperglycaemic states and the manifestation of diabetes.
Methods
Materials TNFα and INFγ were obtained from R&D Systems (Minneapolis, MN, USA). IL-1β, prolactin (PRL), exendin-4 and palmitate were purchased from Sigma-Aldrich (St Louis, MO, USA).
Animals Prediabetic (6 weeks old) and diabetic (14–20 weeks old) C57BL/KsJ db/db mice and age-matched C57BL/KsJ control animals were obtained from the Garvan Institute
breeding colonies (Sydney, NSW, Australia) [10].
Five-week-old male C57BL/6 mice were purchased from Charles River Laboratories (Saint-Constant, QC, Canada) and fed a normal diet or HFD (Bio-Ser Diet number F3282, Frenchtown, NJ, USA; 60% [wt/wt] energy from fat) for
8 weeks as described [11]. Male Wistar rats were purchased
from Charles River Laboratories (L’Arbresle, France). All
animal procedures were performed in accordance with National Institutes of Health (NIH) guidelines and were ap-proved by the respective Australian, Canadian and Swiss research councils and veterinary offices.
Microarray profiling Total RNAwas isolated with the mirVana RNA isolation kit (Ambion, Austin, TX, USA) from islets of C57BL/KsJ db/db mice or control animals. Total RNA from islets of C57BL/6 mice fed a normal diet or HFD was isolated with the miRNeasy kit (Qiagen, Hombrechtikon, Switzerland). Global miRNA expression profiling was carried out at the Genomic Technologies Facility of the University of Lausanne using miRNA gene microarrays (Agilent Technologies, Morges, Switzerland). Microarrays included probes for mouse miRNAs
listed onwww.mirbase.org/(release 14, 2009).
Isolation and culture of dissociated islet cells Pancreatic islets
were isolated as described previously [12] by collagenase
diges-tion followed by purificadiges-tion on a Histopaque (Sigma-Aldrich) density gradient. The islets were first cultured overnight in RPMI 1640 Glutamax medium (Invitrogen, Carlsbad, CA, USA) supplemented with 10% (vol./vol.) FCS (Amimed, BioConcept, Allschwill, Switzerland), 50 U/ml penicillin,
50μg/ml streptomycin, 1 mmol/l Na pyruvate and 250 μmol/l
HEPES, and then dissociated by incubation with trypsin (5 mg/ml
at 37°C for 4–5 min). Human pancreatic islets were obtained
from the Cell Isolation and Transplantation Center (University of
Geneva), through the ECIT ‘Islets for Research’ distribution
programme sponsored by the JDRF. The use of human islets was approved by the Geneva institutional Ethics Committee. Dissociated human islet cells prepared using the procedure de-scribed above were cultured in CMRL medium (Invitrogen) supplemented with 10% (vol./vol.) FCS, 100 U/ml penicillin,
100μg/ml streptomycin, 2 mmol/l glutamine and 250 μmol/l
HEPES. Detailed information about the human islet preparations used in this study is presented in electronic supplementary
ma-terial (ESM) Table1.
MIN6B1 cell culture The murine insulin-secreting cell line
MIN6B1 [13] was cultured at a density of 1.5×10⁵cells/cm2
in DMEM-Glutamax medium (Invitrogen) supplemented
with 15% (vol./vol.) FCS, 50 U/ml penicillin, 50 μg/ml
streptomycin, and 70μmol/l β-mercaptoethanol.
Transfection and modulation of miRNA levels MIN6B1 and dissociated rat or human islet cells were transfected with Lipofectamine 2000 (Invitrogen) with RNA oligonucleotide duplexes (Eurogentec, Seraing, Belgium) corresponding to the mature miRNA sequence (overexpression) or with single-stranded miScript miRNA inhibitors (Qiagen, Hombrechtikon,
A custom-designed small interfering (si)RNA duplex directed against green fluorescent protein (sense 5′-GACGUAAACG
GCCACAAGUUC-3′ and antisense 5′-ACUUGUGGCCGU
UUACGU CGC-3′) and the miScript miRNA reference inhib-itor (Qiagen) were used as negative controls for miRNA overexpression and downregulation, respectively.
Measurement of miRNA and mRNA expression Mature miRNA expression was assessed with the miRCURY
LNATMUniversal RT MicroRNA PCR kit (Exiqon, Vedbaek,
Denmark). Measurement of the levels of putative target mRNAs was performed by conventional reverse transcription (Promega, Dübendorf, Switzerland) followed by quantitative RT-PCR (qRT-PCR; Biorad, Reinach, Switzerland) with custom-designed primers (Microsynth, Balgach, Switzerland), details of which are available on request. MiRNA expression was normalised to the level of U6 or miR-7 (an islet-specific miRNA used as internal control) while mRNA expression was normalised to 18S.
Insulin secretion At 2 days after transfection, MIN6B1 or dissociated rat islet cells were pre-incubated for 30 min at 37°C in Krebs buffer (127 mmol/l NaCl, 4.7 mmol/l KCl,
1 mmol/l CaCl2, 1.2 mmol/l KH2PO4, 1.2 mmol/l MgSO4,
5 mmol/l NaHCO3, 0.1% [wt/vol.] BSA, 25 mmol/l HEPES,
pH 7.4) containing 2 mmol/l glucose. The pre-incubation me-dium was discarded and the cells incubated for 45 min in the same buffer (basal conditions). After collecting the supernatant fractions, the cells were incubated for 45 min in Krebs buffer containing 20 mmol/l glucose (stimulatory conditions). The incubation medium was collected and total cellular insulin contents recovered in acidified ethanol (75% [vol./vol.] ethanol, 0.55% [vol./vol.] HCl). The amount of insulin in the samples was determined using an insulin enzyme immunoassay kit (SPI-Bio, Bertin Pharma, Montigny le Bretonneux, France). Cell death assessment Transfected MIN6B1, rat or human
dissociated islet cells were incubated with 1μg/ml Hoechst
33342 (Invitrogen) for 1 min. The fractions of cells (at least
1×10³per condition) displaying pycnotic nuclei were scored
under fluorescence microscopy (AxioCam MRc5; Zeiss, Feldbach, Switzerland). Apoptosis was triggered by expos-ing the cells to cytokines (30 ng/ml INFγ, 10 ng/ml TNFα and 0.1 ng/ml IL-1β) for 24 h or to medium (5% [vol./vol.] FCS) supplemented with 0.5 mmol/l palmitate bound to
0.5% [wt/vol.] BSA [15] for 48 h.
Proliferation assay Transfected MIN6B1 or dissociated islet
cells cultured on poly-L-lysine-coated glass cover slips were
fixed with ice-cold methanol and permeabilised with 0.5% (wt/vol.) saponin (Sigma-Aldrich, St Louis, MO, USA). The cover slips were incubated with antibodies against Ki67 (1:500) (Abcam, Cambridge, UK) and insulin (1:500)
(Millipore, Zug, Switzerland) and then with anti-rabbit Alexa-Fluor-488 and anti-mouse Alexa-Fluor-555 antibodies (Invitrogen). At the end of the incubation, the cover slips were washed with PBS containing Hoechst 33342 (Invitrogen) and
images of at least 1×10³cells per condition were collected
using a fluorescence microscope. PRL (500 ng/ml for 48 h) was used as positive control.
Protein extraction and western blotting Protein lysates (30–
50μg) from MIN6B1 cells prepared as described previously
[9] were separated on polyacrylamide gels and transferred to
polyvinylidine fluoride membranes. The membranes were
incubated overnight with antibodies against granuphilin [16]
(1:2,000); mammalian target of rapamycin (mTOR; 2972, 1:1,000 Cell Signaling, Danvers, MA, USA), met proto-oncogene (hepatocyte growth factor receptor) (cMET; Cell Signaling, 3127, 1:1,000) and glycogen synthase kinase 3β (GSK-3β; Cell Signaling 9315, 1:1,000). Antibodies against α-tubulin (T9026, 1:10,000, Sigma-Aldrich) and actin (Clone C4 MAB1501, 1:15,000, Millipore) were used to verify equal loading. After exposure to IRDye (Li-Cor Biosciences, Bad Homburg, Germany) or horseradish-peroxidase-coupled sec-ondary antibodies for 1 h, the bands were visualised via the Odyssey imaging system (Li-Cor Biosciences) and chemilumi-nescence (GE Healthcare Europe, Glattbrugg, Switzerland), re-spectively. Band intensity was quantified by ImageJ software. Statistical analysis Statistical differences were assessed using a Student’s t test or, for multiple comparisons, one-way ANOVA of the means, followed by a post-hoc Dunnett test (SAS statistical package; SAS, Carry, NC, USA).
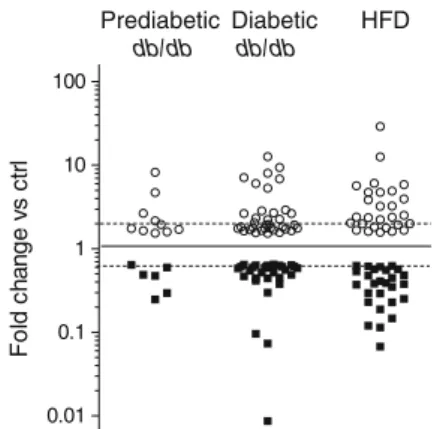
Prediabetic db/db db/db Diabetic HFD 0.01 0.1 1 10 100 F o ld c hang e vs c tr l
Fig. 1 miRNAs differentially expressed in pancreatic islets of animal models of type 2 diabetes. Pancreatic islets were isolated from predia-betic (6 weeks old) and diapredia-betic (14–20 weeks old) db/db mice and from HFD-fed mice. miRNA expression levels were analysed by microarray. Data are expressed as fold changes vs the corresponding controls and are presented on a logarithmic scale (log10). Only miRNAs displaying
increases (white circles) or decreases (black squares) of at least 1.5 fold (p≤0.05) are plotted. Dashed lines correspond to a twofold change. Ctrl, control
Results
Islet miRNA expression in rodent models of type 2 diabetes To investigate the contribution of miRNAs to beta cell dysfunc-tion and the development of type 2 diabetes, we performed global miRNA expression profiling in pancreatic islets obtained from: db/db mice, which lack the leptin receptor and develop severe obesity associated with type 2 diabetes
[10, 17]; and diet-induced obese mice, which display mild
hyperglycaemia and beta cell dysfunction after being fed an
HFD for 8 weeks [11]. The characteristics of the animals used
in this study are presented in ESM Tables2–4. We identified
more than 60 differentially expressed miRNAs in db/db and HFD-fed mice islets compared with their respective controls,
with overlapping changes in the two models (Fig.1).
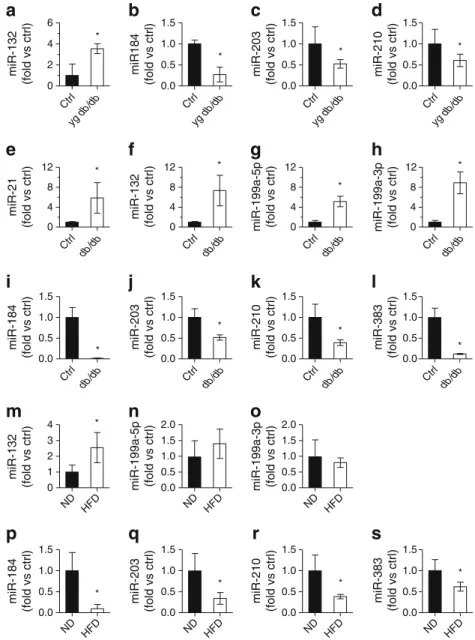
For db/db mice, miRNA expression was determined in both prediabetic (6 weeks old) and diabetic (14–20 weeks
old) animals. In prediabetic mice, the miRNAs displaying the most striking changes were miR-132, with expression increasing by 8.2-fold, and miR-210, miR-184 and miR-203, for which expression decreased by 4.0-, 3.4- and 2.0-fold,
respectively (ESM Table5). In agreement with our previous
findings [9], the islets of prediabetic db/db mice contained
lower levels of miR-338-3p. The reduction of miR-210 and miR-184 was more dramatic in the islets of overtly diabetic db/db mice (10.4- and 115-fold decrease, respectively), whereas upregulation of miR-132 and downregulation of miR-203 and miR-338-3p remained approximately constant
in prediabetic and diabetic animals (ESM Tables5and6). In
addition to these changes, the islets of adult diabetic mice were characterised by alterations in the levels of additional miRNAs, including an upregulation of miR-199a-5p (12.6-fold) and miR-199a-3p (9.4-(12.6-fold), a decline of miR-383
(13.7-fold) and, as previously reported [6], an increase of miR-34a
ND HFD 0.0 0.5 1.0 1.5 ND HFD 0.0 0.5 1.0 1.5 ND HFD 0.0 0.5 1.0 1.5 ND HFD 0.0 0.5 1.0 1.5 0 1 2 3 4 0.0 0.5 1.0 1.5 0.0 0.5 1.0 1.5 0.0 0.5 1.0 1.5 0 4 8 12 0 4 8 12 0 4 8 12 Ctrl 0.0 0.5 1.0 1.5 0 4 8 12 Ctrl 0.0 0.5 1.0 1.5 Ctrl 0.0 0.5 1.0 1.5 * * * * * * * * * * * * * * * * * Ctrl yg db /db yg db /db yg db /db yg db /db 0 2 4 6
a
b
c
d
e
f
g
h
i
j
k
m
n
o
l
p
q
r
s
miR-132 (fold vs ctrl) 0.0 0.5 1.0 1.5 0.0 0.5 1.0 1.5 2.0 0.0 0.5 1.0 1.5 2.0 miR184(fold vs ctrl) miR-203 (fold vs ctrl) miR-210 (fold vs ctrl)
miR-21
(fold vs ctrl) miR-132 (fold vs ctrl) miR-199a-5p (fold vs ctrl) miR-199a-3p (fold vs ctrl)
miR-184
(fold vs ctrl) miR-203 (fold vs ctrl) miR-210 (fold vs ctrl) miR-383 (fold vs ctrl)
miR-199a-3p (fold vs ctrl) miR-199a-5p (fold vs ctrl) miR-132 (fold vs ctrl) miR-383 (fold vs ctrl) miR-210 (fold vs ctrl) miR-203 (fold vs ctrl) miR-184 (fold vs ctrl) Ctrl Ctrl Ctrl Ctrl db/db db/db db/db db/db Ctrl Ctrl Ctrl db/db Ctrl db/db db/db db/db ND HFD ND HFD ND HFD
Fig. 2 Changes in miRNA expression in islets of type 2 diabetes animal models. The expression level of the indicated miRNAs was measured by qRT-PCR in pancreatic islets of young prediabetic (a–d) and diabetic (e–l) db/db mice vs age-matched control mice and in mice fed a normal diet or HFD (m–s). The results correspond to the mean ± SD of three to four animals per group and are normalised to the level of the respective controls.*Significantly different from control (control or normal diet, as indicated) (p≤0.05 by unpaired Student’s t test). Ctrl, control; ND, normal diet; yg, young
and miR-146a (ESM Table6). The results obtained by
micro-array analysis were confirmed by qRT-PCR (Fig.2a–l). Our
microarray data also revealed a 2.2-fold increase in miR-21, which we have previously shown to inhibit insulin secretion
[8], a 1.6-fold decrease in miR-26a, which controls insulin
biosynthesis [18], and an increase in miR-802 (sixfold), which
regulates Hnf1b expression [19] (ESM Tables6). The role of
these miRNAs was not further investigated in this study. Islet miRNA expression was also analysed in HFD-fed mice. For this purpose we selected the group of mice displaying the strongest response to HFD. These animals were markedly obese, insulin resistant, hyperinsulinaemic and clearly
hyperglycaemic (ESM Table4). HFD mice showed miRNA
expression changes analogous to those observed in the islets of diabetic db/db mice, with the exception of miR-21, miR-34a, miR-146a, miR-199a-5p and miR-199a-3p, which were not
significantly modified (ESM Table7and Fig.2m–s).
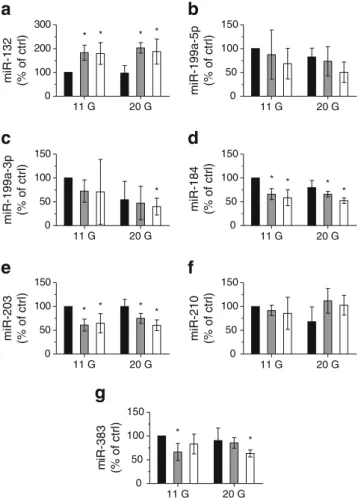
Overall, the data indicate that a subset of islet miRNAs is similarly altered in two obesity-associated animal models of type 2 diabetes, suggesting a role of specific miRNAs in beta cell failure and the development of hyperglycaemia. miRNA expression is affected by glucolipotoxic conditions To determine the possible causes of the changes in miRNA ex-pression detected in the islets of db/db and HFD-fed mice, we tested whether the levels of these non-coding RNAs are affect-ed by chronic exposure of beta cells to elevataffect-ed concentrations of glucose and NEFA. We found that prolonged incubation of
rat islets (Fig.3) under glucolipotoxic conditions mimicked the
modifications in miR-132, miR-184, miR-199a-3p, miR-203 and miR-383 expression observed in animal models. In con-trast, under these glucolipotoxic conditions the levels of
miR-210 and miR-199a-5p were not affected (Fig.3).
Particular differentially expressed miRNAs influence beta cell functions and survival Modifications of miRNA expression in islets could reflect the activation of adaptive processes counterbalancing the increased insulin needs caused by obesity and insulin resistance or the onset of pathological conditions leading to beta cell dysfunction. Indeed, we have previously shown that downregulation of miR-338-3p contributes
to compensatory beta cell mass expansion [9], whereas
overexpression of miR-21, miR-34a and miR-146a negatively
impacts on beta cell function [6,8]. To assess the possible role
of other differentially expressed miRNAs in these phenomena, we mimicked the changes observed in the animal models by transfecting dissociated rat islet cells and MIN6B1 cells with oligonucleotide duplexes corresponding to the mature miRNA sequences or with anti-miRNA molecules that specifically inhibit
miRNAs (ESM Fig.1). The transfected cells were then analysed
for their functional properties.
We first assessed whether the miRNAs differentially expressed in type 2 diabetes models are involved in the
regulation of insulin biosynthesis and release. Most of the
studied miRNAs did not affect insulin content (Fig.4a–c) or
insulin release in dissociated rat islet cells (Fig. 4d–f) and
MIN6B1 cells (ESM Fig. 2). However, overexpression of
miR-132 resulted in improved glucose-stimulated insulin
release from dissociated rat islet cells (Fig.4d). In contrast,
upregulation of miR-199a-5p led to an insulin secretory
defect in MIN6B1 cells (ESM Fig.2), but not in islet cells,
where it only diminished the insulin content (Fig.4a).
We next investigated whether the miRNAs differentially expressed in type 2 diabetes models regulate beta cell ex-pansion. In MIN6B1 cells, upregulation of miR-132 or downregulation of miR-184, miR-203 and miR-383 led to an increase in proliferation while modification of the levels
of other miRNAs had no significant effects (ESM Fig.3).
Proliferation of insulin-positive cells was also observed on
11 G 20 G 0 100 200 300 miR-132 (% of ctrl) * * * * * * * * 11 G 20 G 0 50 100 150 miR-199a-3p (% of ctrl) * * * * * 11 G 20 G 0 50 100 150 miR-199a-5p (% of ctrl) 11 G 20 G 0 50 100 150 miR-184 (% of ctrl) 11 G 20 G 0 50 100 150 miR-203 (% of ctrl) 11 G 20 G 0 50 100 150 miR-210 (% of ctrl) * * 11 G 20 G 0 50 100 150 m iR-383 (% of ctrl)
a
b
c
d
e
f
g
Fig. 3 Effect of chronically elevated glucose and palmitate on the level of islet miRNAs differentially expressed in type 2 diabetes animal models. Isolated rat islets were incubated at 11 or 20 mmol/l glucose with 0.5% BSA in the absence (black bars) or presence of 0.5 mmol/l palmitate for 48 h (grey bars) or 72 h (white bars). miRNA expression levels were measured by qRT-PCR, normalised by miR-7 and expressed as percentage of control (11 mmol/l glucose with 0.5% BSA) (a–g).
*
Significantly different from control condition, p≤0.05 by ANOVA anal-ysis, Dunnett’s post-hoc test. 11 G, 11 mmol/l glucose; 20 G, 20 mmol/l glucose; Ctrl, control
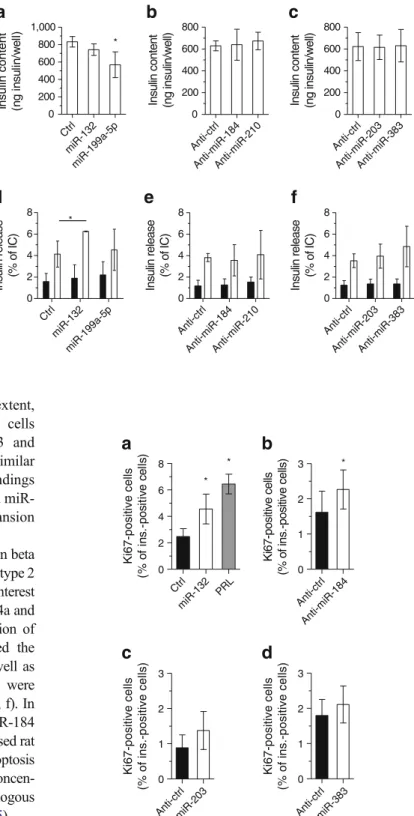
upregulation of miR-132 (Fig. 5a) and, to a lesser extent, downregulation of miR-184 in dispersed rat islet cells
(Fig. 5b). In contrast, downregulation of miR-203 and
miR-383 in primary cells had no effect (Fig.5c, d). Similar
to our previous work with miR-338-3p [9], these findings
suggest that modification of the levels of 132 and miR-184 contributes to compensatory beta cell mass expansion elicited in response to insulin resistance.
As an increase in beta cell apoptosis and a reduction in beta cell mass are thought to play a role in the development of type 2
diabetes [20], we investigated the impact of miRNAs of interest
on beta cell survival. As previously observed for miR-34a and
miR-146a [6], upregulation of miR-199a-3p or reduction of
miR-203, miR-210 and miR-383 expression increased the
number of apoptotic MIN6B1 cells (ESM Fig.4) as well as
dispersed rat islet cells (Fig. 6a, c, e). Similar results were
obtained using dissociated human islet cells (Fig.6b, d, f). In
contrast, overexpression of miR-132 or silencing of miR-184 did not induce beta cell death, but rather protected dispersed rat
(Fig.7a–d) and human (Fig.7e–h) islet cells from apoptosis
when the cells were chronically exposed to elevated concen-trations of NEFA or to proinflammatory cytokines. Analogous
results were also obtained in MIN6B1 cells (ESM Fig.5).
Impact of particular miRNA changes on candidate target gene expression As described above, db/db mouse islets are characterised by a specific rise in the levels of 21, miR-34a, miR-146a, miR-199a-3p and -5p and a downregulation of miR-203, miR-210 and miR-383 that possibly result in beta cell dysfunction and death. We previously found that miR-34a affects beta cell survival by directly targeting the anti-apoptotic
protein B cell CLL/lymphoma 2 (BCL2) [6]. Combining
Anti-ctr l Anti-mi R-1 84 0 1 2 3 Ki67-positive cells (% of ins.-positive cells) Ctrl mi R-132 PRL 0 2 4 6 8
a
b
c
d
Ki67-positive cells (% o f in s .-p o s it iv e c e ll s ) * * * Anti-ct rl Anti-mi R-2 03 0 1 2 3 Ki67-positive cells (% of ins.-positive cells) An ti-ctrl An ti- miR-383 0 1 2 3 Ki67-positive cells (% of ins.-positive cells)Fig. 5 Effect of specific modifications in miRNA expression on beta cell proliferation. Dispersed rat islet cells were transfected with oligo-nucleotides leading to overexperession (a) or downregulation (b–d) of the indicated miRNAs. Beta cell proliferation was assessed 72 h later by staining the cells with anti-Ki67 and anti-insulin antibodies. PRL (500 ng/ml for 48 h, grey bars) was used as positive control. The results correspond to the mean ± SD of three to six independent experiments.
*
Significantly different from control condition (control or anti-control, as shown), p≤0.05 by ANOVA analysis, Dunnett’s post-hoc test. Ctrl, control; ins., insulin
Ctrl miR-13 2 miR-199a-5 p 0 200 400 600 800 1,000 Insulin content (ng in s u lin /w e ll) * Anti-ct rl An ti-miR-2 03 Anti-miR -383 0 200 400 600 800
Insulin content (ng insulin/well)
Anti-ct rl Anti-miR-1 84 Anti-m iR-21 0 0 200 400 600 800
Insulin content (ng insulin/well)
Ctrl miR-13 2 miR-199a-5 p 0 2 4 6 8 Insulin release (% of IC) * Anti-ct rl Anti-miR-184 Anti-mi R-2 10 0 2 4 6 8 Insulin release (% of IC) Anti-ct rl Anti-mi R-2 03 Anti-mi R-3 83 0 2 4 6 8 Insulin release (% of IC)
a
d
e
f
b
c
Fig. 4 Impact of changes in miRNA expression on insulin content and insulin secretion. Dispersed rat islet cells were transfected with oligonucleotides leading to overexpression (a, d) or downregulation (b, c, e, f) of the indicated miRNAs. Insulin content (a–c) and insulin secretion (d–f) in response to 2 (black bars) or 20 (white bars) mmol/l glucose were measured 48 h post-transfection. Insulin release is expressed as percentage of insulin content.
*
Significantly different from control condition (control or anti-control, as shown, incubated at the same glucose
concentration), p≤0.05 by ANOVA analysis, Dunnett’s post-hoc test. Ctrl, control; IC, insulin content
bioinformatics-prediction algorithms (http://mirsystem.cgm. ntu.edu.tw/) and a literature search, we identified other miRNA targets potentially explaining the functional effects observed. In hepatocytes, miR-199a-3p regulates the
expres-sion of mTOR and of the transcription factor cMET [21], two
proteins known to play important roles in the control of beta
cell mass and survival [22,23]. We found that upregulation of
miR-199a-3p results in decreased expression of mTOR and
cMET also in MIN6B1 cells (ESM Fig.6), possibly explaining
the negative impact of this miRNA on beta cell survival. Increased expression of miR-132 displays beneficial ef-fects on both beta cell mass and function. Computational
prediction algorithms (http://mirsystem.cgm.ntu.edu.tw/)
in-dicate that granuphilin (also known as synaptotagmin-like 4 [SLP-4]), a granule-associated protein that negatively affects
insulin release [16], and GSK-3β, which negatively regulates
* * * * * * * * * * * *
a
b
c
d
e
f
Ctrl miR-132 miR-199a-5pmiR-199a-3p Cyt. mix 0 5 10 15 20Pycnotic nuclei (% of cells)
Ctrl miR-199a-5pmiR-199a-3p Cyt. mix 0.0 0.5 1.0 1.5 2.0 2.5 Pycnotic nuclei (fold change vs ctrl) Anti-ctrl Anti-miR-203 Cyt. mix 0 2 4 6 8 10
Pycnotic nuclei (% of cells)
Anti-ctrl Anti-miR-203 Cyt. mix 0.0 0.5 1.0 1.5 2.0 2.5 Pycnotic nuclei (fold change vs ctrl) Anti-ctrl
Anti-miR-184Anti-miR-210Anti-miR-383 0.0 0.5 1.0 1.5 2.0 2.5 Pycnotic nuclei (fold change vs ctrl) Anti-ctrl
Anti-miR-184Anti-miR-210Anti-miR-383 0 2 4 6 8 10
Pycnotic nuclei (% of cells)
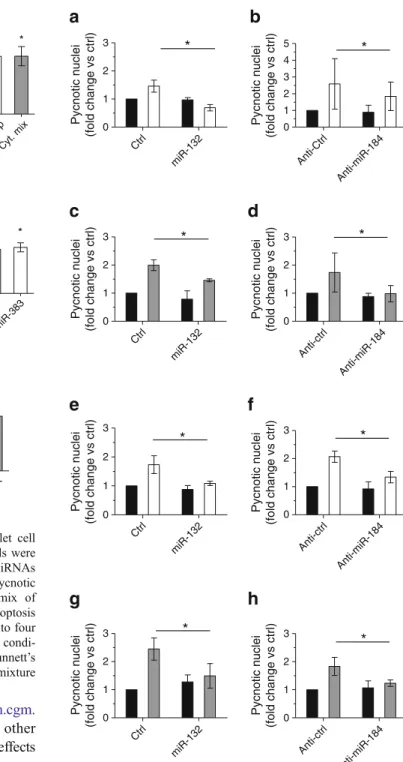
Fig. 6 Impact of specific miRNA expression changes on islet cell survival. Dissociated rat (a, c, e) and human (b, d, f) islet cells were transfected with the indicated miRNA mimics (a, b) or anti-miRNAs (c–f). Cell death was assessed by scoring the cells displaying pycnotic nuclei on Hoechst staining. Incubation for 24 h with a mix of proinflammatory cytokines was used as a positive control for apoptosis (grey bars). The results correspond to the mean ± SD of three to four independent experiments.*Significantly different from control
condi-tion (ctrl or anti-ctrl, as shown), p≤0.05 by ANOVA analysis, Dunnett’s post-hoc test. Ctrl, control; cyt. mix, proinflammatory cytokine mixture
Anti-ctrl Anti-miR-184 0 1 2 3 Pycnotic nuclei (fold change vs ctrl) Ctrl miR-132 0 1 2 3 Pycnotic nuclei (fold change vs ctrl) Anti-ctrl Anti-miR-184 0 1 2 3 Pycnotic nuclei (fold change vs ctrl)
a
Ctrl miR-132 0 1 2 3 Pycnotic nuclei (fold change vs ctrl) * Anti-Ctrl Anti-miR-184 0 1 2 3 4 5 Pycnotic nuclei (fold change vs ctrl) * Ctrl miR-132 0 1 2 3 Pycnotic nuclei (fold change vs ctrl) * Anti-ctrl Anti-miR-184 0 1 2 3 Pycnotic nuclei (fold change vs ctrl) * * * * *c
d
e
f
g
h
b
Ctrl miR-132 0 1 2 3 Pycnotic nuclei (fold change vs ctrl)Fig. 7 Overexpression of miR-132 and inhibition of miR-184 protects beta cells against palmitate- or cytokine-induced apoptosis. Dissociated rat (a–d) or human (e–h) islet cells were transfected with miR-132 mimic or with anti-miR-184. The cells were then incubated for 48 h with (white bars) or without (black bars) 0.5 mmol/l palmitate coupled to 0.5% BSA (a, b, e, f), or for 24 h with (grey bars) or without (black bars) a mix of proinflammatory cytokines (c, d, g, h). Apoptosis was assessed at 48 h post-transfection by Hoechst staining of pycnotic nuclei. The results correspond to the mean ± SD of three to four independent experiments.*Significantly different from treated control condition (control or anti-control, as shown), p≤0.05 by ANOVA analysis, Dunnett’s post-hoc test. Ctrl, control
beta cell function and mass [24,25], are potential miR-132 targets. Translational repression of these two genes could explain, at least in part, the phenotypic traits of beta cells overexpressing miR-132. However, western blot analysis did not reveal any significant impact of miR-132 on the level of
these proteins in MIN6B1 cells (ESM Fig.6). MiRNAs often
have small impacts on the expression of single direct targets
[26]. However, cumulative effects can have major indirect
influences on gene expression and cellular activities. Thus, instead of searching for direct targets, we measured the cellu-lar level of a group of transcription factors known from the literature to improve survival and function of beta cells
[27–29]. We found that upregulation of miR-132 in rat islet
cells did not affect the mRNA levels of Foxm1 and Pdx1 but
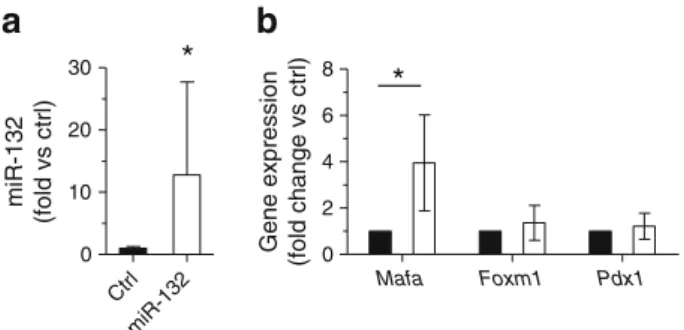
increased the level of Mafa (Fig.8b). Downregulation of
miR-184 that induces overlapping phenotypic changes did not alter the expression level of these genes (not shown).
Discussion
We have identified two groups of miRNAs displaying dif-ferential expression in pancreatic islets isolated from two animal models characterised by obesity, insulin resistance and beta cell dysfunction: db/db mice and HFD-fed mice. The changes in expression of miR-21, miR-34a, miR-132, miR-146a, miR-184, miR-210 and miR-383 detected in this study are consistent with those described by Zhao et al in the
islets of leptin-deficient ob/ob mice [5] and are in agreement
with previous findings from our laboratory [6,8]. Elevated
miR-21 levels were also detected in islets of
glucose-intolerant human donors [30]. Moreover, our microarray data
confirm the upregulation of miR-802 in the islets of db/db
mice recently observed by Kornfeld et al [19]. Increased
expression of miR-132, miR-199a-5p and miR-199a-3p have also been reported in the islets of GK rats, a lean model
of type 2 diabetes [7]. Consistent with results obtained in
ob/ob mice [5], our microarray data did not reveal significant
changes in the level of many miRNAs that play important roles in the control of beta cell functions, including miR-9,
miR-24, miR-124a and miR-148 [18,31–33]. Moreover, we
did not detect differences in the levels of miR-375, an islet-enriched miRNA that regulates insulin secretion and beta cell proliferation and that is slightly upregulated (about 30%)
in ob/ob mice [34]. Thus, although appropriate expression of
these miRNAs is required for ensuring optimal beta cell function, the development of type 2 diabetes appears not to be associated with major changes in the level of these non-coding RNAs. However, individuals expressing inappropri-ate levels of these miRNAs may display defective beta cell
functions [30] and may be more susceptible to type 2
diabe-tes manifestation. Indeed, ob/ob mice lacking miR-375
de-velop diabetes [34].
The analysis of the functional impact of individual changes in miRNA expression in isolated islet cells revealed that some of them have beneficial effects on the activity of insulin-secreting cells whereas others result in beta cell death. Upregulation of miR-132 and downregulation of miR-184 and miR-338-3p are already observed in 6 week-old prediabetic obese db/db mice. These adaptive changes in miRNA expression that have a positive impact on beta cell functions are conserved or even more pronounced in HFD-fed and 14–20-week-old diabetic db/db mice. Indeed, when the level of these particular miRNAs was modulated in vitro, both tumoral and normal beta cells displayed enhanced proliferation and resistance to
pro-apoptotic stimuli (present study and Jacovetti et al [9]).
Moreover, a rise in the level of miR-132 improved the secretory response of the cells to glucose. These observations suggest that adaptive expression of miR-132, miR-184 and miR-338-3p may contribute to beta cell compensation processes.
The increased miR-132 content and the decreased miR-184 expression observed in db/db and HFD-fed mice were mim-icked by incubation of dissociated rat islet cells in the presence of chronically elevated concentrations of palmitate and glu-cose. This suggests that these miRNAs may be induced in response to hyperglycaemia and hyperlipidaemia, two condi-tions typically encountered in prediabetic and diabetic states. In neurons, the expression of miR-132 is triggered following activation of the cAMP-dependent pathway and of the tran-scription factor cAMP response element-binding protein
(CREB) [35–40]. Incubation of rat insulinoma INS-1 832/13
cells with cAMP-raising agents has been shown to cause a
rapid increase in the miR-132 precursor [41], indicating that a
similar regulatory mechanism may also operate in beta cells. The mechanisms underlying the effects caused by changes in the level of miR-132 and miR-184 remain to be fully elucidated. We found that upregulation of miR-132 in disso-ciated rat islet cells leads to increased expression of Mafa, a gene playing an important role in the control of beta cell
*
*
a
b
Mafa Foxm1 Pdx1 0 2 4 6 8 Gene expression (fold change vs ctrl) Ctrl miR-132 0 10 20 30 miR-132 (fold vs ctrl)Fig. 8 Effect of mir-132 overexpression on the level of key beta cell transcription factors. Dissociated rat islet cells were transfected with control (black bars) or miR-132 oligonucleotide mimics (white bars). Two days after transfection, the levels of miR-132 (a) and Mafa, Foxm1 and Pdx1 mRNAs (b) were analysed by qRT-PCR. The results corre-spond to the mean ± SD of at least three independent experiments.
*
Significantly different from control condition, p≤0.05 by ANOVA analysis, Dunnett’s post-hoc test. Ctrl, control
function and survival [28]. The expression of this transcription
factor is decreased by palmitate [42] and is strongly reduced in
the islets of diabetic db/db mice [10,43]. Moreover, nuclear
MAFA was recently reported to be diminished in the islets of
individuals affected by type 2 diabetes [44]. Our data suggest
that the induction of miR-132 helps preserve the level of MAFA during obesity-associated beta cell compensation.
Over the long term, the adaptive changes elicited by miR-132, miR-184 and miR-338-3p may become insufficient to counter-balance insulin resistance; alterations in the levels of additional miRNAs with deleterious impacts on beta cells also add to the effect. Indeed, the islets of HFD-fed and of diabetic db/db mice displayed changes in the levels of several other miRNAs, includ-ing miR-21, miR-34a, miR-146a, miR-199a-5p, miR-199a-3p, miR-203, miR-210 and miR-383; variation in expression of these miRNAs in vitro causes beta cell dysfunction and death (Lovis
et al [6], Roggli et al [8] and present study). We previously
showed that induction of miR-34a and miR-146a triggers beta cell apoptosis and that miR-21 and miR-34a have a
deleteri-ous impact on insulin secretion [6, 8]. Experiments
carried out in this study revealed an increase in apopto-sis after overexpression of miR-199a-3p or downregulation of miR-203, miR-210 and miR-383 in dissociated rat and human islet cells and in MIN6B1 cells. These phenotypic changes are not unique to beta cells as modifications in the level of some of
these miRNAs promote apoptosis in other cell systems [21,
45–47]. Overexpression of miR-199a-3p resulted in a reduction
of the levels of mTOR and cMET, two well-characterised
targets of this miRNA [21, 48]. Disruption of the signalling
pathways involving these two proteins is detrimental for beta
cells [23,49]. Moreover, mTOR is an important regulator of
autophagy, a process thought to contribute to type 2 diabetes
onset [50]. Thus, the toxic effects of miR-199a-3p may be the
consequence of diminished expression of mTOR and cMET. In conclusion, the present study is the first globally address-ing the role of miRNAs in the aetiology of type 2 diabetes by systematically investigating the impact on primary beta cell function of miRNA changes observed in two animal models of obesity-associated diabetes. Our data demonstrate that obesity and insulin resistance are associated with modifications in two distinct groups of islet miRNAs that have opposing phenotypic effects on beta cells. Expression changes in miRNAs promoting beta cell mass expansion and boosting glucose-induced insulin secretion already occur in normoglycaemic animals and proba-bly belong to adaptive processes allowing beta cells to sate for insulin resistance. If these mechanisms fail to compen-sate for the diminished insulin sensitivity, additional modifica-tions in miRNA expression may accumulate, causing beta cell failure and manifestation of type 2 diabetes. We propose that beta cell activities are tuned by a balance between the levels of particular miRNAs associated with enhanced function and mass, such as miR-132, miR-184 and miR-338-3p, and others having negative impacts, including 21,
34a, 146a, 199a-5p, 199a-3p, 203, miR-210 and miR-383. A better understanding of the precise role of particular miRNAs involved in the natural history of the beta cell in diabetes may be harnessed to design novel therapeutic strategies for diabetes prevention and treatment. Acknowledgements We warmly thank Bryan Gonzalez (University of Lausanne, Switzerland) for expert technical help.
Funding The authors are supported by Grants from the Swiss National Science Foundation (31003A-127254) (to RR), the European Foundation for the Study of Diabetes (to RR), the Canadian Institute of Health Research (to MP), the National Health and Medical Research Council of Australia (to DRL) and Société Francophone du Diabète (SFD)-Servier (to CJ). MP is a recipient of a Canada research chair in diabetes and metab-olism. CG is supported by a fellowship from the Fonds de la Recherche en Santé du Québec (FRSQ), the SFD and the Canadian Diabetes Association. Duality of interest The authors declare that there is no duality of interest associated with this manuscript.
Contribution statement VN and CG generated the data, wrote the manuscript and approved its final version. CJ, VM and M-LP contributed to the acquisition of data, critically reviewed the manuscript and approved its final version. DRL contributed to data acquisition and interpretation, reviewed the manuscript and approved its final version. MP contributed to the interpretation of the data, critically reviewed the manuscript and approved its final version. RR conceived the experiments, interpreted the data, reviewed the manuscript and approved its final version.
References
1. Prentki M, Nolan CJ (2006) Islet beta cell failure in type 2 diabetes. J Clin Invest 116:1802–1812
2. Schofield CJ, Sutherland C (2012) Disordered insulin secretion in the development of insulin resistance and type 2 diabetes. Diabet Med 29:972–979
3. Sayed D, Abdellatif M (2011) MicroRNAs in development and disease. Physiol Rev 91:827–887
4. Guay C, Jacovetti C, Nesca V, Motterle A, Tugay K, Regazzi R (2012) Emerging roles of non-coding RNAs in pancreatic beta-cell function and dysfunction. Diabetes Obes Metab 14(Suppl 3):12–21 5. Zhao E, Keller MP, Rabaglia ME et al (2009) Obesity and genetics regulate microRNAs in islets, liver, and adipose of diabetic mice. Mamm Genome 20:476–485
6. Lovis P, Roggli E, Laybutt DR et al (2008) Alterations in microRNA expression contribute to fatty acid-induced pancreatic beta-cell dysfunction. Diabetes 57:2728–2736
7. Esguerra JL, Bolmeson C, Cilio CM, Eliasson L (2011) Differential glucose-regulation of MicroRNAs in pancreatic islets of non-obese type 2 diabetes model Goto–Kakizaki rat. PLoS One 6:e18613 8. Roggli E, Britan A, Gattesco S et al (2010) Involvement of
microRNAs in the cytotoxic effects exerted by proinflammatory cytokines on pancreatic beta-cells. Diabetes 59:978–986
9. Jacovetti C, Abderrahmani A, Parnaud G et al (2012) MicroRNAs contribute to compensatory beta cell expansion during pregnancy and obesity. J Clin Invest 122:3541–3551
10. Chan JY, Luzuriaga J, Bensellam M, Biden TJ, Laybutt DR (2013) Failure of the adaptive unfolded protein response in islets of obese mice is linked with abnormalities in beta-cell gene expression and progression to diabetes. Diabetes 62:1557–1568
11. Peyot ML, Pepin E, Lamontagne J et al (2010) Beta-cell failure in diet-induced obese mice stratified according to body weight gain: secretory dysfunction and altered islet lipid metabolism without steatosis or reduced beta-cell mass. Diabetes 59:2178–2187 12. Gotoh M, Maki T, Satomi S et al (1987) Reproducible high yield of
rat islets by stationary in vitro digestion following pancreatic ductal or portal venous collagenase injection. Transplantation 43:725–730 13. Lilla V, Webb G, Rickenbach K et al (2003) Differential gene expression in well-regulated and dysregulated pancreatic beta-cell (MIN6) sublines. Endocrinology 144:1368–1379
14. Roggli E, Gattesco S, Caille D et al (2012) Changes in microRNA expression contribute to pancreatic beta-cell dysfunction in predi-abetic NOD mice. Diabetes 61:1742–1751
15. Roche E, Buteau J, Aniento I, Reig JA, Soria B, Prentki M (1999) Palmitate and oleate induce the immediate-early response genes c-fos and nur-77 in the pancreatic beta-cell line INS-1. Diabetes 48:2007–2014
16. Coppola T, Frantz C, Perret-Menoud V, Gattesco S, Hirling H, Regazzi R (2002) Pancreatic beta-cell protein granuphilin binds Rab3 and Munc-18 and controls exocytosis. Mol Biol Cell 13:1906–1915 17. Kobayashi K, Forte TM, Taniguchi S, Ishida BY, Oka K, Chan L (2000)
The db/db mouse, a model for diabetic dyslipidemia: molecular charac-terization and effects of Western diet feeding. Metabolism 49:22–31 18. Melkman-Zehavi T, Oren R, Kredo-Russo S et al (2011) miRNAs
control insulin content in pancreatic beta-cells via downregulation of transcriptional repressors. EMBO J 30:835–845
19. Kornfeld JW, Baitzel C, Konner AC et al (2013) Obesity-induced overexpression of miR-802 impairs glucose metabolism through silencing of Hnf1b. Nature 494:111–115
20. Lupi R, Del Prato S (2008) Beta-cell apoptosis in type 2 diabetes: quantitative and functional consequences. Diabetes Metab 34(Suppl 2):S56–S64
21. Fornari F, Milazzo M, Chieco P et al (2010) MiR-199a-3p regulates mTOR and c-Met to influence the doxorubicin sensitivity of human hepatocarcinoma cells. Cancer Res 70:5184–5193
22. Xie J, Herbert TP (2012) The role of mammalian target of rapamycin (mTOR) in the regulation of pancreatic beta-cell mass: implications in the development of type-2 diabetes. Cell Mol Life Sci 69:1289– 1304
23. Mellado-Gil J, Rosa TC, Demirci C et al (2011) Disruption of hepatocyte growth factor/c-Met signaling enhances pancreatic beta-cell death and accelerates the onset of diabetes. Diabetes 60:525–536 24. Liu Y, Tanabe K, Baronnier D et al (2010) Conditional ablation of Gsk-3beta in islet beta cells results in expanded mass and resistance to fat feeding-induced diabetes in mice. Diabetologia 53:2600– 2610
25. Liu Z, Tanabe K, Bernal-Mizrachi E, Permutt MA (2008) Mice with beta cell overexpression of glycogen synthase kinase-3beta have reduced beta cell mass and proliferation. Diabetologia 51:623–631
26. Guo H, Ingolia NT, Weissman JS, Bartel DP (2010) Mammalian microRNAs predominantly act to decrease target mRNA levels. Nature 466:835–840
27. Davis DB, Lavine JA, Suhonen JI et al (2010) FoxM1 is up-regulated by obesity and stimulates beta-cell proliferation. Mol Endocrinol 24:1822–1834
28. Hang Y, Stein R (2011) MafA and MafB activity in pancreatic beta cells. Trends Endocrinol Metab 22:364–373
29. Kulkarni RN, Jhala US, Winnay JN, Krajewski S, Montminy M, Kahn CR (2004) PDX-1 haploinsufficiency limits the compensatory islet hyperplasia that occurs in response to insulin resistance. J Clin Invest 114:828–836
30. Bolmeson C, Esguerra JL, Salehi A, Speidel D, Eliasson L, Cilio CM (2011) Differences in islet-enriched miRNAs in healthy and glucose intolerant human subjects. Biochem Biophys Res Commun 404:16–22
31. Lovis P, Gattesco S, Regazzi R (2008) Regulation of the expression of components of the exocytotic machinery of insulin-secreting cells by microRNAs. Biol Chem 389(3):305–312
32. Plaisance V, Abderrahmani A, Perret-Menoud V, Jacquemin P, Lemaigre F, Regazzi R (2006) MicroRNA-9 controls the expres-sion of Granuphilin/Slp4 and the secretory response of insulin-producing cells. J Biol Chem 281:26932–26942
33. Baroukh N, Ravier MA, Loder MK et al (2007) MicroRNA-124a regulates Foxa2 expression and intracellular signaling in pancreatic beta-cell lines. J Biol Chem 282:19575–19588
34. Poy MN, Hausser J, Trajkovski M et al (2009) miR-375 maintains normal pancreatic alpha- and beta-cell mass. Proc Natl Acad Sci U S A 106:5813–5818
35. Nudelman AS, DiRocco DP, Lambert TJ et al (2010) Neuronal activity rapidly induces transcription of the CREB-regulated microRNA-132, in vivo. Hippocampus 20:492–498
36. Remenyi J, Hunter CJ, Cole C et al (2010) Regulation of the miR-212/132 locus by MSK1 and CREB in response to neurotrophins. Biochem J 428:281–291
37. Pathania M, Torres-Reveron J, Yan L et al (2012) miR-132 en-hances dendritic morphogenesis, spine density, synaptic integra-tion, and survival of newborn olfactory bulb neurons. PLoS One 7:e38174
38. Scott HL, Tamagnini F, Narduzzo KE et al (2012) MicroRNA-132 regulates recognition memory and synaptic plasticity in the perirhinal cortex. Eur J Neurosci 36:2941–2948
39. Lin LF, Chiu SP, Wu MJ, Chen PY, Yen JH (2012) Luteolin induces microRNA-132 expression and modulates neurite outgrowth in PC12 cells. PLoS One 7:e43304
40. Numakawa T, Yamamoto N, Chiba S et al (2011) Growth factors stimulate expression of neuronal and glial miR-132. Neurosci Lett 505:242–247
41. Keller DM, Clark EA, Goodman RH (2012) Regulation of microRNA-375 by cAMP in pancreatic beta-cells. Mol Endocrinol 26:989–999
42. Hagman DK, Hays LB, Parazzoli SD, Poitout V (2005) Palmitate inhibits insulin gene expression by altering PDX-1 nuclear locali-zation and reducing MafA expression in isolated rat islets of Langerhans. J Biol Chem 280:32413–32418
43. Matsuoka TA, Kaneto H, Miyatsuka T et al (2010) Regulation of MafA expression in pancreatic beta-cells in db/db mice with dia-betes. Diabetes 59:1709–1720
44. Butler AE, Robertson RP, Hernandez R, Matveyenko AV, Gurlo T, Butler PC (2012) Beta cell nuclear musculoaponeurotic fibrosarco-ma oncogene family A (MafA) is deficient in type 2 diabetes. Diabetologia 55:2985–2988
45. Ru P, Steele R, Hsueh EC, Ray RB (2011) Anti-miR-203 upregulates SOCS3 expression in breast cancer cells and enhances cisplatin chemosensitivity. Genes Cancer 2:720–727
46. Liu Y, Han Y, Zhang H et al (2012) Synthetic miRNA-mowers targeting miR-183-96-182 cluster or miR-210 inhibit growth and migration and induce apoptosis in bladder cancer cells. PLoS One 7:e52280
47. Li KK, Pang JC, Lau KM et al (2012) MiR-383 is downregulated in medulloblastoma and targets peroxiredoxin 3 (PRDX3). Brain Pathol 23(4):413–425
48. Kim S, Lee UJ, Kim MN et al (2008) MicroRNA miR-199a* regulates the MET proto-oncogene and the downstream extracellu-lar signal-regulated kinase 2 (ERK2). J Biol Chem 283:18158– 18166
49. Mori H, Inoki K, Opland D et al (2009) Critical roles for the TSC-mTOR pathway in beta-cell function. Am J Physiol Endocrinol Metab 297:E1013–E1022
50. Las G, Shirihai OS (2010) The role of autophagy in beta-cell lipotoxicity and type 2 diabetes. Diabetes Obes Metab 12(Suppl 2):15–19