RESEARCH ARTICLE
Challenges of modeling current very large lahars at Nevado
del Huila Volcano, Colombia
Raphael Worni&Christian Huggel&M. Stoffel& B. Pulgarín
Received: 12 April 2010 / Accepted: 21 June 2011 / Published online: 9 August 2011 # Springer-Verlag 2011
Abstract Nevado del Huila, a glacier-covered volcano in the South of Colombia’s Cordillera Central, had not experienced any historical eruptions before 2007. In 2007 and 2008, the volcano erupted with phreatic and phreato-magmatic events which produced lahars with flow volumes of up to about 300 million m3 causing severe damage to infrastructure and loss of lives. The magnitude of these lahars and the prevailing potential for similar or even larger events, poses significant hazards to local people and makes appropriate modeling a real challenge. In this study, we analyze the recent lahars to better understand the main processes and then model possible scenarios for future events. We used lahar inundation depths, travel duration, and flow deposits to constrain the dimensions of the 2007 event and applied LAHARZ and FLO-2D for lahar
modeling. Measured hydrographs, geophone seismic sensor data and calculated peak discharges served as input data for the reconstruction of flow hydrographs and for calibration of the models. For model validation, results were compared with field data collected along the Páez and Simbola Rivers. Based on the results of the 2007 lahar simulation, we modeled lahar scenarios with volumes between 300 million and 1 billion m3. The approach presented here represents a feasible solution for modeling high-magnitude flows like lahars and allows an assessment of potential future events and related consequences for population centers downstream of Nevado del Huila.
Keywords Lahar . Nevado del Huila Volcano . Hydrograph reconstruction . Model calibration/validation . Lahar modeling . FLO-2D . LAHARZ
Introduction
Ice- and snow-covered volcanoes may produce large and devastating water-sediment flows (lahars) because of possible interactions between volcanic activity and the subsequent and rapid melting of snow and ice (Major and Newhall1989). Lahars have occurred in many settings and they are typically highly destructive.
As historical events have shown, even small volcanic eruptions may produce large-scale water-sediment floods when interacting with snow and ice. This was the case at the world’s largest historic volcano-glacier disaster at Nevado del Ruiz Volcano in the Colombian Andes. In 1985, this glaciated volcano produced a small Plinian eruption during which a density current entrained snow and ice, resulting in rapid melt. The estimated volume of ice, firn, and snow lost during the eruption was 60 million m3, corresponding to a water equivalent of approximately 43 million m3(Thouret1990). Only 11–12 million m3of released
Editorial responsibility: H. Delgado Granados R. Worni
:
C. Huggel:
M. StoffelInstitute for Environmental Sciences, University of Geneva, Geneva, Switzerland C. Huggel e-mail: christian.huggel@geo.uzh.ch M. Stoffel e-mail: markus.stoffel@dendrolab.ch R. Worni (*)
:
M. StoffelInstitute of Geological Sciences, University of Berne, 3012 Bern, Switzerland
e-mail: raphael.worni@dendrolab.ch C. Huggel
Department of Geography, University of Zurich, 8057 Zurich, Switzerland
B. Pulgarín INGEOMINAS, Popayán, Colombia
water formed the deadly set of lahars that claimed more than 23,000 lives in the town of Armero (Pierson et al.1990).
In consideration of the serious hazard potential emanat-ing from large-magnitude water-driven processes such as lahars and outburst floods, it is of great importance to improve the understanding of processes involved and their dynamics. However, due to the difficulty of directly measuring large-magnitude mass flows, there is an unsur-prising lack of quantitative information. Studies of well-characterized events are an important basis for enhancing knowledge on flow physics and flow parameters. Flow parameters and dynamics of real flows need to be included in numerical modeling, which provides a valuable tool for a quantitative prediction of large-scale floods. For example, Carrivick (2006) analyzed fluvial landforms, which are seen as records of hydraulic processes at a specific place and time during a flood. Cross-sectional geometry, hydrau-lic roughness, deposited products, and the altitude of scour lines are important indicators to identify flow mechanism (Baker 2000; Carrivick 2006). Geophone recordings (Arattano1999; Van Westen and Daag2005) and gauging stations can help to reconstruct the flow hydrograph. With such information, a simple modeling approach can link cross-sectional areas, run-out distance or velocities of the flow with its total volume using semi-empirical relationships (Iverson et al. 1998; Pierson 1998; Berti and Simoni 2007; Muñoz-Salinas et al.2007). More sophisticated models assume that flows propagate as kinematic waves (Weir 1982; Vignaux and Weir 1990) and calculations are based on the fully dynamic wave momentum equation (O’Brien et al.1993).
Even though the precise physical behavior of large sediment-laden flows may not be completely predictable, the application of existing simulation programs can be meaningful and helpful. Flow parameters need to be defined and calibrated for these models, and perhaps even more importantly, models have to be fully validated with adequate field studies (Carrivick et al. 2009). Worldwide, few study sites exist where recent lahars with volumes of tens to hundreds of millions of cubic meters could be observed (Major and Newhall 1989). This is not only true for lahars but also for other comparable water-sediment flows caused by failures of natural or artificial dams (Cenderelli and Wohl
2003; Pulgarín et al.2004; Capra2007).
In 1994, 2007, and 2008, Nevado del Huila volcano produced lahars with volumes of up to 320 million m3and run-out distances of up to 160 km, killing up to 1,000 people and causing severe damage to infrastructure. The remoteness, limited accessibility and armed conflicts in the area have made investigations on Nevado del Huila and the affected drainage basins difficult. Nevertheless, this volcano offers a unique opportunity to gain knowledge about complex and interactive roles of ground-water release and glacier melting that led to formation of these lahars. An
improved understanding of ongoing processes and potential future hazards will further improve the planning and implementation of prevention measures that could protect local people and their assets.
The purpose of this paper is to (1) reconstruct flow dynamics of recent lahars at Nevado del Huila, including hydrographs and a number of flow parameters and to (2) use these data for simulations of past (retrospective modeling) and (3) potential future events (scenario-based modeling) with the two-dimensional flow model FLO-2D and the semi-empirical model LAHARZ. We are aware of several uncertainties that can neither be avoided nor necessarily be overcome with such an approach. Neverthe-less, the objective is to constrain interpretations of the dimensions of the different flow parameters to a level acceptable and useful in hazard assessment and mitigation.
Study site
The Nevado del Huila Volcano
Nevado del Huila is a stratovolcano with predominantly effusive activity. No historic eruptions are known before 2007 when eruptive activity from Nevado del Huila was first reported. The volcano has an elliptical form with approximate basal axes of 16 km in the north–south and 11 km in the east– west directions. The steep flanks have average slopes ranging from 13° to 27° and the four glaciated peaks, named North, Crest, Central and South are aligned on a longitudinal axis, with Central peak forming the highest summit of the Colombian Andes at 5,364 masl (Pulgarín et al. 2004). Although the glacier area on Nevado del Huila has shrunk from 19.1 km2in 1965 (Pulgarín et al.1996) to a surface of about 10.7 km2in 2007, the estimated volume of the glacier is still 450 million m3, corresponding to a water equivalent of∼400 million m3. Following the 2007 and 2008 eruptions, the glacier area was further reduced.
Runoff from Nevado del Huila drains into the Páez (western slopes) and Simbola (eastern slopes) Rivers, which merge 2 km above Belalcázar, the biggest town in the valley (3,500 inhabitants). Belalcázar is located 46 km downstream from the volcano summit. Other important riverine villages are Tóez, Talaga, Ricaurte and Paicol. Some 120 km downstream from the volcano (Central peak), the Páez River discharges into the Magdalena River and 30 km further downstream into the Betania reservoir (Fig. 1).
Recent lahars at Nevado del Huila Volcano
On 6 June 1994, after a period of heavy rainfall, a tectonic earthquake at the base of Nevado del Huila triggered over
3,000 shallow landslides, which coalesced into a massive lahar flowing down the Páez River (Martínez et al.1995). Almost 1,000 people were killed and 28,000 persons were directly affected by the disaster. In the communities of Irlanda and Tóez, devastation was especially high, as they were buried almost completely with lahar deposits (Ávila et al. 1995; Scott et al. 2001). Based on calculations of Calderón et al. (1997), this lahar had a volume of about 320 million m3 and a travel distance of 150 km, which emphasizes the enormous dimension of the event.
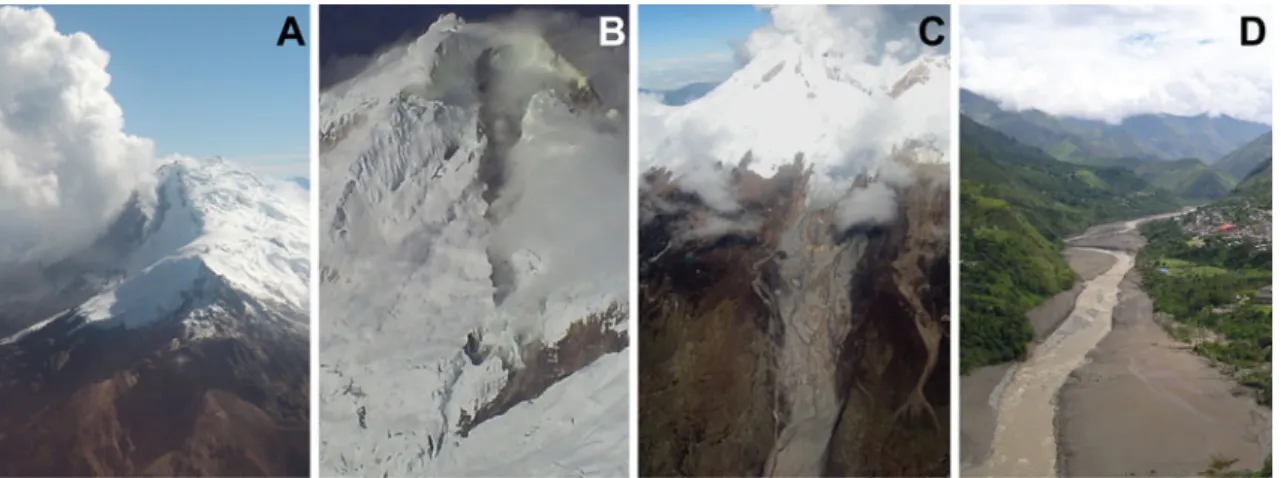
In February 2007, Nevado del Huila attracted much attention because of a significant increase in seismicity. For the first time in historical times, two comparatively small phreatic eruptions (VEI=2) were recorded, on 19 February and 18 April 2007. Lahars were produced, traveled down the Páez and Simbola Rivers and joined above Belalcázar. Only the second and bigger lahar traveled as far as the Betania reservoir, and it caused severe damage to infrastructure. No lives were claimed thanks to early warning systems that were in place. Each eruptive event was accompanied by the formation of large fissures in the summit region, with lengths of up to 2 km, widths of 50–80 m; continued strong fumarolic activity followed the eruptions (Fig.2). Although the origin of the lahars is not completely understood, it is clear that water was expelled directly from the newly opened fissures, because the volume of water involved cannot be explained by melting of snow and ice alone. It is suspected that the expelled water came from hydrothermal water reservoirs (Pulgarín et al.2007).
On November 20, 2008, Nevado del Huila produced a phreatomagmatic eruption that generated yet another lahar. A crater with an approximate diameter of 400 m and a dome were formed. Due to the threat of a possible collapse of the dome, detailed monitoring was performed by seismic surveillance, aerial inspections and a web-linked camera (webcam). Pictures show that the glacier on the west flank was fractured heavily during the eruption. The resulting lahar was extremely large, with an approximate volume of 300 million m3, and left destruction in its path, similar to that in 1994 (Fig. 3). However, due to the advanced early warning system and the sensitized population, not more than ten victims were claimed. The following analysis and modeling will primarily focus on the 2007 events, with some consideration on the 2008 event.
Data
Earth observation data
For flood modeling, we used a geo-referenced and interpolated Shuttle Radar Topography Mission (SRTM) digital elevation model (DEM) with a 30-m resolution, representing the topography in 2000. Absolute and relative 90% vertical accuracies are ±16 and ±6 m, respectively (Rabus et al.2003).
Quickbird and ASTER satellite images and aerial photo-graphs were available to study eruptive effects,
volcano-Fig. 1 Study area of the Nevado del Huila Volcano with the Páez and Simbola River valleys south of the volcano in the south of Colombia's Cordillera Central. (Quickbird image: Digital Globe—Copyright 2007)
glacier interactions and lahar processes. The ASTER image, with a 30-m resolution, was acquired on 23 February 2007, 4 days after the first eruption of Nevado del Huila, whereas the Quickbird image was taken on 7 February 2007, showing the glaciers on Nevado del Huila prior to the eruption at 0.62-m resolution. Aerial photographs from helicopter and plane flights over the volcano were also available for 2007 and 2008.
Discharge measurements and geophone records
Discharge measurements at the Páez River were taken by the Colombian Institute of Hydrology, Meteorology and Environmental Studies. The gauging stations give relations between river stage and discharge, defined and calibrated on the basis of velocity and cross-section measurements. The only discharge data existing for the April 2007 lahar were from hourly measurements near Paicol, 105 km downstream of Nevado del Huila. According to stage
measurements during the April 2007 lahar, the peak discharge at Paicol was 2,500 m3s−1and the flow volume of 17.4 million m3.
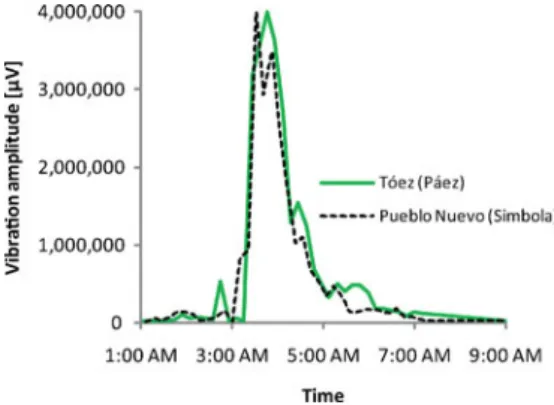
Tremors caused by tectonic and volcanic activities or large debris flows produce seismic waves that travel through the subsurface. Geophones register these waves and transform them into electrical signals. Along the upper sections of the Páez and Simbola rivers, six geophones were installed to register ground shaking caused by lahars. Records from the geophones located at Tóez (Páez River) and Pueblo Nuevo (Simbola River) could be used in this study for the April 2007 lahar (Figs.4and 5).
Field data collection
Following the April 2007 eruption the Colombian Institute of Geology and Mining (INGEOMINAS) started extensive field data collection in the Páez and Simbola valleys. Lahar inundation depths at 60 locations (Fig.5) over a distance of
Fig. 3 a Crater (dotted orange line) of Nevado del Huila with the arising dome (yellow line) that was formed during and after the eruption in November 2008. b Traces of the lahar that flowed down
the west and south-west flanks of the volcano. c Lahar path in the Páez River valley above Belalcázar. Downstream direction is to upper right. (Photographs by INGEOMINAS)
Fig. 2 a, b Fissures that opened after the February and April 2007 eruptions. c Traces of the destructive lahar in April 2007. View of the east flank of Nevado del Huila where the lahar flowed into the
Simbola River. d View upstream of Belalcázar (right side) and beyond. Belalcázar is the biggest town in the Páez River valley that was hit by the flow. (Photographs by INGEOMINAS)
about 70 km were estimated based on flow trim lines. Pre-flood river cross-section profiles, measured with a theodo-lite, were available for seven locations between Avirama and Guadualejo. Together with the measured lahar
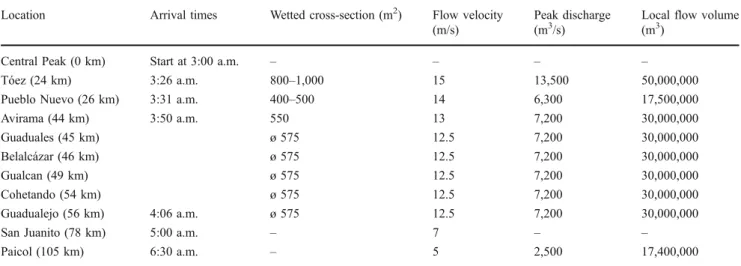
inunda-tion depths, wetted cross-secinunda-tional areas were calculated for these locations. For hydrograph reconstructions, cross-sectional areas at the geophone locations at Tóez and Pueblo Nuevo were estimated with reference points at bridges (Table1).
The strongest seismic signal associated with the eruption of Nevado del Huila was registered at Central peak at 2:58 a.m. on 18 April 2007. This marks most probably the location and time of the release of large amounts of water, which then formed the lahar. Travel times to different locations downstream are based on geophone records, eyewitness reports and a river gauge. Together with according flow distances, measured from satellite images, flow velocities were calculated (Table1).
After the April 2007 lahar, nine samples of deposited fine material (<0.1 mm) were taken at different locations along the flow path and analyzed by wet-sieving. Average D16, D50 and D84 were 0.018, 0.042 and 0.081 mm, respectively, and the clay content averaged 3.5%. The grain size distribution of the fine fraction did not change significantly over the flow path.
Fig. 5 Locations of discharge measurement (blue pentagon), geophone recordings (red triangles) and measured inundation depths (green dots). Lahars were modeled over a distance of 150 km from the base of Nevado del Huila to the Betania reservoir
Fig. 4 Geophone recordings from the 18 April 2007 lahar in the Páez (Tóez) and Simbola (Pueblo Nuevo) valleys. The signals were received at 10-min intervals and are given inμV. Geophones were saturated when vibration amplitude exceeded 4.096 V. Times given are local time
Reconstruction of flow hydrographs of the April 2007 lahar
The mean wetted cross-sectional area between Avirama and Guadualejo was 575 m2for the April 2007 lahar, and flow velocities of 12.5 ms−1 were calculated based on eyewit-ness reports stating that the lahar covered the distance between Avirama and Guadualejo (12 km) in 16 min. The multiplication of wetted cross-sectional area by flow velocity consequently yields a peak discharge of ∼7,200 m3
s−1. A qualitative river profile analysis in the Páez and Simbola valleys above Belalcázar revealed wetted cross-sectional areas of 800–1,000 and 400–500 m2
, re-spectively. Flow velocities at the Tóez and Pueblo Nuevo geophone locations were 15 and 14 ms−1, respectively, based on recorded travel times from Central Peak to the locations of the geophones. This yields maximum discharge values of ∼13,500 m3 s−1 at Tóez (Páez River) and ∼6,300 m3
s−1at Pueblo Nuevo (Simbola River) (Table1). The output graphs from the Tóez and Pueblo Nuevo geophones (Fig. 4) were used to reconstruct the flow hydrographs for the respective river sections. To calculate a hydrograph from geophone recordings peak discharge at the geophone location was first evaluated, and the y-axes of the geophone recordings were then normalized to values between 0 and 1 (by dividing all vibration amplitudes by the maximum value). The normalized numbers were then multiplied by the previously defined peak discharge. This leads to a hydrograph with the same shape and x-axis values as the geophone recordings, but with discharge values instead of a vibration amplitude. By implementing peak discharges of 13,500 and 6,300 m3s−1 into the geophone recordings from Tóez and Pueblo Nuevo, we derived flow hydrographs of the April 2007 lahar (Fig.6).
Exploitable geophone recordings were not available for the river segments below the confluence of the Páez and Simbola Rivers. A different approach was therefore used to reconstruct the hydrograph in this section: The hydraulic program FLO-2D modeled the flows of the Tóez and Pueblo Nuevo hydrographs simultaneously river downstream to produce a single hydrograph for the river downstream of Belalcázar. The program accounts for floodwave attenuation and is able to reproduce a superimposing hydrograph, i.e. a flowing together of the floods from two valleys. However, in the present case, FLO-2D overestimates peak discharge and flow volume in the output hydrograph, because the program does
Fig. 6 Reconstructed flow hydrographs (green, orange, and blue) and stage hydrograph (black) of the April 2007 lahar. Times given are local time. Distances to Central peak are indicated. The decrease in peak discharge and flow volume as well as hydrograph attenuation become increasingly pronounced with increasing distance down-stream. Note that the lahar passed simultaneously at Tóez and Pueblo Nuevo
Table 1 Tabulation of lahar arrival times, wetted cross-sectional areas, flow velocities, peak discharges, and flow volumes for different locations in the Páez and Simbola River valleys
Location Arrival times Wetted cross-section (m2) Flow velocity (m/s)
Peak discharge (m3/s)
Local flow volume (m3)
Central Peak (0 km) Start at 3:00 a.m. – – – –
Tóez (24 km) 3:26 a.m. 800–1,000 15 13,500 50,000,000
Pueblo Nuevo (26 km) 3:31 a.m. 400–500 14 6,300 17,500,000
Avirama (44 km) 3:50 a.m. 550 13 7,200 30,000,000 Guaduales (45 km) ø 575 12.5 7,200 30,000,000 Belalcázar (46 km) ø 575 12.5 7,200 30,000,000 Gualcan (49 km) ø 575 12.5 7,200 30,000,000 Cohetando (54 km) ø 575 12.5 7,200 30,000,000 Guadualejo (56 km) 4:06 a.m. ø 575 12.5 7,200 30,000,000
San Juanito (78 km) 5:00 a.m. – 7 – –
Paicol (105 km) 6:30 a.m. – 5 2,500 17,400,000
not account sufficiently for deposition in the uppermost river sections. As a consequence, similar to the hydrograph reconstruction based on the geophone data, we accepted the form and time axis of the FLO-2D output hydrograph, but adapted discharge to a maximum of 7,200 m3 s−1 (Fig. 6). Local flow volumes which are determined from the hydro-graph integrals are indicated in Table1.
Flow type and flow rheology
Water and sediment content together control lahar behavior in a valley (Capra et al. 2004). Transformations between debris and hyperconcentrated flows, as occurred during the April 2007 lahar, are mainly related to sediment deposition and bulking processes or the dilution of a debris flow by stream water (Smith and Lowe1991).
Debris flows are poorly sorted cohesive or noncohesive sediment-laden mixtures with a sediment concentration 60% or more by volume (Lavigne and Thouret 2002). Hyper-concentrated flows have sediment concentrations in the range of 20% to 60% by volume. These boundaries depend on the particle-size distribution of solids and vary for different mixtures. In addition, hyperconcentrated flows are not only defined by sediment concentration but also by the concen-tration of suspended fines which must be sufficient to impart yield strength to the fluid and to maintain high fluid viscosity (Jakob and Hungr 2005). Like debris flows, hyperconcen-trated flows can be described as non-Newtonian fluids, but with the difference that deposition does not occur en masse, as is commonly assumed for debris flows (Smith and Lowe
1991; Lavigne and Thouret 2002). In the case of debris flows, yield strength alone can suspend coarse gravel particles, whereas gravel can be suspended only by fluid forces in hyperconcentrated flows (Jakob et al.2005).
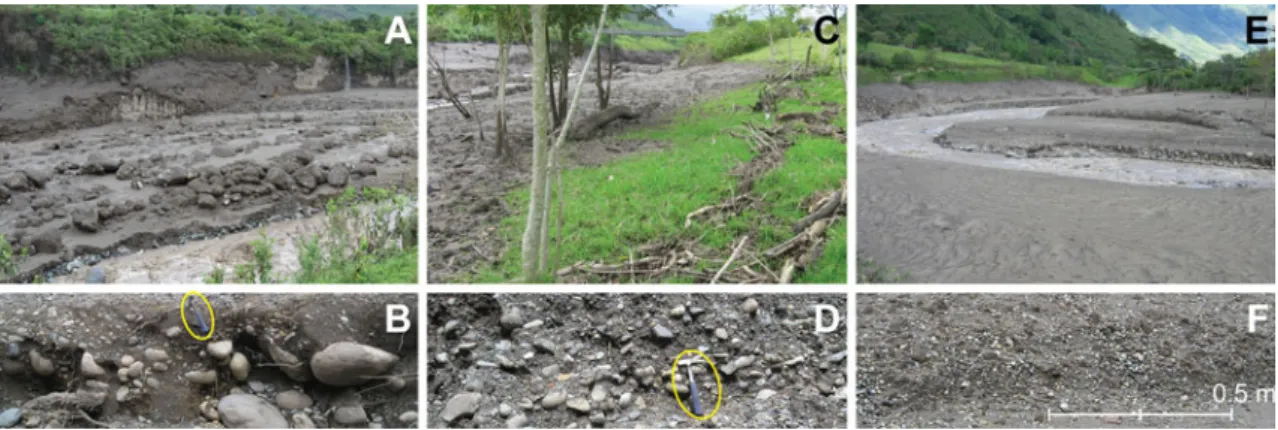
The sections in the Páez and Simbola valleys where the lahar flowed as a debris flow are indicated by the presence of lateral levees composed of coarse blocks (Fig.7a), and steep, lobate snouts at the flow front. Deposits have framework-supported larger clasts, and exhibit a wide range of grain sizes (i.e. from clay to boulders), are poorly sorted and lack any stratification (Fig.7b). A sediment concentration of >60% by volume was assumed for these river sections.
In areas where a transformation from debris to hyper-concentrated flows and vice versa was observed, deposits contain mainly poorly graded and sorted sandy material, and some boulders on top of the deposits (Fig.7c, d). Such transitional flows are inferred to have a sediment concen-tration of∼50% by volume.
Hyperconcentrated flows deposited sandy sediments including lenses of gravel and wood on the surface. Cross-bedding and ripple lamination are absent while outsize cobbles and boulders are, in contrast, present. The
sand- and granule-grade deposits exhibit a faint horizontal stratification, and strata are ungraded to normal graded (Fig. 7e, f). Here an average sediment concentration of ∼40% by volume is inferred.
In the river sections above Belalcázar lahar deposits suggest a continuous transformation from debris flows to hyperconcentrated flows and visa versa. Debris flows covered smaller distances in each case, in between the hyperconcentrated flow phases. With increasing distance from the source, the lahar moved predominantly as a hyperconcentrated flow and downstream of Belalcázar debris flow deposits are no longer present. In the river section below, Paicol sediment concentration may have dropped below ∼20%, meaning that the flow was a Newtonian stream flood.
At sediment concentrations above ∼20% the flow was treated as a non-Newtonian fluid, where yield strength and viscosity become important parameters (Pierosn and Scott 1985). O’Brien and Julien (1988) analyzed sedi-ments <0.072 mm from natural debris flow deposits in the Colorado Rocky Mountains and identified viscosity and yield stress of these flows. They assumed that viscosity (η) and yield stress (τ) depend on empirical coefficients and on sediment concentration:
h ¼ a1eb1CV ð1Þ
t ¼ a2eb2CV ð2Þ
where α1, α2, β1 and β2 are the empirical coefficients
obtained by regression analysis and Cv is the volumetric
sediment concentration in the flow. The lahar deposits at Nevado del Huila showed a similar grain size distribution of fine materials as one of the debris flows reported by O’Brien and Julien (1988), and are thus supposed to have the same empirical coefficients α and β (Table 2). With average sediment concentrations of 50% and 40% for upper and lower river sections, according to Eqs.1and2viscosity is 144 and 77 mPa s, respectively, and yield stress is 35.8 and 6.6 Pa, respectively.
Dynamic lahar modeling
Modeling the motion of very large lahars is a challenge, using existing possibilities and software packages. No explicit and all-embracing modeling approach exists, as lahars represent highly variable and complex phenomena. Nevertheless, if limitations and uncertainties involved in lahar modeling are appropriately accounted for, risk reduction efforts can be greatly supported by modeling.
We applied the physically based model FLO-2D (O’Brien et al. 1993) and the semi-empirical simulation
program LAHARZ (Iverson et al. 1998) with three main objectives: (1) to define model parameter values, (2) to calibrate and validate the models on the basis of the April 2007 lahar (retrospective modeling) and (3) to model possible future lahars (“Scenario modeling”) based on the
previously defined model setup. In the retrospective modeling, flow volumes and peak discharges of the April 2007 lahar (Table 1) were used as model input; in the scenario-based modeling, volumes between 300 million and 1 billion m3 and peak discharges between 80,000 and 270,000 m3/s were modeled. LAHARZ modeled the lahars from the base of the volcano to the Betania reservoir (see Fig.5) and FLO-2D from Tóez/Pueblo Nuevo to Paicol. FLO-2D modeling
For dynamic lahar modeling, we used FLO-2D, a two-dimensional hydraulic flood-routing model for channel and
unconfined overland flow (O’Brien et al. 1993). Flood wave progression over the flow domain is computed on the basis of topographic data, flood hydrographs, flow param-eters and resistance to flow. FLO-2D is a finite difference model using the dynamic wave momentum equation to describe the fluid; it consists of the continuity equation and the equation of motion. When simulating sediment-laden flows with FLO-2D, flow rheology (yield stress and viscosity) and sediment concentration have to be specified (O’Brien2003).
Before FLO-2D can be used to model specific scenarios, sensitive input parameters have to be defined. To test the sensitivity of a model parameter on simulation output, its value was adjusted within a reasonable range, while all other parameters were maintained at default values. We then looked at the change of modeled inundation depths before and after parameter adjustment. Parameter sensitivity was considered small when the influence on modeled
inunda-Fig. 7 Flow types in the Páez and Simbola valleys. Mean grain size and sediment concentration decrease river downstream. a, b Flow deposits in the upper river sections where the lahar flowed partly as a debris flow. Downstream direction is to lower left. c, d Deposits representing a transitional or hyperconcentrated flow with high sediment concentration. This flow type predominantly occurred in
the upper river sections. Image view is upstream. e, f Hyperconcen-trated flow, smaller grain sizes, and lower sediment concentration than in the transitional flow, representative for the lower river sections. Image view is downstream. Circles indicate geological hammers used for scale
Table 2 Sensitive model parameters with corresponding values for FLO-2D
Parameter Description Unit Theoretical rangea Field evidenceb Sensitivity
α1andβ1for viscosity Eq.1 Thickness of a fluid or resistance
to flow of fluid
(−) α1: 7.07×10⁻⁴–2.72 α1: 0.0648 Moderate
β1: 7.82–29.8 β1: 6.2
α2andβ2for yield stress Eq.2 Shear stress vs. shear rate (−) α2: 3.73×10⁻⁵–0.13 α2: 0.0765 Moderate
β2: 8.29–36.6 β2: 16.9
Sediment concentration (C) Sediment concentration, by volume, in the lahar
% 0–0.89 0.4–0.5 High
Manning’s n roughness Measure of the texture of a surface (−) 0.02–0.8 0.04–0.05 Moderate Limiting Froude number (Fr) Measure of the flowing state of a river (−) 0–5 0.9 High For each parameter, the sensitivity on simulation output was tested. For details, see text
a
FLO-2D Software (2009)
b
tion depth was <10%, moderate if 10–20% and high if 20– 40%. In Table2, all sensitive parameters for the FLO-2D modeling are listed and described. The parameter values are based either on field data and observations, values proposed in the literature (Lavigne and Thouret 2002; Jakob and Hungr2005; USGS2011) and those suggested in FLO-2D user’s manual (FLO-2D Software I2009). The previously defined flow hydrographs are used as the model’s upstream boundary condition.
In the retrospective modeling the computational area was divided into two different segments as (1) different flow volumes and different sediment concentrations can be simulated in each section and as (2) excessive computation times can be avoided. The latter is particularly important in the retrospective modeling, where multiple model runs are required for sensitivity analysis and model calibration. The upper modeling section covers the Páez and Simbola Rivers above Belalcázar. From Tóez and Pueblo Nuevo the hydrographs were routed simultaneously downstream flowing together at the river confluence. In this segment, the lahar was modeled as a transitional flow with a sediment concentration on the boundary between debris flow and hyperconcentrated flow. The section from Belalcázar to Paicol represents the downstream modeling area, where the lahar was modeled as a hyperconcentrated flow.
In scenario modeling, the computational area was not split and a uniform sediment concentration of 40% by volume was applied. The hydrographs derived from geophone recordings at Tóez and Pueblo Nuevo were used with adapted discharge values for upper boundary con-ditions. In the scenario modeling, 50% each of the total volume is assumed to flow through the Páez and Simbola valleys before the two flows merge at the confluence above Belalcázar.
The same roughness values and Froude numbers were applied for both the retrospective and scenario modeling. Based on the roughness coefficients provided by USGS (2011), n values of 0.05 were selected for the river sections above Belalcázar and 0.04 for the river section below Belalcázar. The analysis of flow deposits and flow signs indicate sections where the lahar was in a critical flow state (Fr=1.0). However, average flow conditions had Fr<1, and for modeling a value of 0.9 was applied.
LAHARZ model and calibration of governing equations The LAHARZ flow model is a semi-empirical program developed by Iverson et al. (1998) that calculates flow extent and run-out distances of lahars in valleys. Flow depths can be derived from the flow delineation and the DEM. The following two equations form the basis of the program (Iverson et al.1998):
A¼ 0:05V2=3 ð3Þ
B¼ 200V2=3 ð4Þ
where A is the valley cross-sectional area from which flow depth can be derived, and B is the planimetric area inundated by lahars. Both A and B are functions of lahar volume V, the most important input factor when modeling with LAHARZ. The equations have a physical basis, which provide proportionality rules A∝V 2/3 and, B∝V 2/3 and a statistical basis in which the proportionality factors C and c in the equations A=CV2/3and B=cV2/3are calibrated.
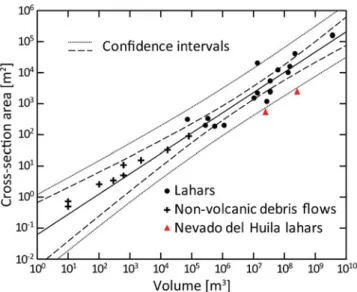
Figure8shows the measured cross-sectional areas for 27 lahars and debris flows, plotted against their corresponding deposit volume (Iverson et al.1998). A best least-square fit regression line is drawn with two surrounding sets of 95% confidence interval curves and was used to determine coefficients c and C. The calculated inundated cross-sectional areas and estimated volumes of the April 2007 and 1994 Nevado del Huila lahars were compared with those used by Iverson et al. (1998). The 1994 Nevado del Huila lahar had an average inundated cross-sectional area of about 3,000 m2and a volume of 320 million m3at the upper river sections (Calderón et al. 1997; Scott et al. 2001). The average inundated cross-sectional area of the April 2007 lahar was about 575 m2near Belalcázar and the flow volume that passed this section was 30 million m3. Data points for Nevado del Huila lahars appear outside the predictive envelope at the level of analytical confidence, and show smaller cross-sectional areas for the corresponding volumes. Thus, calculating the April 2007 lahar volume using the original equation yielded highly exaggerated inundation depths.
We, therefore, adapted the constant C of equation A= CV2/3to produce results consistent with data from the 2007 and 1994 lahars; the adapted constant yields values of 0.0067 and 0.0063 for the 2007 and 1994 lahars, respectively. As a reasonable average, a C value of 0.0065 was defined, resulting in the following equation:
A¼ 0:0065V2=3 ð5Þ
This condition is fulfilled if V2/3 is held constant. A calibration based on field data was not directly possible for Eq.4, and we had to adjust c in B=cV2/3indirectly. Based on inflow discharge data from the Betania reservoir, there is evidence that the April 2007 lahar entered the reservoir with 10 million m3 of water and sediment. We, therefore, adjusted c in such a way that modeled flows with an input volume of 30 million m3 ended up in the reservoir. The recalibrated c value is 280, resulting in the new equation:
Model results and model validation
The reconstructed hydrographs and flow parameters as well as the calibration of the flow models finally allowed retrospective modeling of the April 2007 lahar. FLO-2D and LAHARZ were run on a SRTM DEM, calculating lahar inundation depths and flow velocities (the latter only with FLO-2D).
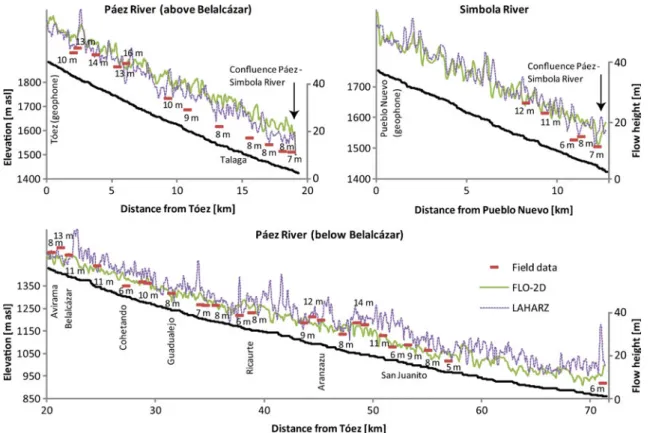
Figure9illustrates the longitudinal section between the highest and lowest locations in the Páez and Simbola valleys where field data were collected and compared with flow heights modeled with FLO-2D and LAHARZ. Páez River (above Belalcázar) A lahar volume of 50 million m3 was modeled. FLO-2D generally calculates slightly higher inundation depths than LAHARZ. The mean difference or root mean square error (RMSE) of calculated inundation depths between the two programs is 3.5 m. FLO-2D and LAHARZ calculate mean inundation depths of 18 and 15 m, respectively, for the 2007 lahar. Between 0 and 10 km, the mean deviation, consistently as over-estimates, from measured flow depths is 6 m for FLO-2D and 4.4 m for LAHARZ. In the lower section, the programs overestimate flow depths even more, with RMSE of 10 m for FLO-2D and 5.5 m for LAHARZ.
Simbola River A lahar volume of 17.5 million m3 was modeled. Both programs calculate similar inundation depths (average=13.5 m) with a mean difference of 2.5 m between FLO-2D and LAHARZ. Observed inundation depths are only available for the lower section, and the
RMSE between observed and modeled depths, consistently as model overestimates, is 4 and 4.5 m for FLO-2D and LAHARZ, respectively.
Páez River (below Belalcázar) A lahar volume of 30 million m3was modeled. Over the whole flow distance inundation depths calculated by FLO-2D and LAHARZ differ from one another by 4.5 m on average, with a better agreement between 20 and 40 km (RMSE=3.5 m). For this section, FLO-2D better reproduces observed inundation depths. The mean difference between modeled and measured inundation depths is 2.25 m for FLO-2D and 4.75 m for LAHARZ. With increasing distance, LAHARZ increasingly overestimates real inundation depths, whereas FLO-2D is capable of reproduc-ing the field-indicated general decrease in flow depths.
Table3presents flow velocities and travel times modeled with FLO-2D and relates them to velocities and travel times based on field evidence. In the upper river sections FLO-2D underestimates local flow velocities by 1–3 ms−1. In the
river sections below Belalcázar, the program produces local velocities that are almost equal to those obtained from arrival times. When comparing modeled and real travel times at different river sections, overall, FLO-2D calculates longer flow durations. Hence, average flow velocities were faster in reality than reproduced by FLO-2D.
Figure10presents the output hydrograph calculated with FLO-2D (solid line) and the one measured at Paicol (dotted line). Considering that the temporal resolution is 0.1 h for the calculated and 1 h for the measured hydrograph, both curves fit together well. The main difference is the flatter falling limb of the FLO-2D hydrograph. The integrated area below the curve (local flow volume) of the measurement-based graph is 17.4 million m3 and that of the modeled lahar 20 million m3.
Scenario modeling
With the calibrated and validated FLO-2D and LAHARZ programs we modeled scenarios for different lahars that may occur in the future. We assigned outburst volumes of 300 million, 600 million and 1 billion m3. The volume of 300 million m3represents the volume of the 1994 and 2008 lahars, but also forms a hypothetical scenario because flow parameters and hydrograph forms were taken from the retrospective modeling. A flow volume of 600 million m3is based on calculated water and material release associated with a collapse of Central peak. A lahar volume of 1 billion m3can be regarded as a worst-case scenario with a collapse of Central and Crest peaks. Such peak collapses can be triggered by volcano instability related to glacier retreat, dome collapse, or a large eruption (Pulgarín et al. 2004; Huggel et al. 2007). Table 4 lists modeled inundation
Fig. 8 Mean cross-sectional area versus lahar volume of 27 lahar and debris flow events (black) observed worldwide (Iverson et al.1998). The cross-sectional areas of the April 2007 and 1994 lahars from Nevado del Huila are plotted against their corresponding volumes (red triangles)
depths at different locations along the Páez and Simbola Rivers and lahar travel times from Tóez/Pueblo Nuevo to different downstream villages as calculated by FLO-2D.
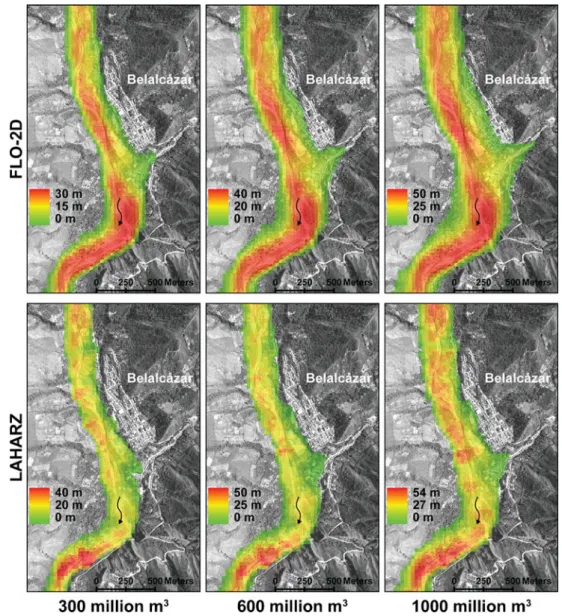
In Fig.11, inundation depths and flow extent are shown for the three different scenarios in the Belalcázar region. LAHARZ and FLO-2D model partly different inundation patterns and do not produce the same areas affected by the lahars.
A simulated volume of 300 million m3 yielded maxi-mum inundation depths between 30 and 40 m. A lahar of this volume would have major effects in the town of Belalcázar. Roads would be damaged severely and bridges washed away. Probably, more than 60 buildings would be (partly) inundated. FLO-2D suggests a bigger area being
affected by the lahar than does LAHARZ, and although FLO-2D results show lower maximum inundation depths, the average inundation depth is higher. Modeled maximum flow depths exceeded 40 and 50 m for lahar scenarios of 600 million and 1 billion m3, respectively. Large parts of the road would be destroyed, including the bridges crossing the river. About 160 and 350 buildings, respectively, would be flooded and some would be completely destroyed.
Discussion
In this study, we modeled inundation depths and travel times for three hypothetical lahars larger than the April
Fig. 9 Calculated inundation depths of the April 2007 lahar as obtained with FLO-2D (green) and LAHARZ (pink dashed) along an 80-km stretch of the Páez and Simbola Rivers. In situ measured
inundation depths (red bars) are used to validate model results. Vertical exaggeration by a factor of 10
Location Velocity Arrival time
Field evidence (m/s) FLO-2D (m/s) Field evidence FLO-2D
Tóez 15 14 3:26 a.m. Start: 3:26 a.m.
Pueblo Nuevo 14 11 3:31 a.m. Start: 3:31 a.m.
Avirama (Belalcázar) 13 11 3:50 a.m. 4:02 a.m.
Guadualejo 12.5 11 4:06 a.m. 4:20 a.m.
San Juanito 7 7 5:00 a.m. 5:20 a.m.
Paicol 5 5 6:30 a.m. 7:20 a.m.
Table 3 Field based and com-puted flow velocities and flow arrival times (travel times) at different locations, representing the April 2007 lahar
2007 event. Simulation results are valuable for hazard prevention strategies, but it is vital that they are carefully evaluated. Programs can only be applied for scenario modeling after calibrating and validating model results against field data. This, however, was challenging with the limited data and information available on past lahar events. Therefore, an uncertainty analysis of the input parameters was particularly important in view of the general difficulties in modeling mass flows of tens to hundreds of millions m3.
Uncertainty analysis
Flood modeling in remote areas is generally afflicted by errors because DEMs with rather limited resolution are normally available. Nevertheless, DEMs with a 30-m
resolution have been shown to be suitable for a first overview of potential hazard zones and have the advantage of not becoming outdated as quickly as high resolution DEMs (Stolz and Huggel 2008). Different studies have shown that the choice of the DEM can have important effects on the determination of distal hazard zones (Stevens et al.2002; Davila et al.2007; Hubbard et al.2007; Huggel et al. 2008). We did not specifically evaluate the effect of the DEM on model results, but the local irregularities of the SRTM DEM, such as sinks and ascending slopes in the river bed, are directly affecting model output.
One of the most important inputs for dynamic lahar modeling is the flow hydrograph. Lavigne and Thouret (2002) and Lavigne et al. (2000) report good linear regressive correlations between discharge and geophone signals for hyperconcentrated flows. We therefore adopted the x-axis and the form of the Tóez and Pueblo Nuevo geophone recordings for hydrograph reconstruction. The determination of (peak) discharge tends, in contrast, to be less accurate, particularly because flow velocities have a high uncertainty due to ambiguous information about flow arrival times at different locations in the Páez and Simbola valleys.
In non-Newtonian, sediment-laden flows, a change of volumetric sediment concentration from 10% to 40% increases both viscosity and yield stress by three orders of magnitude (O’Brien and Julien 1988). In this study, sediment concentrations in the April 2007 lahar were based on the prevalent flow type. Although this generalization is in some ways arbitrary (Jakob and Hungr 2005), it represents the best available approximation to reality.
Fig. 10 Measured and modeled hydrograph at Paicol. FLO-2D is able to reproduce the observed hydrograph attenuation and the decline in volume and discharge
Table 4 Modeled lahar inundation depths for selected locations along the Páez and Simbola Rivers for lahar volumes of 300 million, 600 million and 1 billion m3
Location 300 million m3 600 million m3 1 billion m3
FLO-2D (m) Travel time (min) LAHARZ (m) FLO-2D (m)
Travel time LAHARZ (m) FLO-2D (m) Travel time LAHARZ (m)
Tóez 22 Start 25 28 Start 35 34 Start 38
Pueblo Nuevo
27 Start 32 35 Start 45 42 Start 42
Talaga 23 12 min 26 30 12 min 37 37 12 min 40
Avirama 25 12 min 33 34 12 min 38 45 12 min 47
Belacázar 24 12 min 24 33 12 min 30 44 12 min 39
Coquiyo 27 12 min 27 38 12 min 32 51 12 min 42
Cohetando 30 24 min 30 40 12 min 42 48 12 min 47
Guadualejo 23 24 min 25 32 24 min 36 44 24 min 40
Ricaurte 27 36 min 35 35 24 min 40 47 57
Aranzazu 26 48 min 32 38 36 39 52 36 min 49
San Juanito 26 1 h 25 35 48 min 30 46 38
Paicol 22 1 h and
36 min
22 32 1 h and
12 min
31 41 1 h 37
Modeling a constantly changing flow rheology and sediment concentration as occurred in the river sections above Belalcázar is impossible with currently existing models. Therefore, an intermediate sediment concentration must be applied, representing averaged flow conditions over a larger section. This, however, inhibits determination of maximum yield stress and consequently deposition rates during debris flow phases. Therefore, the model did not account sufficiently for volume decline in the uppermost river sections. Below Belalcázar, flow transformation were no longer an important control on flow, and the modeled decrease in flow volume corresponds very well with that established by observation and measurement (Fig.10). Model calibration and validation
LAHARZ has proved to be a useful tool for first-order modeling of lahars and has been applied at many sites around the world (e.g. Canuti et al.2002). Recalibration of
the governing equations is not required as long as the lahar has a flow behavior similar to those used in the scaling analysis to derive the original equations. Since Nevado del Huila lahars were found to be outside the range of events considered for the original equations, recalibration was of critical importance. The recalibrated LAHARZ model is able to retrospectively model the 1994 and 2007 lahars, and validity for further lahars in the Páez River can be reasonably inferred.
FLO-2D uses the Bingham model to describe rheology of sediment-laden flows. Coussot (1997) and Iverson and Vallance (2001) have shown that this might be a simplifi-cation, that reduces the accuracy of flow predictions, particularly for deposition processes (Schatzmann 2005). However, no better physically based codes designed specifically for lahar modeling are available, so the existing tools must be applied. This is a legitimate approach if models are accurately calibrated and validated for the systems modeled.
Fig. 11 Modeled inundation depths for the Belalcázar region as modeled with FLO-2D and LAHARZ for scenarios of 300 million, 600 million and 1 billion m3
Program validation showed that FLO-2D and LAHARZ generally calculate similar inundation depths, which match measured inundation depths reasonably well. Over the entire model domain FLO-2D results depart by∼25% and LAHARZ output by ∼35% from measured depths of the 2007 lahar event. This illustrates the robustness of the modeling approach and the potential of the tools applied. However, locally even larger deviations between modeled and observed inundation depths exist, and highlight the models’ limitations for detailed local analyses at high resolution. Important limitations exist in particular for LAHARZ regarding sediment deposition and flow attenu-ation. The program maintains the ratio of the inundated cross-sectional area over the entire flow path in order to distribute the volume. The program therefore overestimated inundation depths at lower locations, where in reality the flow discharge and volume had decreased due to deposition and flow attenuation. FLO-2D, in contrast, accurately simulated flow attenuation downstream of Belalcázar but was of limited accuracy in calculating average flow velocities. When comparing computed and observed travel durations of the lahar in different river sections, FLO-2D yielded significantly longer times and increasingly under-estimated velocity where slope gradient is low. Nonetheless model results showed a satisfactory match with reality, which is necessary to apply the programs for hypothetical lahar scenarios from Nevado del Huila.
Scenario modeling
Definition of future lahar scenarios is inherently uncertain. The volumes applied in the scenario modeling are within one order of magnitude of past events, and represent worst-case scenarios related to volcano-glacier interactions or a partial collapse of the volcano. The collapse of entire flanks is not included as a scenario, as such processes can hardly be modeled in a realistic way (Carrasco-Núñez et al.2006). The modeled inundation depths (Table4) form the basis for hazard mapping and the identification of safe places to be used in an emergency. In addition, calculated arrival times of the flow provide indications about times available for evacuation in the case of a lahar alert. As the applied programs tend to slightly overestimate inundation depths, results can be seen as worst-case inundation depths, which are useful for planning purposes.
The use of two totally different programs, calibrated and tested with the April 2007 lahar event, enhances the robustness of results. For the lahar scenario of 300 million m3, modeled inundation depths differ by 3 m or 10% between the programs. Scott et al. (2001) reported inundation depths of 40 and 20 m at Tóez and Belalcázar, respectively, for the 320 million m3lahar in 1994. Model results of the 300 million m3scenario are∼25 and 20 m, for
the same locations. For a lahar volume of 600 million m3, model results vary by 4.5 m or 12% from each other, and for the largest scenario, FLO-2D and LAHARZ model outputs differ by 4.5 m or 9%. This shows that modeled inundation depths differ by ∼10% between both programs for the scenarios.
Lahar travel times are less accurately modeled as already seen in the model validation process. They range between 1 (1 billion m3) and 1.5 h (300 million m3) between Tóez/ Pueblo Nuevo and Paicol.
The limiting factors for a hazard assessment mainly lie in the uncertainties of scenario definition and incomplete understanding of lahar flow and deposition. Nevertheless, data on past events and model results show that several communities in the Páez and Simbola valleys are located in a hazardous zone. They, therefore, can use this robust scenario modeling for planning and to implement adapta-tion and mitigaadapta-tion measures.
Conclusions
Very large water-sediment flows, on the order of several tens to hundreds of millions of cubic meters, are generally difficult to model with current capabilities. An appropriate way to increase the confidence of model results is to test flow models with data from past events. Direct measure-ments of past lahars, however, are rare and field evidence is often the only way to reconstruct flow dimension and dynamics. The Nevado del Huila volcano with its recent lahar events is an important case for the improvement of process understanding. A careful analysis of the April 2007 lahar allowed reconstruction of crucial flow parameters, which was necessary for the calibration and validation of the flow models FLO-2D and LAHARZ. The reconstruc-tion of the flow hydrographs was an important contribureconstruc-tion for the understanding of this lahar. Based on flow parameters obtained with the April 2007 lahar, possible scenarios for future lahars were simulated to provide data for hazard delineation and hazard mapping. Despite limitations, model results are reasonable and inundation depths calculated by the programs differed by only 10% from each other. Inundation depths calculated by FLO-2D and LAHARZ depart by ∼25% and ∼35%, respectively, from measured depths of the 2007 lahar event. Modeled inundation depths and flow velocities for future scenarios are an important contribution for hazard assessment and risk reduction. However, in order to reduce uncertainties and to further improve the quality of model output, more studies on very large events are needed. Material entrain-ment has shown to be a crucial factor in lahars, as it controls flow behavior and renders numerical modeling more difficult and uncertain. Further research should,
therefore, focus on lahar modeling in settings where sediment transport is a flow dominant component.
Acknowledgments We would like to thank Adriana Agudelo and Martha Calvache for inviting us to Colombia and for working with INGEOMINAS. Special thanks are addressed to all other persons from INGEOMINAS who supported us in different ways within the present study. For the calibration of LAHARZ, we appreciate advice from Steve Schilling from USGS. We are very grateful for his collaboration and his inputs. USGS also provided satellite images for this work, which were very useful for glacier investigations. The study has been supported financially by the Swiss Agency for Development and Cooperation. We appreciate the constructive reviews of Thomas Pierson, Lucia Capra, the associate editor Hugo Delgado and the executive editor James White.
References
Arattano M (1999) Monitoring the propagation of a debris flow along a torrent. Hydrol Sci 44(5):811–823
Ávila G, Caro P, Cepeda H, Moreno M, Torres P, Agudelo A (1995) Zonificación para uso del suelo en la cuenca del río Páez. Jornadas geotécnicas. Soc Ingen Soc Colomb Geotech 8:78–102 Baker VR (2000) Palaeoflood hydrology and the estimation of extreme floods. In: Wohl EE (ed) Inland flood hazards: human, riparian and aquatic communities. Cambridge University Press, Cambridge, pp 359–377
Berti M, Simoni A (2007) Prediction of debris flow inundation areas using empirical mobility relationships. Geomorphology 90:144–161 Calderón Y, Ávila G, Ojeda J (1997) Estudio de amenazas y
zonificación geologica de la cuenta del Rio Páez, Cauca. 2nd Pan-Am Symp Landslides, 2nd COBRAE. Rio de Janeiro Canuti P, Casagli N, Catani F, Falorni G (2002) Modeling of the
Guagua Pichincha volcano (Ecuador) lahars. Phys Chem Earth 27:1587–1599
Capra L (2007) Volcanic natural dams: identification, stability and secondary effects. Nat Hazard 43:45–61
Capra L, Poblete MA, Alvarado R (2004) The 1997 and 2001 lahars of Popocatépetl volcano (Central Mexico): textural and sedimen-tological constraints on their origin and hazards. J Volcanol Geotherm Res 131:351–369
Carrasco-Núñez G, Díaz-Castellón R, Siebert L, Hubbard B, Sheridan MF, Rodríguez SR (2006) Multiple edifice-collapse events in the Eastern Mexican Volcanic Belt: The role of sloping substrate and implications for hazard assessment. J Volcanol Geotherm Res 158 (1–2):151–176
Carrivick JL (2006) Application of 2D hydrodynamic modelling to high-magnitude outburst floods: an example from Kverkfjöll, Iceland. J Hydrol 321:187–199
Carrivick JL, Manville V, Cronin SJ (2009) A fluid dynamics approach to modelling the 18th March 2007 lahar at Mt. Ruapehu, New Zealand. B Volcanol 71:153–169
Cenderelli DA, Wohl EE (2003) Flow hydraulics and geomorphic effects of glacial-lake outburst floods in the Mount Everest region, Nepal. Earth Surf Proc Land 28:385–407
Coussot P (1997) Mudflow rheology and dynamics. IAHR monograph series. A.A. Balkema, Rotterdam, p 255
Davila N, Capra L, Gavilanes-Ruiz JC, Varley N, Norini G (2007) Recent lahars at Volcán de Colima (Mexico): drainage variation and spectral classification. J Volcanol Geotherm Res 165:127– 141
FLO-2D Software I (2009) FLO-2D User's Manual. Available at:
www.flo-2d.com
Hubbard BE, Sheridan MF, Carrasco-Núñez G, Díaz-Castellón R, Raúl Rodríguez S (2007) Comparative lahar hazard mapping at Volcan Citlaltépetl, Mexico using SRTM, ASTER and DTED-1 digital topographic data. J Volcanol Geotherm Res 160(1–2):99– 124
Huggel C, Ceballos JL, Pugarín B, Ramírez J, Thouret J-C (2007) Review and reassessment of hazards owing to volcano-glacier interactions in Colombia. Ann Glaciol 45:128–136
Huggel C, Schneider D, Miranda PJ, Delgado Granados H, Kääb A (2008) Evaluation of ASTER and SRTM DEM data for lahar modeling: a case study on lahars from Popocatépetl Volcano, Mexico. J Volcanol Geotherm Res 170(1–2):99–110
Iverson RM, Vallance JM (2001) New views of granular mass flows. Geology 29(2):115–118
Iverson RM, Schilling SP, Vallance JW (1998) Objective delineation of lahar-inundation hazard zones. Geol Soc Am Bull 110(8):972–984 Jakob M, Hungr O (2005) Debris flow hazards and related
phenomena. Springer, Berlin
Jakob M, Hungr O, Pierson TC (2005) Hyperconcentrated flow— transitional process between water flow and debris flow. In: Debris flow hazards and related phenomena. Springer, Berlin, pp. 159–202 Lavigne F, Thouret JC (2002) Sediment transportation and deposition by rain-triggered lahars at Merapi Volcano, Central Java, Indonesia. Geomorphology 49:45–69
Lavigne F, Thouret J-C, Voight B, Young K, La Husen R, Marso J, Suwa H, Sumaryono A, Sayudi DS, Dejean M (2000) Instru-mental lahar monitoring at Merapi Volcano, Central Java, Indonesia. J Volcanol Geotherm Res 100:457–478
Major JJ, Newhall CG (1989) Snow and Ice perturbation during historical volcanic eruptions and the formation of lahars and floods. B Volcanol 52:1–27
Martínez JM, Ávila G, Agudelo A, Schuster RL, Casadevall TJ, Scott KM (1995) Landslides and debris flows triggered by the 6 june 1994 Páez earhquake, southwestern Colombia. Landslide News 9:13–15
Muñoz-Salinas E, Manea VC, Palacios D, Castillo-Rodriguez M (2007) Estimation of lahar flow velocity on Popocatépetl volcano (Mexico). Geomorphology 92(1–2):91–99
O'Brien JS (2003) Reasonable assumptions in routing a dam break mudflow. In: Rickenmann D, Chen CL (eds) Debris-flows hazard mitigation: mechanics, prediction, and assessment. Millpress, Rotterdam, pp 683–693
O'Brien JS, Julien PY (1988) Laboratory analysis of mudflow properties. J Hydraul Eng ASCE 119(2):244–259
O'Brien JS, Julien PY, Fullerton WT (1993) Two-dimensional water flood and mudflow simulation. J Hydraul Eng ASCE 119 (2):244–261
Pierson TC (1998) An empirical method for estimating travel times for wet volcanic mass flows. B Volcanol 60:98–109
Pierosn TC, Scott KM (1985) Downstream dilution of a lahar: transition from debris flow to hyperconcentrated streamflow. Water Resour Res 21(10):1511–1524
Pierson TC, Janda RJ, Thouret J-C, Borrero CA (1990) Perturbation and melting of snow and ice by the 13 November 1985 eruption of Nevado del Ruiz, Colombia, and consequent mobilization, flow and deposition of lahars. J Volcanol Geotherm Res 41:17–66 Pulgarín B, Cardona C, Calvache M, Lockhart A, White R (2007) Huila lahars caused by rapid, voluminous water expulsion. In: Abstract volume cities on volcanoes 5 conference, Shimabara, Japan, p 113
Pulgarín B, Jordan E, Linder W (1996) Nevado del Huila (Colombia): Cambio glaciar entre 1961 y 1995. In: Proceedings VII Congreso Colombiano de Geología. Tome I, Ingeominas, Santafé de Bogotá, pp 440–451
Pulgarín B, Macías JL, Cepeda H, Capra L (2004) Late pleistocene deposits associated with a southern flank collapse of the Nevado
del Huila volcanic complex (Colombia). Acta Volcanol 16(1– 2):37–58
Rabus B, Eineder M, Roth A, Bamler R (2003) The shuttle radar topography mission—a new class of digital elevation models acquired by spaceborn radar. ISPRS J Photogramm 57:241– 262
Schatzmann M (2005) Rheometry for large particle fluids and debris flows. Dissertation, ETH Zurich, Switzerland
Scott KM, Macías JL, Naranjo JA, Rodriguez S, McGeehin JP (2001) Catastrophic debris flows transformed from landslides in volca-nic terrains: mobility, hazard assessment, and mitigation strate-gies. U.S. Geological Survey Professional Paper 1630
Smith GA, Lowe DR (1991) Lahars: volcano-hydrologic events and deposition in the debris flow—hyperconcentrated flow continu-um. In: Smith GA, Fisher RV (eds) Sedimentation in volcanic settings. SEPM (Society for Sedimentary Geology), Tulsa, pp 59–70
Stevens NF, Manville V, Heron DW (2002) The sensitivity of a volcanic flow model to digital elevation model accuracy:
experi-ments with digitised map contours and interferometric SAR at Ruapehu and Taranaki volcanoes, New Zealand. J Volcanol Geotherm Res 119:89–105
Stolz A, Huggel C (2008) Debris flows in the Swiss National Park: the influence of different flow models and varying DEM grid size on modeling results. Landslides 5:311–319
Thouret J-C (1990) Effects of the November 13, 1985 eruption on the snow pack and ice cap of Nevado del Ruiz volcano, Colombia. J Volcanol Geotherm Res 41:177–201
USGS (2011) Verified roughness characteristics of natural channels. Available at: http://wwwrcamnl.wr.usgs.gov/sws/fieldmethods/ Indirects/nvalues/index.htm. Accessed 10 March 2011
Van Westen CJ, Daag AS (2005) Analysing the relation between rainfall characteristics and lahar activity at Mount Pinatubo, Philippines. Earth Surf Proc Land 30(13):1663–1674
Vignaux M, Weir GJ (1990) A general model for Mt. Ruapehu lahars. B Volcanol 52(5):381–390
Weir GJ (1982) Kinematic wave theory for Ruapehu lahars. N Z J Sci 25(3):197–203